. 2020 Sep 30;40(40):7668-7687.
doi: 10.1523/JNEUROSCI.0261-20.2020. Epub 2020 Aug 28.

Parvalbumin and Somatostatin Interneurons Contribute to the Generation of Hippocampal Gamma Oscillations

Affiliations

Parvalbumin and Somatostatin Interneurons Contribute to the Generation of Hippocampal Gamma Oscillations

Pantelis Antonoudiou et al. J Neurosci. .

Abstract

γ-frequency oscillations (30-120 Hz) in cortical networks influence neuronal encoding and information transfer, and are disrupted in multiple brain disorders. While synaptic inhibition is important for synchronization across the γ-frequency range, the role of distinct interneuronal subtypes in slow (<60 Hz) and fast γ states remains unclear. Here, we used optogenetics to examine the involvement of parvalbumin-expressing (PV+) and somatostatin-expressing (SST+) interneurons in γ oscillations in the mouse hippocampal CA3 ex vivo, using animals of either sex. Disrupting either PV+ or SST+ interneuron activity, via either photoinhibition or photoexcitation, led to a decrease in the power of cholinergically induced slow γ oscillations. Furthermore, photoexcitation of SST+ interneurons induced fast γ oscillations, which depended on both synaptic excitation and inhibition. Our findings support a critical role for both PV+ and SST+ interneurons in slow hippocampal γ oscillations, and further suggest that intense activation of SST+ interneurons can enable the CA3 circuit to generate fast γ oscillations.SIGNIFICANCE STATEMENT The generation of hippocampal γ oscillations depends on synchronized inhibition provided by GABAergic interneurons. Parvalbumin-expressing (PV+) interneurons are thought to play the key role in coordinating the spike timing of excitatory pyramidal neurons, but the role distinct inhibitory circuits in network synchronization remains unresolved. Here, we show, for the first time, that causal disruption of either PV+ or somatostatin-expressing (SST+) interneuron activity impairs the generation of slow γ oscillations in the ventral hippocampus ex vivo We further show that SST+ interneuron activation along with general network excitation is sufficient to generate high-frequency γ oscillations in the same preparation. These results affirm a crucial role for both PV+ and SST+ interneurons in hippocampal γ oscillation generation.

Keywords: gamma; hippocampus; interneuron; oscillation; parvalbumin; somatostatin.


Figures

Figure 1.
Figure 1.
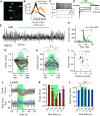
Sustained photoinhibition of PV+ interneurons suppresses the power of γ oscillations. A, Confocal image of ventral hippocampus slice from a PV-cre mouse injected intrahippocampally with AAV-Arch3 eYFP. CA3, Cornu ammonis 3; DG, dentate gyrus; Pyr., stratum pyramidale; Rad., stratum radiatum; Or., stratum oriens. Scale bar, 200 μm. B, Current-clamp recording of an ArchT-GFP-expressing PV+ cell from CA3 area, showing responses to depolarizing and hyperpolarizing current steps, and fast-spiking phenotype. C, Potent hyperpolarization of four PV+ interneurons during green light illumination in aCSF (1.45 mW). D, Illustration of the electrophysiological setup, with colored line indicating the region of CA3 stratum pyramidale from which recordings were obtained. E, Cholinergically induced oscillations (5 μm Cch) were suppressed during PV+ interneuron photoinhibition (LED, 530 nm, ∼4.25 mW). F, Representative power spectra before (black) and during (green) LED illumination (arrows indicate peaks in the power spectra). G, Power area in the 20-100 Hz band normalized to baseline (Pre (Off)) during (On) and after LED stimulation (Off (Post)) (n = 35). H, Peak frequency for experiments when the oscillation was not abolished (n = 31 of 35). I, Change in power area plotted against change in peak frequency. J, Stronger photoinhibition was achieved using high power laser illumination (∼18.6 mW). Top, Change in power area normalized to baseline. Bottom, Peak frequency of the oscillation calculated in 1 s bins across experiments (n = 14). K, Mean change in power area normalized to baseline (n = 14). L, Mean peak frequency for trials when the oscillation was not abolished (n = 13). *p < 0.05, **p < 0.01, ***p < 0.001. n.s., not significant, p ≥ 0.05. Changes in peak frequency were analyzed using repeated-measures ANOVA, followed by post hoc paired t tests with correction for multiple comparisons. Solid brackets represent paired t tests. Asterisks above symbols or bars represent one-sample t-test versus normalised baseline. Gray lines indicate single experiments.
Figure 2.
Figure 2.
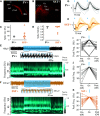
Sustained photoinhibition of SST+ interneurons suppresses γ power and increases frequency. A, Confocal image of ventral hippocampus slice from SST-cre mice with eYFP-Arch3 expression. Scale bar, 200 μm. B, Quantification of fluorescence expression profile in PV (n = 18) and SST (n = 21) ArchT-GFP-expressing slices. C, Current-clamp recording of an SST+ cell from CA3 area, showing responses to depolarizing and hyperpolarizing current steps. D, Potent hyperpolarization of four SST+ interneurons during green light illumination (1.45 mW). E, Representative LFP recordings illustrating effect of SST+ interneuron photoinhibition (LED, 530 nm, ∼4.25 mW). F, Representative power spectra before (black) and during (green) LED illumination (arrows indicate peaks in the power spectra). G, Power area in the 20-100 Hz band normalized to baseline (Pre (Off)) during (On) and after LED stimulation (Post (Off)) (n = 44). H, Peak frequency for experiments when the oscillation was not abolished (n = 33 of 44). I, Change in power area plotted against change in peak frequency. J, Effects of sustained laser illumination (∼18.6 mW) on normalized power area (top) and peak frequency (bottom) calculated in 1 s bins (n = 17). K, Mean normalized power area (n = 17). L, Mean peak frequency for trials when the oscillation was not abolished (n = 11 of 17). *p < 0.05, **p < 0.01, ***p < 0.001. n.s., not significant, p ≥ 0.05. Solid brackets represent paired t tests. Asterisks above symbols or bars represent one-sample t test versus normalised baseline. Gray lines indicate single experiments.
Figure 3.
Figure 3.
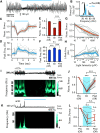
Rhythmic photoexcitation of either PV+ or SST+ interneurons entrains Cch-induced γ oscillations. A, B, Confocal images of ventral hippocampus (350 μm slice) from PV-cre (A) and SST-cre (B) mice with mCherry-ChR2 expression. Scale bar, 200 μm. C, D, Spiking responses of PV+ and SST+ interneurons during 40 Hz light pulses (1-5 ms pulse width), characterized in terms of spike rate (C) and spike fidelity (D). E, F, Entrainment of Cch-induced oscillations to 40 Hz light pulses in PV-cre (E) and SST-cre (F) mice expressing mCherry-ChR2 (1 ms pulse width; blue light illumination at 5.5 mW), shown in LFP traces (top) and normalized wavelet spectrum (bottom). Brighter colors represent larger magnitudes. G, H, Normalized average waveform following two consecutive 1 ms pulses at 40 Hz from each experiment (PV+: n = 15 of 18; SST+: n = 19 of 22). Bold line indicates the population average. Thinner lines indicate individual experiments. Shaded area represents the SEM. Arrows indicate initial negative peak. I–K, Peak frequency of oscillation before (Pre (Off)), during (On), and after (Post (Off)) light stimulation for PV+ with 1 ms pulse width (I; n = 18 of 18), PV+ with 5 ms pulse width (J; n = 13 of 13; several overlapping traces), and SST+ with 1 ms pulse width (K; n = 19 of 22). Experiments entrained at 20 Hz reflect suppression of alternate γ cycles.
Figure 4.
Figure 4.
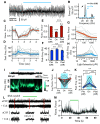
Network excitation arising from photoexcitation in SST-cre mice. A, LFP responses to 40 Hz stimulation in slices from SST-ChR2 mice recorded in aCSF (1 ms pulse width; 5.5 mW). B, Average waveform before (black) and after application of 20 μm CNQX and 40 μm AP5 (orange). C, Effect of ionotropic glutamate receptor (iGluR) blockers on the amplitude of negative (t = 0.61, p = 0.58, n.s., not significant) and positive peaks (t = 3.49, *p = 0.03, n = 4; paired t test). iGluR blockers used: 20 μm CNQX, 40 μm AP5, n = 3; 20 μm CNQX, n = 1. D, Average waveform before (black) and after application of 10 μm gabazine (GBZ; orange). E, Effect of GBZ on absolute amplitude (n = 3). F, Photoexcitation of SST+ interneurons induces epileptiform bursts during following GABAAR blockage (n = 2 at 20 μm bicuculine [BIC], n = 2 at 10 μm GBZ). Gi, Voltage-clamp recording from putative pyramidal cell during photoactivation of SST interneurons (1.53 mW), and held at 0 mV (top) and –70 mV (bottom) to isolate IPSCs and EPSCs, respectively. Gii, Across all cells, the mean EPSCs (blue) were smaller than IPSCs (orange) during SST+ interneuron photoactivation (n = 18). H, I, Perforated patch current-clamp recordings from putative CA3 pyramidal cell in SST-cre mice expressing ChR2-mcherry, showing responses to depolarizing and hyperpolarizing current steps (H), and hyperpolarization in response to light stimulation (1.53 mW; n = 6). Gray traces represent individual cells. Black trace represents the average and dark gray shaded area the SEM.
Figure 5.
Figure 5.
Sustained photoexcitation of PV+ interneurons decreases the power and increases the frequency of Cch-induced γ oscillations. A, B, Representative LFP recordings from CA3 area illustrating effect of PV+ interneurons photoexcitation (155 μW) on γ oscillations (A), along with its respective power spectrum (B; arrows indicate power spectrum peaks). C, D, Time course of normalized power area (C) and peak frequency (D), each calculated in 0.5 s bins across experiments (n = 12). E, Mean changes in normalized power area. F, Mean peak frequency (repeated-measures ANOVA: F(1.14,12.50) = 44.14, p < 0.001). G, H, Normalized power area (G) and changes in peak frequency (H) plotted against light intensity (n = 12). I, Strong and sustained blue light illumination (5.5 mW) induces a collapse of Cch-induced oscillations, as seen in LFP traces (top) and normalized wavelet spectrum (bottom). J, Effect of strong illumination on mean normalized power area (n total = 23; n = 14 at 5.5 mW and n = 9 at 2.2 mW). K, L, Strong and sustained blue light illumination does not induced increases in network activity in aCSF. ***p < 0.001. n.s., not significant, p ≥ 0.05. Solid brackets represent paired t tests. Asterisks above symbols or bars represent one-sample t test versus normalised baseline. Gray lines indicate single experiments.
Figure 6.
Figure 6.
Multiunit recordings during PV+ interneuron sustained photoexcitation in hippocampal slices with Cch-induced γ oscillations. A, Schematic diagram of the hippocampus illustrating MEA recordings during blue light illumination (5.5 mW) in CA3. B, Representative average spike waveforms of PV+ (single-unit; green) and RS (multiunit; black) neurons. C, Spike time histograms of the representative neurons during sustained light illumination. D, E, Mean spike time histograms during step illumination (D) and sinusoidal theta stimulation (8 Hz; E), calculated from the fraction of total spike counts in each bin for each clustered neuron. F, Spike phase histograms relative to ongoing γ-frequency oscillations, calculated from the fraction of total spike counts. G, Sustained activation index (top), modulation index (middle), and vector length (bottom). H, Instantaneous amplitude of the Hilbert transform during theta photoactivation (1 mW) overlaid across experiments (gray traces, n = 12). Black represents the mean. Dark gray represents SEM. Dotted lines indicate peaks and troughs in the light waveform. I, Intracellular current-clamp recordings from pyramidal cells in aCSF, showing responses to current steps (left) and hyperpolarization in response to PV+ interneuron photoactivation (right; n = 4).
Figure 7.
Figure 7.
Sustained photoexcitation of SST+ interneurons decreases the power and increases the frequency of Cch-induced γ oscillations, but can also induce high-frequency oscillations. A, B, Representative LFP recordings from CA3 area illustrating effect of SST+ interneuron photoexcitation (155 μW) on γ oscillations (A), along with the respective power spectra (B; arrows indicate peaks in the power spectra). C, D, Time course of normalized power area (C) and peak frequency (D), each calculated in 0.5 s bins across experiments (n = 12). E, Mean changes in normalized power area. F, Changes in mean peak frequency (repeated-measures ANOVA: F(1.05,11.59) = 15.05, p = 0.002). G, H, Normalized power area (G) and changes in peak frequency (H) plotted against light intensity (n = 12). I, Strong and sustained blue light illumination (5.5 mW), which does not cause the collapse of Cch-induced oscillations, induces high-frequency oscillations, as seen in LFP traces (top) and normalized wavelet spectrum (bottom). J, Normalized power during SST+ interneuron cell photoactivation (n = 31). K, Peak frequency of oscillations that were not abolished during strong light illumination (n remaining = 16 of 31: n = 4 at 5.5 mW and n = 12 at 2.2 mW; repeated-measures ANOVA: F(1.03,15.39) = 31.45, p < 0.001). Changes in peak frequency were analyzed using repeated-measures ANOVA, followed by post hoc paired t tests with correction for multiple comparisons. L, Responses to laser illumination (∼18.6 mW) in SST-cre mice expressing ArchT-GFP with and without the presence of Cch. Orange squares represent the bottom sections of LFP that were magnified. M, Changes in normalized power area calculated in 1 s bins across experiments (n = 3) in aCSF only. Dotted lines indicate the duration of laser illumination. *p < 0.05, **p < 0.01, ***p < 0.001. n.s., not significant, p ≥ 0.05. Solid brackets represent paired t tests. Asterisks above symbols or bars represent one-sample t test versus normalised baseline. Gray lines indicate single experiments.
Figure 8.
Figure 8.
Photoactivation of SST+ interneurons induces de novo oscillations in the absence of Cch. A, B, Representative LFP recordings from CA3 illustrating induction of high-frequency oscillations by step (A) and theta-modulated (B) blue light illumination (10 mW), as seen in LFP traces (top) and normalized wavelet spectrum (bottom). C, Change in log power compared with baseline during step (n = 16) and theta-modulated blue light illumination (n = 17). D, Peak frequency of the de novo oscillations is higher when induced by theta compared with tonic stimulation. ***p < 0.001 (two-sample t test). E, F, Power area (E) and peak frequency (F) plotted against light intensity of theta photoactivation (n = 12). Black line indicates the mean response. Dark-gray shaded area represents SEM. G, H, Pharmacology of de novo oscillations induced by sinusoidal blue light illumination in SST-cre mice expressing ChR2-mcherry (1-10 mW). Representative LFP recording in CA3 before (top) and after (bottom) application of (Gi) iGluR blockers and (Hi) GABAAR blockers. Power area change before (control) and after application of (Gii) iGluR blockers and (Hii) GABAAR blockers. iGluR blockers used are as follows: 20 μm CNQX, 40 μm AP5, n = 3; 10 μm CNQX, 20 μm AP5, n = 1; 20 μm CNQX, n = 1; 3 mm kynurenic acid, n = 3. GABAAR blockers are as follows: 20 μm bicuculline, n = 2; 20 μm gabazine, n = 1. I, Representative multiunit recordings of SST+ interneuron activity during step photoexcitation, showing average spike waveform, autocorrelation, phase, and step histogram. J, K, Mean spike time histograms during step illumination (J) and sinusoidal theta stimulation (8 Hz; K), calculated from the fraction of total spike counts in each bin for each clustered neuron. L, Spike phase histograms relative to ongoing γ-frequency oscillations, calculated from the fraction of total spike counts. M, Sustained activation index (top), modulation index (middle), and vector length (bottom).
Figure 9.
Figure 9.
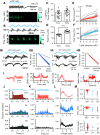
Computational model of the network effects of optogenetic modulation of interneuron activity. A, Schematic of connectivity between excitatory cells (E) and PV+ and SST+ interneurons. E and PV+ cells were modeled using Wilson-Cowan equations and SST+ using equations derived from quadratic integrate-and-fire neurons, which can show intrinsic oscillations (∼). B, Activity patterns observed in the three populations of cells when external drive to E cells is 10, and following inhibition (Arch; top) or excitation (ChR2; bottom) of either PV+ (left) or SST+ (right) populations. Inset left, Expansion of traces highlighted by the dashed box during the baseline period, showing temporal order of peak activity. Inset right, Expansion of E cell activity during the period shown by the dashed lines, showing small and fast oscillations. C, Corresponding changes in peak power (top) and oscillation frequency (bottom), following manipulation of the external drive to PV+ (left) or SST+ (right) populations. D, Plot of spike rate of E cells versus PV+ cells for the manipulations of PV+ cells (left) and plot of spike rate of E cells versus SST+ cells for manipulation of SST+ cells (right). The color of each marker represents the frequency of the network oscillation, and the size of the marker reflects peak power. Black lines join the points showing spike rates during the baseline conditions. E, Delays between the peak in E cell activity and the peak in activity for PV+ and SST+ cells across different manipulations. The size of the marker reflects the corresponding spike rate. F, Light-induced decreases in both excitatory drive and presynaptic release, aimed at mimicking laser stimulation of Arch, can lead to the collapse of the oscillations when applied to either the PV+ (left) or SST+ (right) populations.

References

    1. Akam T, Kullmann DM (2010) Oscillations and filtering networks support flexible routing of information. Neuron 67:308–320. 10.1016/j.neuron.2010.06.019 - DOI - PMC - PubMed
    1. Akam T, Oren I, Mantoan L, Ferenczi E, Kullmann DM (2012) Oscillatory dynamics in the hippocampus support dentate gyrus–CA3 coupling. Nat Neurosci 15:763–768. 10.1038/nn.3081 - DOI - PMC - PubMed
    1. Anastassiou CA, Perin R, Markram H, Koch C (2011) Ephaptic coupling of cortical neurons. Nat Neurosci 14:217–223. 10.1038/nn.2727 - DOI - PubMed
    1. Andersen P, Bliss TV, Skrede KK (1971) Unit analysis of hippocampal population spikes. Exp Brain Res 13:208–221. 10.1007/BF00234086 - DOI - PubMed
    1. Atallah BV, Scanziani M (2009) Instantaneous modulation of gamma oscillation frequency by balancing excitation with inhibition. Neuron 62:566–577. 10.1016/j.neuron.2009.04.027 - DOI - PMC - PubMed

Publication types

LinkOut - more resources