. 2020 Sep 23;40(39):7510-7522.
doi: 10.1523/JNEUROSCI.1327-20.2020. Epub 2020 Aug 28.

Prefrontal Cortex-Driven Dopamine Signals in the Striatum Show Unique Spatial and Pharmacological Properties

Affiliations

Prefrontal Cortex-Driven Dopamine Signals in the Striatum Show Unique Spatial and Pharmacological Properties

Martín F Adrover et al. J Neurosci. .

Abstract

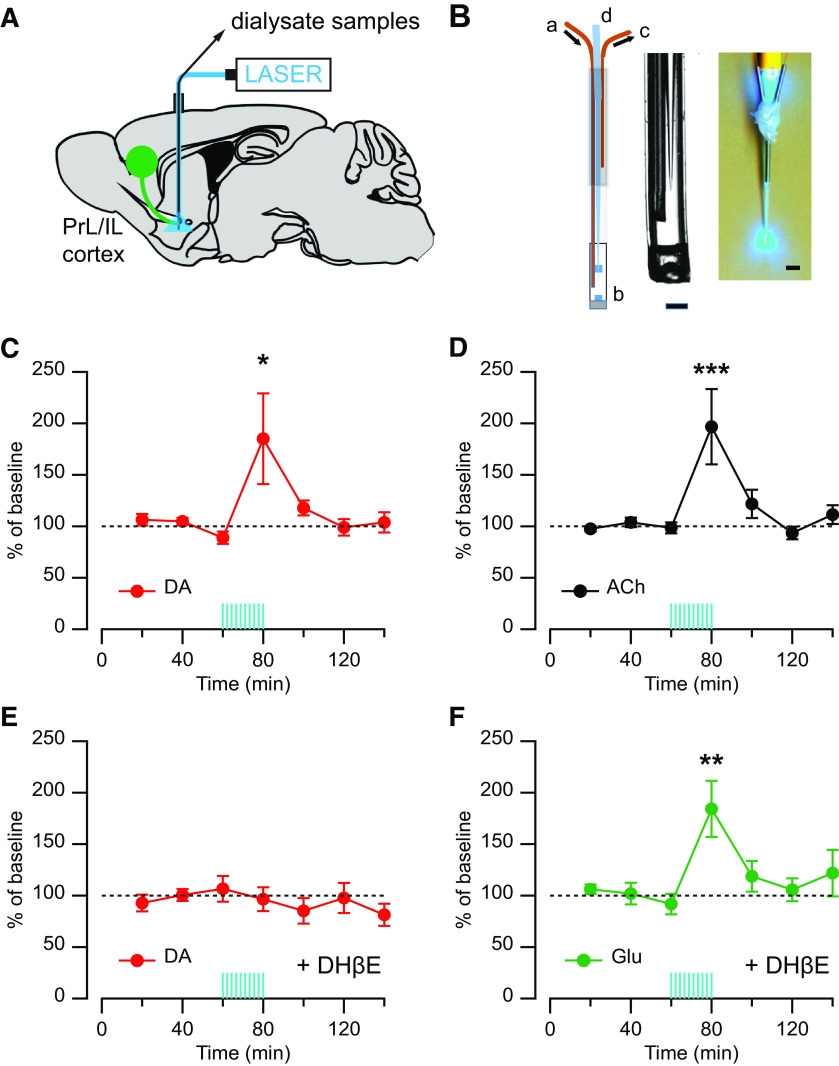
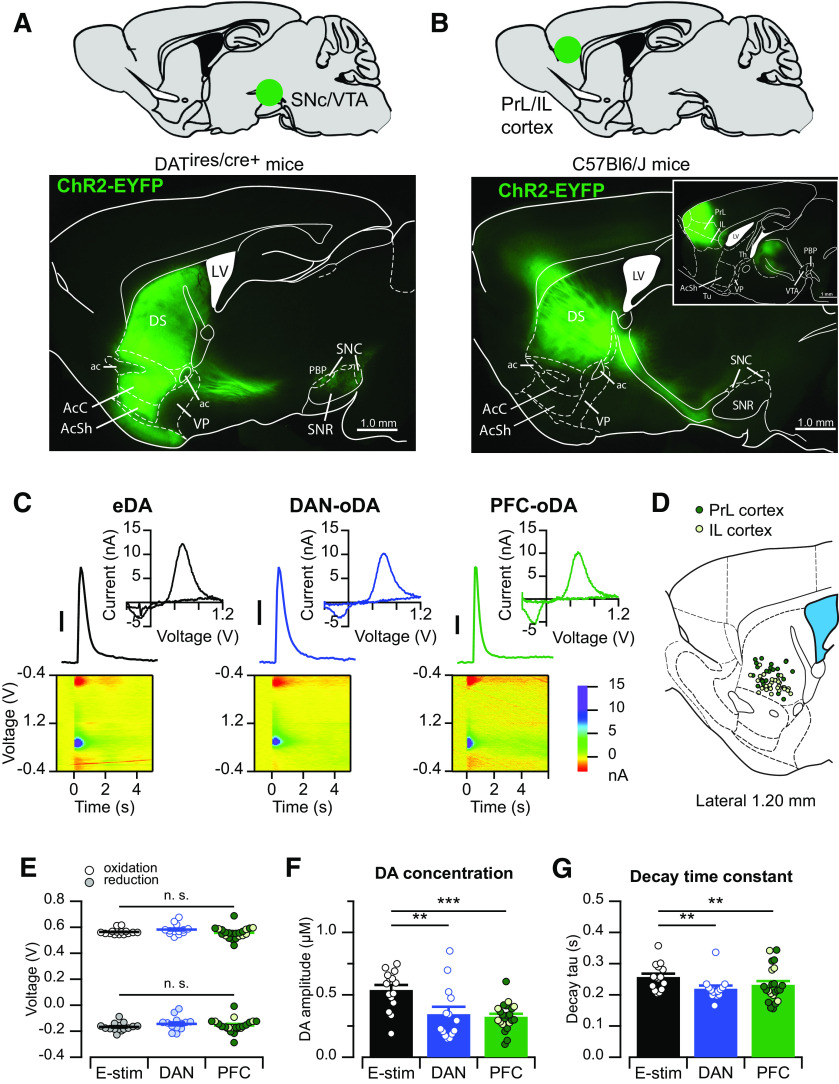
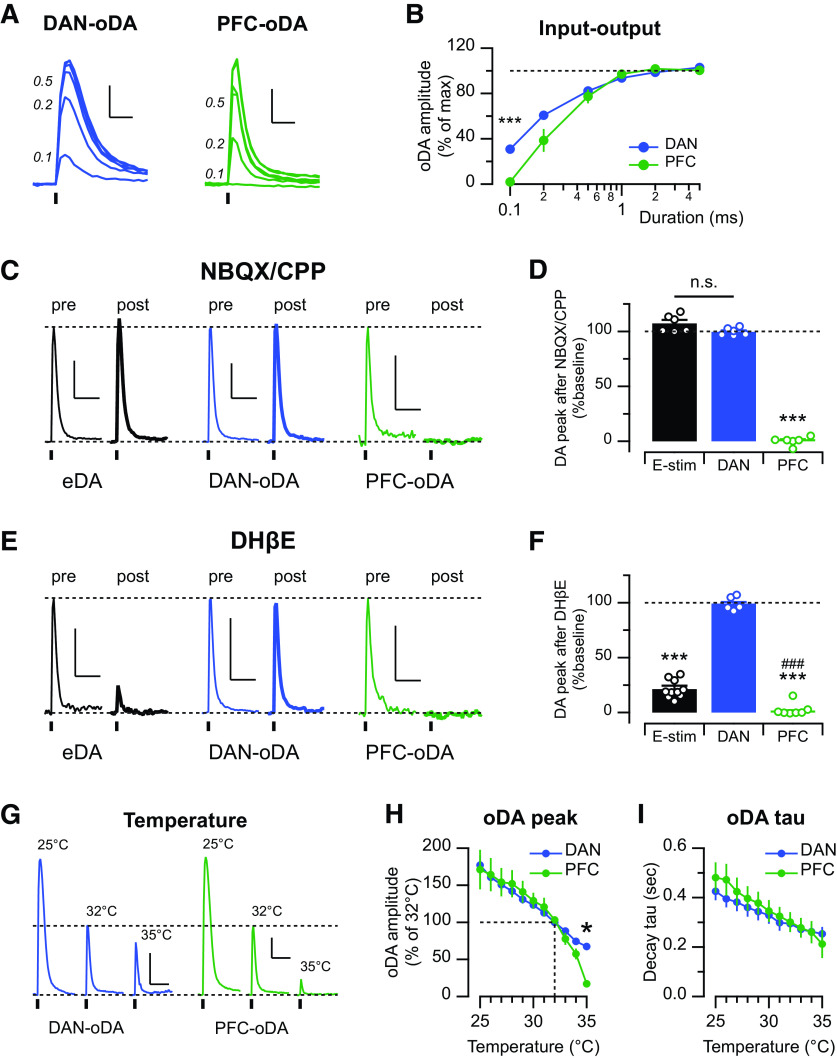
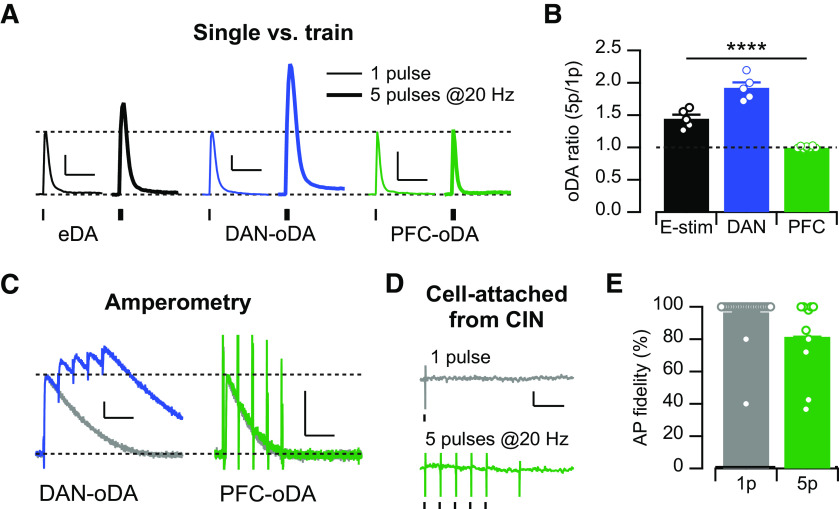
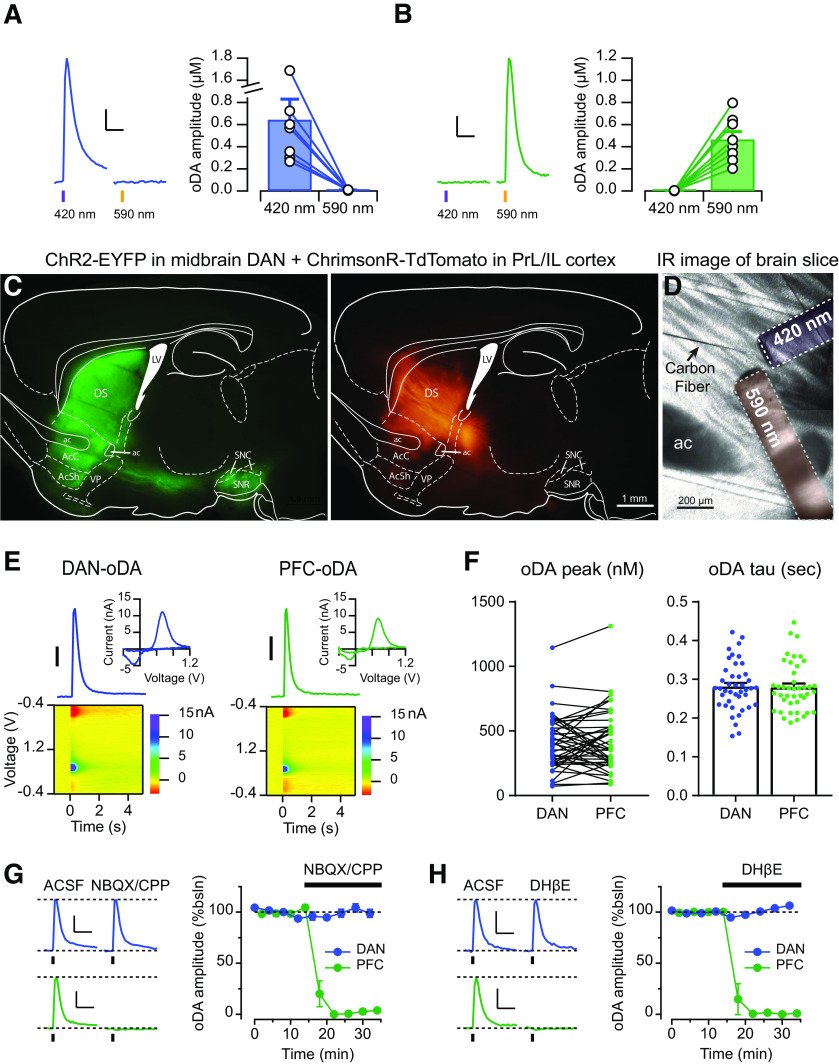
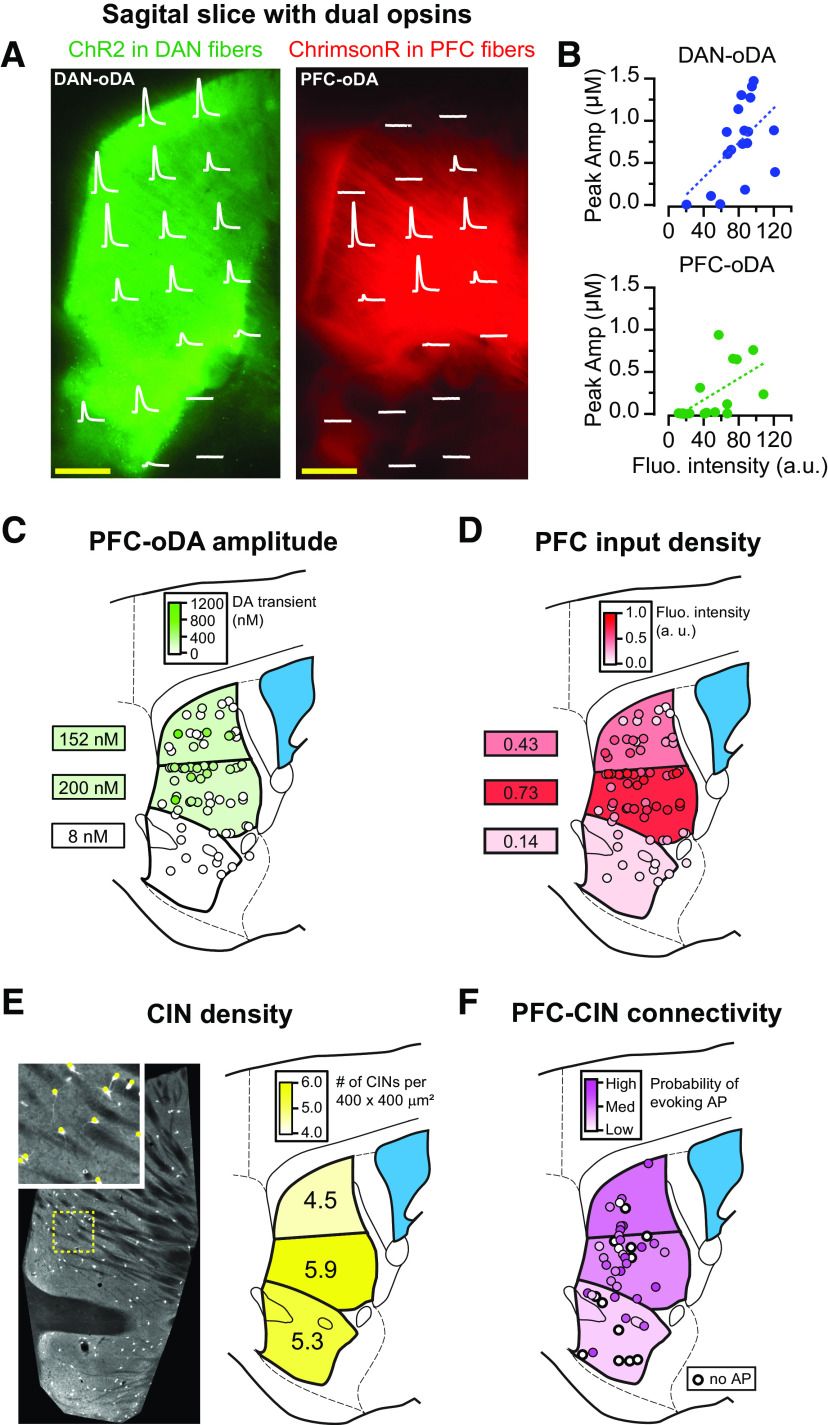
Dopamine (DA) signals in the striatum are critical for a variety of vital processes, including motivation, motor learning, and reinforcement learning. Striatal DA signals can be evoked by direct activation of inputs from midbrain DA neurons (DANs) as well as cortical and thalamic inputs to the striatum. In this study, we show that in vivo optogenetic stimulation of prelimbic (PrL) and infralimbic (IL) cortical afferents to the striatum triggers an increase in extracellular DA concentration, which coincides with elevation of striatal acetylcholine (ACh) levels. This increase is blocked by a nicotinic ACh receptor (nAChR) antagonist. Using single or dual optogenetic stimulation in brain slices from male and female mice, we compared the properties of these PrL/IL-evoked DA signals with those evoked by stimulation from midbrain DAN axonal projections. PrL/IL-evoked DA signals are undistinguishable from DAN evoked DA signals in their amplitudes and electrochemical properties. However, PrL/IL-evoked DA signals are spatially restricted and preferentially recorded in the dorsomedial striatum. PrL/IL-evoked DA signals also differ in their pharmacological properties, requiring activation of glutamate and nicotinic ACh receptors. Thus, both in vivo and in vitro results indicate that cortical evoked DA signals rely on recruitment of cholinergic interneurons, which renders DA signals less able to summate during trains of stimulation and more sensitive to both cholinergic drugs and temperature. In conclusion, cortical and midbrain inputs to the striatum evoke DA signals with unique spatial and pharmacological properties that likely shape their functional roles and behavioral relevance.SIGNIFICANCE STATEMENT Dopamine signals in the striatum play a critical role in basal ganglia function, such as reinforcement and motor learning. Different afferents to the striatum can trigger dopamine signals, but their release properties are not well understood. Further, these input-specific dopamine signals have only been studied in separate animals. Here we show that optogenetic stimulation of cortical glutamatergic afferents to the striatum triggers dopamine signals both in vivo and in vitro These afferents engage cholinergic interneurons, which drive dopamine release from dopamine neuron axons by activation of nicotinic acetylcholine receptors. We also show that cortically evoked dopamine signals have other unique properties, including spatial restriction and sensitivity to temperature changes than dopamine signals evoked by stimulation of midbrain dopamine neuron axons.

Keywords: DA release; PFC; dorsomedial striatum; fast-scan cyclic voltammetry; optogenetics.


Figures

Figure 1.
Figure 1.
Effect of the nAChR antagonist DHβE on the extracellular DA level evoked by local optogenetic stimulation of PFC fibers in vivo. A, Diagram showing the injection of ChR2-EYFP in the PrL and IL cortices (green circle) and projection to the striatum with the microdialysis-optogenetics probe in a sagittal brain view. B, Left, Optogenetic-microdialysis probe schematics: a, liquid inlet; b, dialysis membrane; c, liquid outlet; d, sculpted optic fiber. Middle, Probe tip detail. Scale bar, 0.2 mm. Right, Picture of the optogenetic-microdialysis probe showing light spread pattern at the probe tip. Scale bar, 1 mm. C, D, Time course of extracellular concentrations of (C) DA (red) and (D) ACh (black) in the NAc. E, F, Time course of extracellular concentrations of (E) DA (red) and (F) glutamate (Glu, green) in the NAc with constant perfusion (reverse dialysis) of the nAChR antagonist DHβE (10 μm). Time 0-60 represents the values of samples before stimulation. Blue vertical lines indicate the period of optogenetic stimulation (20 min). Results are expressed as mean ± SEM of percentage of the average of three values before stimulation. *p < 0.05, **p < 0.01, ***p < 0.001.
Figure 2.
Figure 2.
Striatal DA signals evoked by midbrain and cortical inputs. A, Example of the fluorescence pattern (bottom) observed in a sagittal brain slice from a DATIRES-Cre+ mouse injected with DIO-ChR2-EYFP in the midbrain (top). B, Example of the fluorescence pattern (bottom) observed in a sagittal brain slice from a C57Bl6/J (DATIRES-Cre–) mouse injected with ChR2-EYFP in the PrL or IL cortex (top). Inset, A more medial slice with the site of injection. C, Representative DA transients, current–voltage (CV) plots, and color voltammograms when evoked by electrical stimulation (eDA, left), optogenetic stimulation of DAN fibers (DAN-oDA, middle), or optogenetic stimulation of PFC inputs (PFC-oDA, right). All three CV plots show the electrochemical profile of DA oxidation. Scale bar, 100 nM. D, A sagittal brain section modified from the Mouse Brain Atlas (Franklin and Paxinos, 2007) showing the FSCV recording sites from mice injected with ChR2-EYFP in the PrL (filled) and IL (empty) cortex. E, The oxidation (top) and reduction (bottom) voltages from the CV plots of eDA (left), DAN-oDA (middle), and PFC-oDA (right) were plotted as average with SEM. Open and filled circles represent individual values. F, DA peak concentrations and G, decay time constants of eDA (left), DAN-oDA (middle), and PFC-oDA (right) were plotted as average with SEM. Open circles represent individual values. For PFC-oDAs, the same color code was applied as in D for PrL and IL according to injection location. E–G, Data points include experiments where electrical and optogenetic stimulation was delivered alternatingly in the same slice or in different slices (see Materials and Methods). **p < 0.01, ***p < 0.001. LV, Lateral ventricle; DS, dorsal striatum; ac, anterior commissure; AcC, accumbens core; AcSh, accumbens shell; VP, ventral pallidum; PBP, parabrachial pigmented nucleus; SNR, substantia nigra reticulata; Th, thalamus; Tu, olfactory tubercle. n.s., not significant.
Figure 3.
Figure 3.
DAN-oDA and PFC-oDA show different physical and pharmacological properties. A, Representative DAN-oDA (left) and PFC-oDA (right) transients evoked with different light pulse duration (in ms). Scale bar, 100 nM, 0.5 s. B, oDA amplitudes normalized to their maximum response were averaged and plotted as a function of the stimulus duration. C, Representative traces of eDA, DAN-oDA, and PFC-oDA transients before and after bath application of the glutamate receptor antagonists, NBQX and CPP (both 5 μm). Dotted line (top) indicates the amplitude of DA transients before the drugs. Scale bar, 200 nM, 2 s. D, Averages with SEM of DA amplitude after NBQX and CPP were plotted. Open circles represent individual value. E, Representative traces of eDA, DAN-oDA, and PFC-oDA transients before and after bath application of the β2-contatining nAChR antagonist, DHβE (1 μm). Scale bar, 200 nM, 2 s. F, Averages with SEM of DA amplitude after DHβE were plotted. Open circles represent individual value. ***Versus DAN-oDA. ###Versus eDA. G, Representative traces of DAN-oDA (left) and PFC-oDA (right) transients at 25°C, 32°C, and 35°C. Dotted line (top) indicates the oDA amplitude at 32°C. Scale bar, 200 nM, 2 s. H, Average oDA peak amplitudes normalized to 32°C. I, Average oDA decay time constants were plotted as a function of temperature. *p < 0.05, ***p < 0.001, ###p < 0.001, n.s., not significant.
Figure 4.
Figure 4.
PFC-oDA shows no summation by train stimulations. A, Representative DA traces of eDA, DAN-oDA, and PFC-oDA transients evoked by single pulse (1p, thin traces) or train of 5 pulses at 20 Hz (5p, thick traces). Scale bar, 200 nM, 2 s. B, Averages with SEM of the DA amplitude ratio (5p/1p) for eDA, DAN-oDA, and PFC-oDA transients were plotted. Open circles represent individual values. C, Representative amperometric traces for DAN-oDA (left) and PFC-oDA (right) transients evoked by single pulse (gray traces) or train of 5 pulses at 20 Hz (color traces). PFC-oDA amperometric transients evoked by 50 at 20 Hz were indistinguishable from 1p stimulation, except the large deflection at the stimulation time for 5p pulses. Scale bars: 200 pA, 100 ms. D, Representative cell-attached recordings from CINs with single (top, gray) or train of 5 pulses at 20 Hz (bottom, green). Scale bars: 20 pA, 100 ms. E, Averages with SEM of the action potential fidelity were plotted for the single pulse and train stimulation. Open circles represent individual values. ****p < 0.0001.
Figure 5.
Figure 5.
Dual-opsin expression to evoke cortical and midbrain DA signals in the same brain slices. A, B, Left, Representative traces of DA signals evoked by either 420 or 590 nm light pulses from mice expressing (A) only ChR2 in midbrain DANs or (B) only ChrimsonR in PrL/IL cortex. Right, oDA amplitudes were plotted as pairs for each wavelength. Scale bars: 200 nM for A 100 nM for B; 1s C, Example of the fluorescence patterns with filter set for yellow signal (left) or red signal (right) from a sagittal brain slice of a DATIRES-Cre+ mice injected with ChrimsonR-TdTomato in the PFC and DIO-ChR2-EYFP in the midbrain. D, Configuration to the FSCV DA recording using a carbon fiber and two fiber-optics delivering 420 and 590 nm, respectively. E, Representative DA transients, CV plots, and color voltammograms of DAN-oDA and PFC-oDA. Scale bar: 100 nM F, Left, Amplitudes were plotted as pairs for DAN-oDA and PFC-oDA recorded from the same slices. Right, Averages with SEM of decay time constant were plotted for DAN-oDA and PFC-oDA. Dots represent individual values. G, Left, Representative traces of DAN-oDA (top) and PFC-oDA (bottom) before and after the application of glutamate receptor antagonists NBQX and CPP. Right, Averages with SEM of DAN-oDA and PFC-oDA were plotted as a function of time as NBQX/CPP was applied. H, Left, Representative traces of DAN-oDA (top) and PFC-oDA (bottom) before and after the application of nAChR antagonists DHβE. Right, Averages with SEM of DAN-oDA and PFC-oDA were plotted as a function of time as DHβE was applied. Scale bars for GH: 100 nM; 1 s.
Figure 6.
Figure 6.
Cortically evoked DA signals are spatially restricted. A, The locations of carbon fiber and two fiber-optics were adjusted to measure DAN-oDA (left) and PFC-oDA (right) from each location where the corresponding oDAs were superimposed on the fluorescence patterns. Scale bars, 500 µm. B, Peak amplitudes of DAN-oDA (top) and PFC-oDA (bottom) were plotted as a function of florescence intensity at each location shown in A. Dotted lines indicate linear regression between the oDA amplitudes and the fluorescence intensities. C, PFC-oDAs were measured from 74 locations (between ∼1.0 and 1.2 mm in mediolateral coordinate) of mice injected with ChR2-EYFP in PrL/IL cortex and color-coded according to their peak DA concentrations. The average PFC-oDA amplitudes were calculated and color-coded for the three subregions. D, The PFC input fluorescence intensities were color-coded for the same 74 locations in C. The averages from the three subregions were calculated and color-coded. E, Left, Fluorescence image of striatal CINs labeled with td-Tomato. Inset, Examples of identified CINs (red) from the area with the dotted yellow line. Right, The average numbers of CINs per 400 × 400 µm2 (area as shown in the inset) were calculated and shown for the three subregions. F, Using cell-attached patch recording, action potentials evoked by PFC stimulation were observed from a total of 46 CINs. For each CIN, a minimum light intensity to evoke action potentials was determined to score the connectivity. White circles with a thicker line represent CINs which did not show any evoked action potentials even with the maximum light intensity.

References

    1. Adrover MF, Shin JH, Alvarez VA (2014) Glutamate and dopamine transmission from midbrain dopamine neurons share similar release properties but are differentially affected by cocaine. J Neurosci 34:3183–3192. 10.1523/JNEUROSCI.4958-13.2014 - DOI - PMC - PubMed
    1. Backman CM, Malik N, Zhang Y, Shan L, Grinberg A, Hoffer BJ, Westphal H, Tomac AC (2006) Characterization of a mouse strain expressing Cre recombinase from the 3′ untranslated region of the dopamine transporter locus. Genesis 44:383–390. 10.1002/dvg.20228 - DOI - PubMed
    1. Burke DA, Rotstein HG, Alvarez VA (2017) Striatal local circuitry: a new framework for lateral inhibition. Neuron 96:267–284. 10.1016/j.neuron.2017.09.019 - DOI - PMC - PubMed
    1. Cachope R, Mateo Y, Mathur BN, Irving J, Wang HL, Morales M, Lovinger DM, Cheer JF (2012) Selective activation of cholinergic interneurons enhances accumbal phasic dopamine release: setting the tone for reward processing. Cell Rep 2:33–41. 10.1016/j.celrep.2012.05.011 - DOI - PMC - PubMed
    1. Chuhma N, Mingote S, Moore H, Rayport S (2014) Dopamine neurons control striatal cholinergic neurons via regionally heterogeneous dopamine and glutamate signaling. Neuron 81:901–912. 10.1016/j.neuron.2013.12.027 - DOI - PMC - PubMed

Publication types

MeSH terms

LinkOut - more resources