. 2020 Sep 15;117(37):22932-22943.
doi: 10.1073/pnas.2008523117. Epub 2020 Aug 28.

A pathogenic and clonally expanded B cell transcriptome in active multiple sclerosis

Affiliations

A pathogenic and clonally expanded B cell transcriptome in active multiple sclerosis

Akshaya Ramesh et al. Proc Natl Acad Sci U S A. .

Abstract

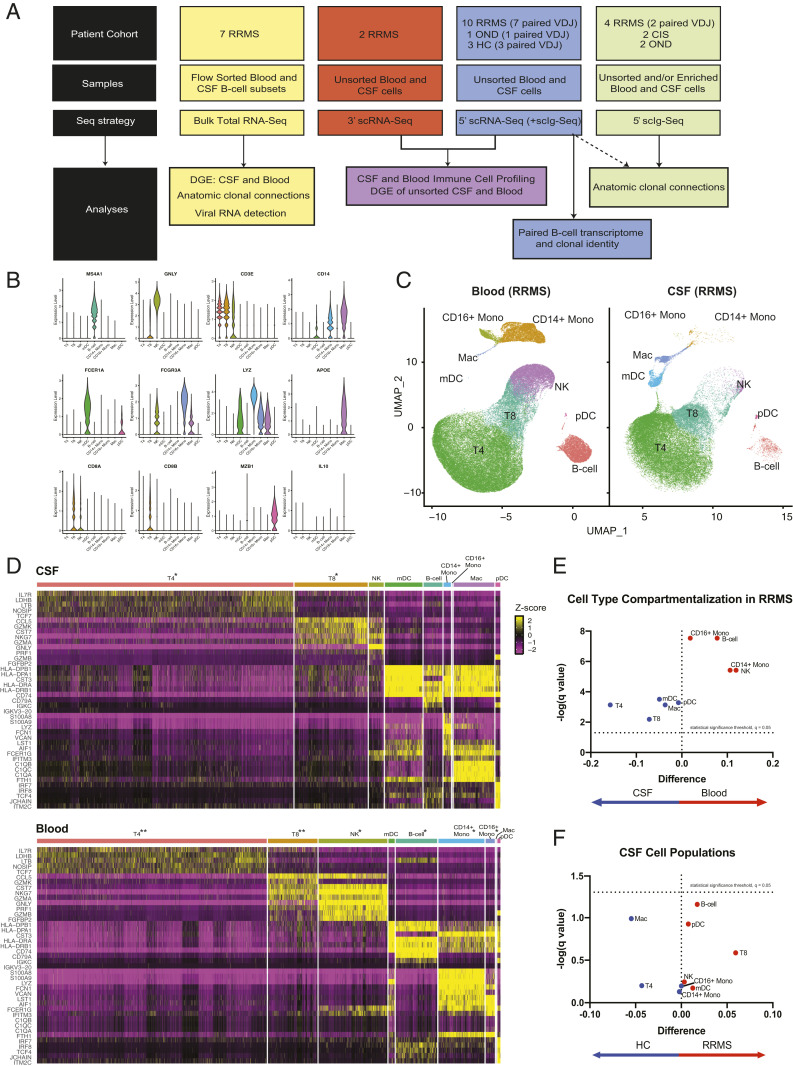
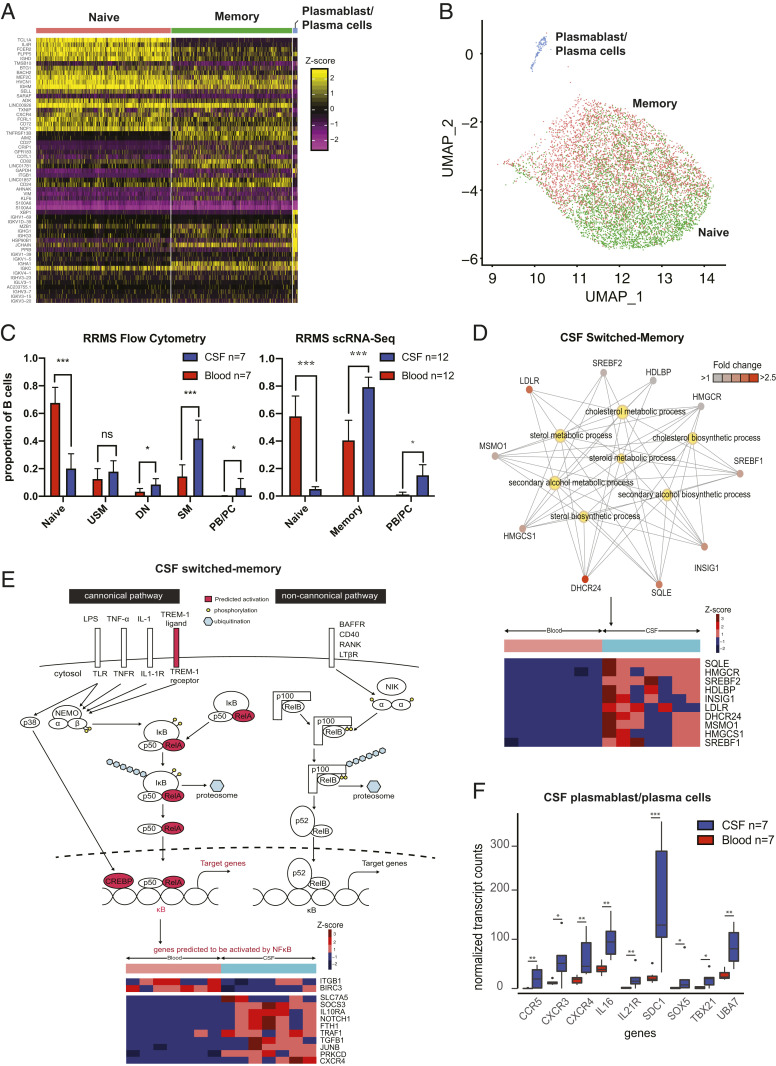
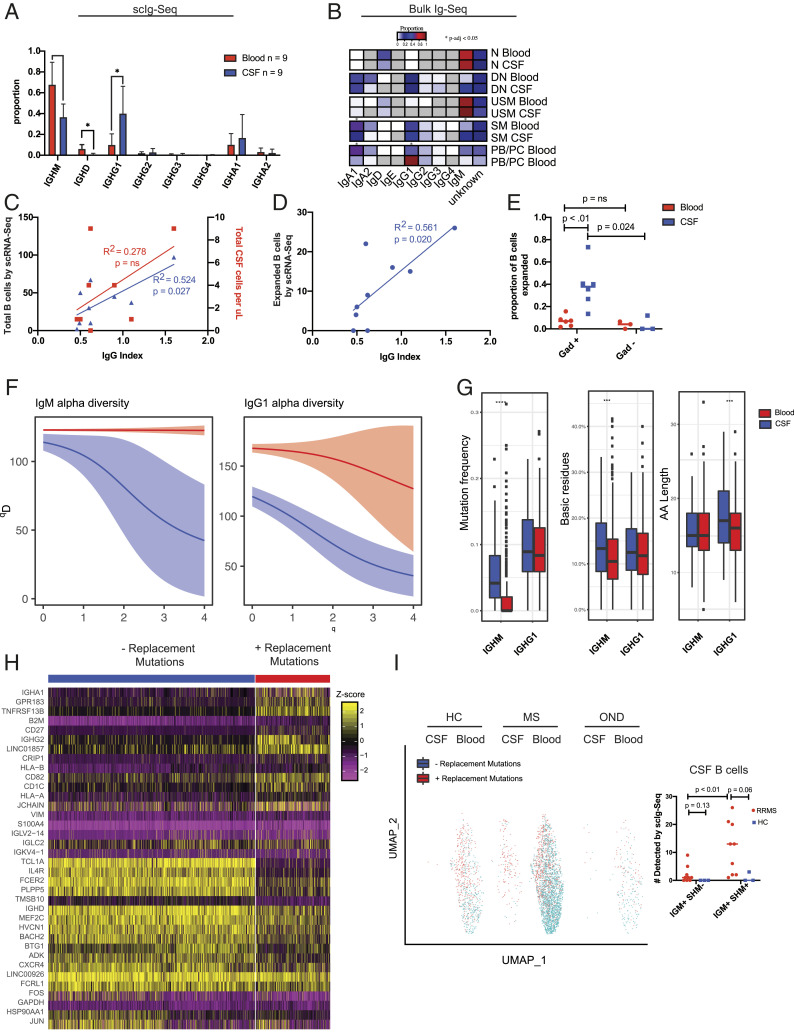
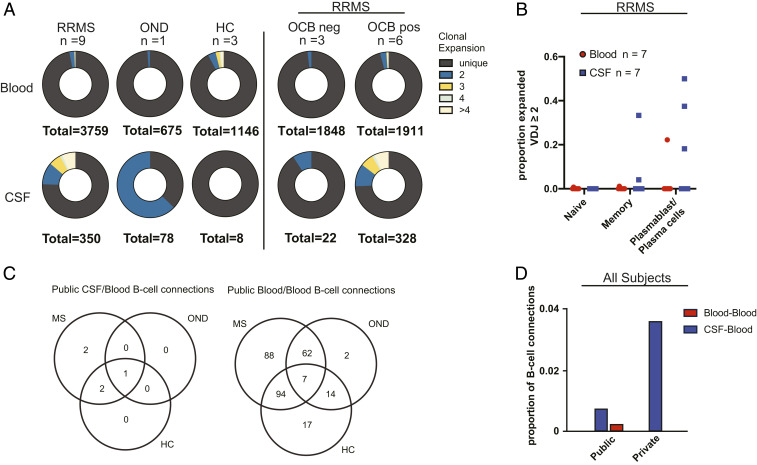
Central nervous system B cells have several potential roles in multiple sclerosis (MS): secretors of proinflammatory cytokines and chemokines, presenters of autoantigens to T cells, producers of pathogenic antibodies, and reservoirs for viruses that trigger demyelination. To interrogate these roles, single-cell RNA sequencing (scRNA-Seq) was performed on paired cerebrospinal fluid (CSF) and blood from subjects with relapsing-remitting MS (RRMS; n = 12), other neurologic diseases (ONDs; n = 1), and healthy controls (HCs; n = 3). Single-cell immunoglobulin sequencing (scIg-Seq) was performed on a subset of these subjects and additional RRMS (n = 4), clinically isolated syndrome (n = 2), and OND (n = 2) subjects. Further, paired CSF and blood B cell subsets (RRMS; n = 7) were isolated using fluorescence activated cell sorting for bulk RNA sequencing (RNA-Seq). Independent analyses across technologies demonstrated that nuclear factor kappa B (NF-κB) and cholesterol biosynthesis pathways were activated, and specific cytokine and chemokine receptors were up-regulated in CSF memory B cells. Further, SMAD/TGF-β1 signaling was down-regulated in CSF plasmablasts/plasma cells. Clonally expanded, somatically hypermutated IgM+ and IgG1+ CSF B cells were associated with inflammation, blood-brain barrier breakdown, and intrathecal Ig synthesis. While we identified memory B cells and plasmablast/plasma cells with highly similar Ig heavy-chain sequences across MS subjects, similarities were also identified with ONDs and HCs. No viral transcripts, including from Epstein-Barr virus, were detected. Our findings support the hypothesis that in MS, CSF B cells are driven to an inflammatory and clonally expanded memory and plasmablast/plasma cell phenotype.

Keywords: B cell; immune repertoire; multiple sclerosis; neuroimmunology.


Conflict of interest statement

Competing interest statement: R.D.S. served on an advisory board for Sanofi Genzyme and is currently an employee of Asceneuron SA. A.J.G. reports personal fees from Inception Sciences and Mylan Pharmaceuticals and has reported serving on an end point adjudication committee for Biogen and Medimmune. He has served on trial steering committees for Novartis and serves on the Scientific Advisory Board for Bionure. R.M.B. has received personal compensation for medical legal consulting and for consulting or serving on the advisory boards of F. Hoffmann-La Roche Ltd., Sanofi-Genzyme, and Novartis. J.M.G. has received research support to University of California, San Francisco from Genentech, personal compensation for consulting for Biogen and Alexion, and personal compensation for medical legal consulting; he has also received honoraria from Dynamed Plus for editorial work. B.A.C.C. receives personal compensation for consulting from Abbvie, Biogen, EMD Serono, GeNeuro, Novartis, and Sanofi Genzyme. S.S.Z. is Deputy Editor of Neurology, Neuroimmunology and Neuroinflammation and is an Associate Editor for Frontiers in Immunology and Frontiers in Neurology. He serves on the Advisory Committee for the American Congress on Treatment and Research in Multiple Sclerosis and on the grant review committee for the National Multiple Sclerosis Society (NMSS). Previously, he has served on the Editorial Board of the Journal of Clinical Investigation, The Journal of Immunology, and The Journal of Neurological Sciences and has been a charter member of the grant review committee for the NIH Clinical Neuroimmunology and Brain Tumors. He has served as a consultant and received honoraria from Biogen-Idec, EMD-Serono, Genzyme, Novartis, Roche/Genentech, and Teva Pharmaceuticals, Inc. and has served on Data Safety Monitoring Boards for Lilly, BioMS, Teva, and Opexa Therapeutics. Currently, S.S.Z. receives research grant support from the NIH, NMSS, Weill Institute, Race to Erase MS, and the Maisin Foundation. S.L.H. currently serves on the Scientific Advisory Board of Alector, Annexon, Bionure, and Molecular Stethoscope and on the Board of Trustees of Neurona. S.L.H. also has received travel reimbursement and writing assistance from F. Hoffmann-La Roche Ltd. and Novartis for CD20-related meetings and presentations. M.R.W. received research funding from Roche/Genentech.

Figures

Fig. 1.
Fig. 1.
Study overview and the CSF immune landscape in HCs and RRMS subjects. (A) A schematic representation and overview of sample collection, processing, and bioinformatic analysis. (B) Representative violin plots of paired CSF and blood from 5′ scRNA-Seq (n = 10 RRMS). The expression of canonical genes is shown for each of the Seurat clusters generated, with manual cell type annotations inputted for each Seurat cluster. (C) The 5′ gene expression from the samples represented in B with UMAP coordinates, and in D, heat maps for CSF (Upper) and blood (Lower) are shown. The top five genes exhibiting the strongest differential expression for each of the major lineages are displayed. The following scaling factors were chosen to maintain the overall proportion of cell types found in the CSF and blood: *Cell type down sampled by 66.67% to enable visualization of low-proportion cell types; **Cell type down sampled by 90% to enable visualization of low-proportion cell types. (E) Volcano plot of difference in proportion of each major cell type in the CSF compared with the blood with false discovery Q value of 0.05 for multiple t tests represented as a dashed line on a log scale. (F) Similar volcano plot of difference in proportion of each major cell type in RRMS vs. HC.
Fig. 2.
Fig. 2.
Single-cell and bulk profiling of B cells in RRMS. (A) Heat map of B cells from paired RRMS CSF and blood samples from the 5′ scRNA-Seq gene expression analysis (n = 10 subjects) revealing clustering into three main groups of B cells. (B) Representation of this dataset in UMAP space extracted from and zoomed in on from the UMAP coordinates represented in Fig. 1C. Annotations generated algorithmically using SingleR with the Encode reference set. (C) Flow cytometry B cell results from 7 paired RRMS blood and CSF samples for bulk RNA-Seq and 12 paired RRMS blood and CSF samples (n = 10 from 5′ and n = 2 from 3′ scRNA-Seq) from scRNA-Seq. Statistical tests were performed using the Mann–Whitney U test; mean ± SEM is shown. (D) Network diagram of CSF switched memory cells with a focus on the cholesterol biosynthesis pathways (Upper) and corresponding heat map of differentially expressed genes (Lower) in the bulk RNA-Seq cohort. Pathway data were generated using clusterProfiler. Genes are depicted as outer nodes in shades of red (corresponding to fold enrichment), while GO terms are highlighted centrally in yellow. (E) Schematic representation of upstream NF-κB pathway members predicted to be activated (Upper), and heat map of differentially expressed downstream NF-κB pathway members genes (Lower) in CSF SM cells from the bulk RNA-Seq cohort. (F) Normalized expression of genes involved in inflammatory pathways in CSF and blood plasmablast/plasma cells. PB/PC, plasmablast/plasma cells. *P < 0.05, **P < 0.01, ***P < 0.001.
Fig. 3.
Fig. 3.
Paired scIg-Seq in RRMS ties clonal B cell expansion to intrathecal Ig synthesis and blood–brain barrier breakdown and to the emergence of IgM+ B cells undergoing SHM in the CSF. (A) Isotype usage by scIg-Seq in the 5′ dataset from n = 9 paired CSF and blood RRMS subjects. Statistics were performed with Mann–Whitney U test; mean ± SD is shown. (B) Isotype usage by limited Ig-Seq data extracted from bulk RNA-Seq. (C) Linear correlation between the clinical CSF WBC count vs. total B cells by scRNA-Seq and the clinical IgG index. (D) Linear correlation between the number of expanded B cells detected by scRNA-Seq and the clinical IgG index. (E) Enrichment of clonally expanded CSF, but not blood, B cells in the same subjects with active gadolinium on MRI. Statistics performed with Mann–Whitney U test. (F) Alpha diversity plots from the Immcantation framework depicting restricted diversity in the CSF relative to the blood for both IgM+ and IgG1+ B cells (n = 9 RRMS subjects). There were too few B cells in the HCs to generate comparison plots. Blood is depicted in red, and CSF is depicted in blue. (G) Mutation frequency, basic residue count, and CDR3 length in the CSF and blood of RRMS subjects by scIg-Seq. Statistical test was performed using a Student’s t test. (H) Heat map of the top 20 most differentially expressed genes by the Seurat FindMarkers command in IgM+ B cells with and without replacement mutations. (I) UMAP of IgM+ B cells from scIg-Seq overlaid onto 5′ scRNA-Seq gene expression data from HC (n = 3; 2 had zero B cells with productive VDJ sequences), RRMS (n = 7), and OND (n = 1) subjects. Dot plot adjacent to UMAP with statistical testing comparing the total number of B cells detected in the CSF and blood with either IGM+ SHM or IGM− SHM. Statistical testing was performed with the Mann–Whitney U test. PB/PC, plasmablast/plasma cells; WBC, white blood cell. *P < 0.05, ***P < 0.001, ****P < 0.0001.
Fig. 4.
Fig. 4.
(A) Donut charts of paired scIg-Seq results from blood and CSF in RRMS (n = 9), OND (n = 1), and HC (n = 3; 2 subjects had zero CSF B cells by scIg-Seq). Adjacent plots demonstrating clonal expansion in RRMS subjects with or without unique CSF oligoclonal bands (OCBs). Unique indicates a clone seen in only one cell in a subject’s sample. Clonal expansion was further divided into clone counts of two, three, four, and more than four. (B) Dot plot of cell types with clonal expansion in seven RRMS subjects in whom overlapping gene expression data were available. (C) Venn diagrams of shared B cells, determined by highly similar Ig heavy-chain sequences in the scIg-Seq cohort from an expanded set of subjects, including those without paired CSF and blood samples and with sorted B cell subsets as listed in Fig. 1A and Dataset S1 (n = 14 RRMS, n = 3 HC, n = 3 OND, n = 2 CIS). (D) Proportions of public (present in more than one subject) and private (present in only one subject) CSF B cells connected to blood (CSF/blood) and public blood B cells connected to other blood B cells (blood/blood). Of 693 total CSF B cell connections, 5 of 693 were highly similar to blood across subjects (publicly), and 25 of 693 were highly similar to blood within the same subject (privately). Of the 137,416 blood B cell connections, 284 of 137,416 were shared publicly.

References

    1. Betts K. A.et al. ., The prevalence of hyperkalemia in the United States. Curr. Med. Res. Opin. 34, 971–978 (2018). - PubMed
    1. Kappos L.et al. ., Ocrelizumab in relapsing-remitting multiple sclerosis: A phase 2, randomised, placebo-controlled, multicentre trial. Lancet 378, 1779–1787 (2011). - PubMed
    1. Hauser S. L.et al. .; HERMES Trial Group , B-cell depletion with rituximab in relapsing-remitting multiple sclerosis. N. Engl. J. Med. 358, 676–688 (2008). - PubMed
    1. Hauser S. L.et al. .; OPERA I and OPERA II Clinical Investigators , Ocrelizumab versus interferon beta-1a in relapsing multiple sclerosis. N. Engl. J. Med. 376, 221–234 (2017). - PubMed
    1. Montalban X.et al. .; ORATORIO Clinical Investigators , Ocrelizumab versus placebo in primary progressive multiple sclerosis. N. Engl. J. Med. 376, 209–220 (2017). - PubMed

Publication types

LinkOut - more resources