. 2020 Aug 28;11(1):4269.
doi: 10.1038/s41467-020-18068-6.

Complete chemical structures of human mitochondrial tRNAs

Affiliations

Complete chemical structures of human mitochondrial tRNAs

Takeo Suzuki et al. Nat Commun. .

Abstract

Mitochondria generate most cellular energy via oxidative phosphorylation. Twenty-two species of mitochondrial (mt-)tRNAs encoded in mtDNA translate essential subunits of the respiratory chain complexes. mt-tRNAs contain post-transcriptional modifications introduced by nuclear-encoded tRNA-modifying enzymes. They are required for deciphering genetic code accurately, as well as stabilizing tRNA. Loss of tRNA modifications frequently results in severe pathological consequences. Here, we perform a comprehensive analysis of post-transcriptional modifications of all human mt-tRNAs, including 14 previously-uncharacterized species. In total, we find 18 kinds of RNA modifications at 137 positions (8.7% in 1575 nucleobases) in 22 species of human mt-tRNAs. An up-to-date list of 34 genes responsible for mt-tRNA modifications are provided. We identify two genes required for queuosine (Q) formation in mt-tRNAs. Our results provide insight into the molecular mechanisms underlying the decoding system and could help to elucidate the molecular pathogenesis of human mitochondrial diseases caused by aberrant tRNA modifications.


Conflict of interest statement

The authors declare no competing interests.

Figures

Fig. 1
Fig. 1. Isolation of human mitochondrial tRNAs.
Urea-denaturing gel electrophoresis of 22 species of human mt-tRNAs isolated from human placenta by chaplet column chromatography. The “crude” lane stands for placental total RNA. Each tRNA species is denoted by the single-letter abbreviation of the corresponding amino acid.
Fig. 2
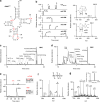
Fig. 2. Mass spectrometric analyses of human mt-tRNACys for assignment of post-transcriptional modifications.
a Secondary structure of mt-tRNACys with modifications. “p” and “OH” stand for 5′-monophosphate and 3′-hydroxy termini, respectively. Symbols for modified nucleosides are as follows: m1G 1-methylguanosine, Ψ pseudouridine, i6A N6-isopentenyladenosine, m1A 1-methyladenosine. Watson–Crick and G–U pairs are indicated by solid lines and asterisks, respectively. b HILIC-MS nucleoside analysis of mt-tRNACys. Left panels: UV chromatogram at 254 nm indicating four unmodified nucleosides (top panel), extracted-ion chromatograms (XIC) for the protonated ion of i6A (m/z 336) (second panel), m1G (m/z 298) (third panel), Ψ (m/z 245) (fourth panel), and m1A (m/z 282) (bottom panel). U and N6-methyladenosine (m6A) are also detected in the XIC of Ψ and m1A, respectively. Right panels: Mass spectra of i6A (upper panel) and m1G (lower panel). Dissociation of a base ion is indicated by a dotted line in each chemical structure. c, d RNA fragment analysis of mt-tRNACys digested by RNase T1 c and RNase A d. Assigned fragments (Supplementary Data 1) are indicated in the base peak chromatogram (BPC). p and >p represent the terminal phosphate and 2′,3′-cyclic phosphate, respectively. e XICs of A58-containing fragments of mt-tRNACys digested by RNase A with (upper panel) or without (lower panel) single methylation. The m1A-containing fragment is indicated. The asterisk shows a fragment containing m6A which is produced from m1A by the Dimroth reaction. The frequency of m1A is calculated from the summed peak intensities of the m1A- and m6A-containing fragments versus the non-methylated fragment. Sequence, m/z value, and charge state of each fragment are shown on the right. f Collision-induced dissociation (CID) spectrum of the RNase A-digested fragment of mt-tRNACys. The doubly charged negative ion of the RNA fragment (m/z 661.1) was used as the precursor for CID. g Whole-mass analysis of intact mt-tRNACys. A series of multiply charged negative ions with charge values are shown in the mass spectrum. The deconvoluted molecular mass is shown in the inset.
Fig. 3
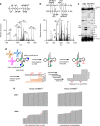
Fig. 3. Mapping Ψ sites in human mt-tRNAs.
a A CID spectrum of the RNase T1-digested fragment of human mt-tRNACys. The doubly charged negative ion of the cyanoethylated RNA fragment (m/z 1345.7) was used as the precursor for CID. Asterisks in the spectrum denote product ions containing ce1Ψ. b A CID spectrum of the cyanoethylated RNA fragment to determine the site for Ψs in human mt-tRNAPro. The triply charged negative ion of the mono-cyanoethylated RNA fragment (m/z1266.5) was used as the precursor for CID. Assignment of the product ions revealed the presence of two fragments containing ce1Ψ66 and ce1Ψ67. Asterisks in the spectrum denote product ions containing ce1Ψ. c CMC-PE analysis for detection of Ψ sites in human mt-tRNACys. HeLa total RNA treated with (+) or without (−) CMC was reverse-transcribed with a primer specific to human mt-tRNACys. The sequence ladders for U and A were generated under the same conditions in the presence of ddATP and ddTTP, respectively. The positions for Ψs and sequence are shown with the gel image. Source data are provided as a Source Data file. d Diagram of tRNA-Ψ-seq. Detailed procedure is described in the “Methods” section. e IGV snapshots of tRNA-Ψ-seq for human mt-tRNAGly and mt-tRNAVal. Histograms of mapped reads are shown for each tRNA when tRNA-Ψ-seq was performed in the absence (−) or presence (+) of CMC. The RT-stop signature for CMC-Ψ (indicated by red arrowheads) can be observed as a sudden drop in the number of piled reads.
Fig. 4
Fig. 4. Post-transcriptional modifications in 14 human mt-tRNAs.
a Secondary structure of 13 human mt-tRNAs with post-transcriptional modifications. Symbols for modified nucleosides are as follows: m2G N2-methylguanosine, m5C 5-methylcytidine, ms2i6A 2-methylthio-N6-isopentenyladenosine, D dihydrouridine, m5U 5-methyluridine. The A/U in mt-tRNAHis indicates that both A and U were detectable at this position as a result of heteroplasmy in the sample. b Secondary structure of human mt-tRNAPro, including unreported Ψ at positions 66 and 67.
Fig. 5
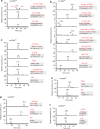
Fig. 5. Frequencies of mt-tRNA modifications.
Typical XICs of modified and unmodified RNA fragments of the indicated tRNAs digested by RNase T1 (ac, f) or RNase A (d, e). The frequency of each modification is calculated from peak intensity ratio of the modified and unmodified RNA fragments. Sequence, m/z value, and charge state of each fragment are shown on the right.
Fig. 6
Fig. 6. QTRT1 and QTRT2 are necessary for Q34 in mt-tRNAs.
a Gene structure of the human QTRT1 (upper) and QTRT2 (lower) with mutation sites introduced by the CRISPR/Cas9 system. The target sequence of the single-guide RNA (sgRNA) is underlined. The protospacer adjacent motif (PAM) sequence is boxed. Insertion and deletion are indicated by magenta letters and dashed lines, respectively. Electropherogram of Sanger sequence is shown in each KO cell. b XICs of Q nucleoside of human mt-tRNAs for Asp, His, Asn, and Tyr isolated from WT (top), QTRT1 KO (middle), and QTRT2 KO cells (bottom). c Boxplot of fold change in the ribosomal A-site codon occupancy of mitoribosome from QTRT2 KO versus WT HEK293T cells. Codon occupancy is calculated by average of biological replicates (n = 2). Each box shows the first quartile, median, and third quartile. The whiskers represent the 1.5× interquartile ranges. *P < 1.0 × 10−3 value was calculated by two-sided Wilcoxon rank-sum test. d Proteome stress of QTRT2 KO measured by the firefly luciferase (Fluc)-based thermal stability sensor fused with enhanced green fluorescent protein (EGFP). The Fluc sensor with no mutation (No mut.), single- (R188Q) or double-(R188Q/R261Q) mutation was introduced to QTRT2 KO or WT HEK293T cells. The aggregation rate was calculated by dividing the number of sensor protein aggregates by the area of EGFP fluorescence in each microscopic images. Horizontal lines in the scattered dot plot represent the first quartile, median, and third quartile from the bottom. P value were calculated by two-sided Wilcoxon rank-sum test. Source data are provided as a Source Data file.
Fig. 7
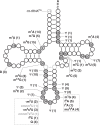
Fig. 7. Integrated view of post-transcriptional modifications in 22 human mt-tRNAs.
The positions of modifications are indicated by gray circles on the schematic cloverleaf structure of tRNA with position numbers. At each position, the symbol of each modification is shown with the number of tRNA species in parenthesis. The light gray circles and line represent a base pair between positions 27a and 43a, which are unique to mt-tRNASer(UCN). The “−1” for G−1 is specific to mt-tRNAHis. The symbol m2,2G represents N2, N2-dimethylguanosine.

References

    1. Wallace DC. A mitochondrial paradigm of metabolic and degenerative diseases, aging, and cancer: a dawn for evolutionary medicine. Annu. Rev. Genet. 2005;39:359–407. - PMC - PubMed
    1. Anderson S, et al. Sequence and organization of the human mitochondrial genome. Nature. 1981;290:457–465. - PubMed
    1. Hallberg BM, Larsson NG. Making proteins in the powerhouse. Cell Metab. 2014;20:226–240. - PubMed
    1. Amunts A, Brown A, Toots J, Scheres SHW, Ramakrishnan V. Ribosome. The structure of the human mitochondrial ribosome. Science. 2015;348:95–98. - PMC - PubMed
    1. Greber BJ, et al. Ribosome. The complete structure of the 55S mammalian mitochondrial ribosome. Science. 2015;348:303–308. - PubMed

Publication types

MeSH terms