. 2020 Aug 28;11(1):4337.
doi: 10.1038/s41467-020-18160-x.

Intracellular sodium elevation reprograms cardiac metabolism

Affiliations

Intracellular sodium elevation reprograms cardiac metabolism

Dunja Aksentijević et al. Nat Commun. .

Abstract

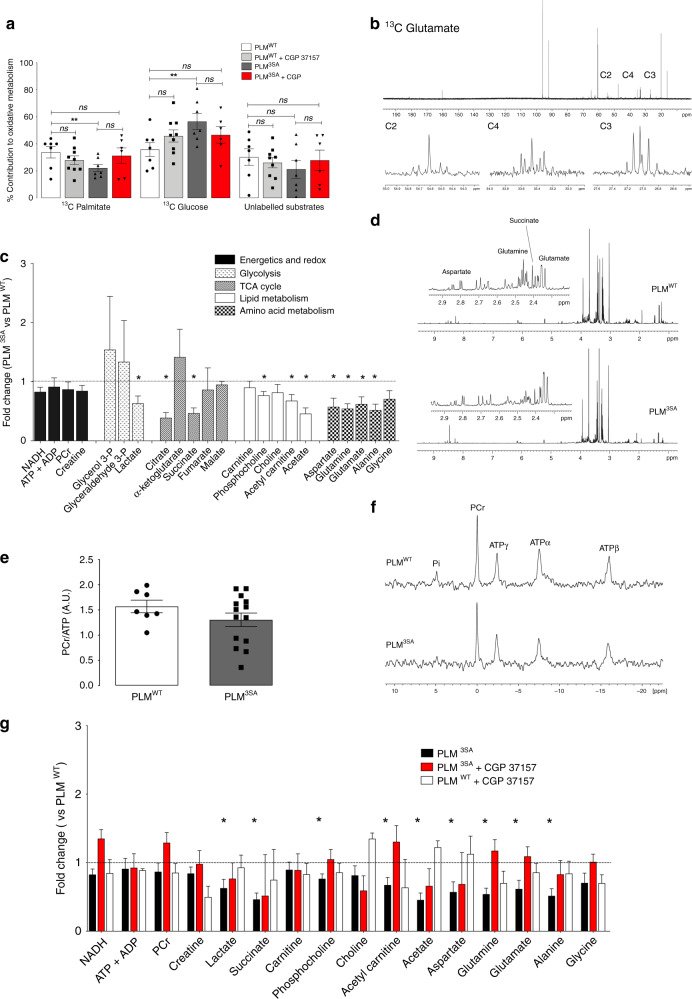
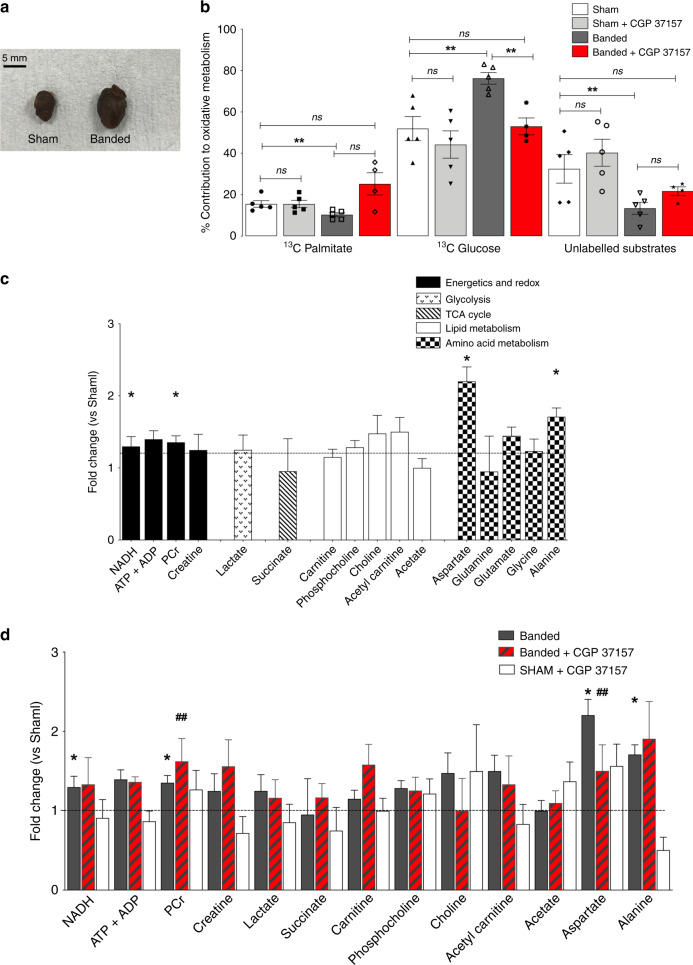
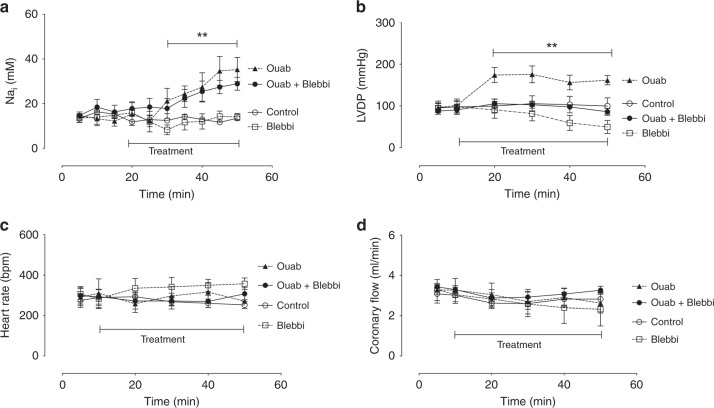
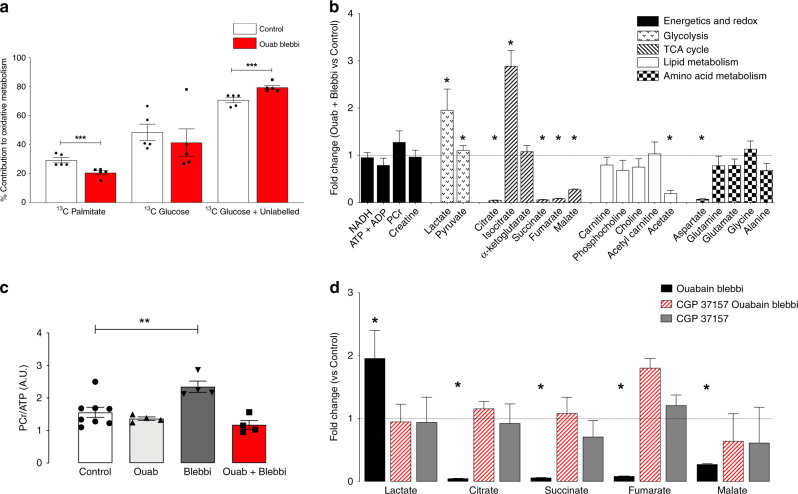
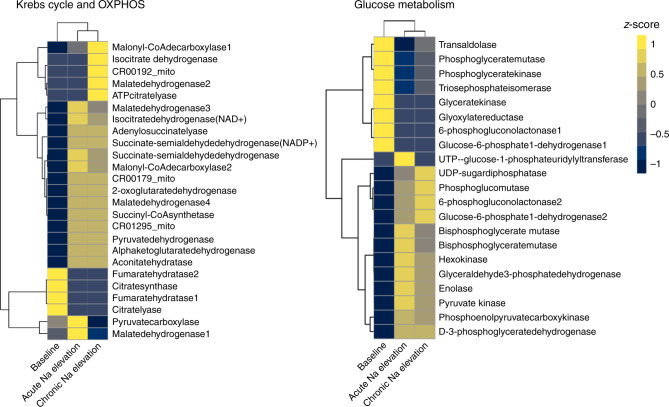
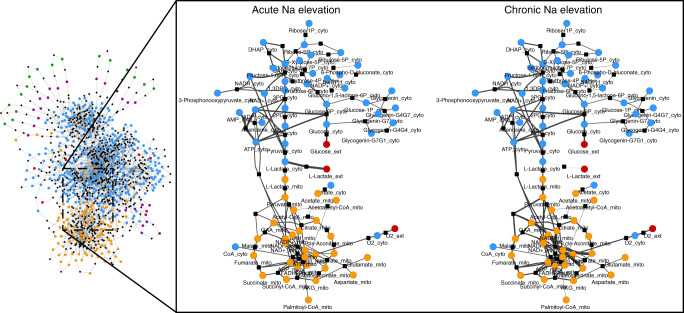
Intracellular Na elevation in the heart is a hallmark of pathologies where both acute and chronic metabolic remodelling occurs. Here, we assess whether acute (75 μM ouabain 100 nM blebbistatin) or chronic myocardial Nai load (PLM3SA mouse) are causally linked to metabolic remodelling and whether the failing heart shares a common Na-mediated metabolic 'fingerprint'. Control (PLMWT), transgenic (PLM3SA), ouabain-treated and hypertrophied Langendorff-perfused mouse hearts are studied by 23Na, 31P, 13C NMR followed by 1H-NMR metabolomic profiling. Elevated Nai leads to common adaptive metabolic alterations preceding energetic impairment: a switch from fatty acid to carbohydrate metabolism and changes in steady-state metabolite concentrations (glycolytic, anaplerotic, Krebs cycle intermediates). Inhibition of mitochondrial Na/Ca exchanger by CGP37157 ameliorates the metabolic changes. In silico modelling indicates altered metabolic fluxes (Krebs cycle, fatty acid, carbohydrate, amino acid metabolism). Prevention of Nai overload or inhibition of Na/Camito may be a new approach to ameliorate metabolic dysregulation in heart failure.


Conflict of interest statement

The authors declare no competing interests.

Figures

Fig. 1
Fig. 1. Metabolic profile of PLM3SA and PLMWT hearts.
a Myocardial 13C NMR assessment of oxidative metabolism—% contribution of 13C-U palmitate, 13C 1,6 glucose and the remnant unlabelled 13C substrate pool (triglycerides, glycogen, pyruvate, lactate, ketone bodies). 13C NMR assessment of oxidative metabolism after 30 min administration of CGP37157 in 13C-KHmetab buffer—PLM3SA (n = 6) vs PLMWT (n = 7) hearts. (*P < 0.03 PLM3SA palmitate oxidation vs PLMWT, P < 0.02 PLM3SA glucose oxidation vs PLMWT, t = 3.7 df = 8). b Representative 13C spectrum from perfused mouse heart: full 13C glutamate spectrum. Multiplet peak patterns of 13C glutamate C2, C4, C3 glutamate resonances. c Metabolomic profile—metabolite fold change normalized to control concentration (PLMWT levels = 1) with propagated errors (SEM). 1H NMR metabolomic analysis: NAD, ATP + ADP, PCr, creatine, carnitine, phosphocholine, choline, acetyl carnitine, acetate, aspartate, glutamine, glutamate, glycine, alanine. GS-MS/MS analysis: pyruvate, lactate, citrate, isocitrate, α-ketoglutarate, succinate, fumarate, malate (PLM3SA n = 5, PLMWT n = 8; lactate PLM3SA n = 12, PLMWT n = 10, succinate, glutamate PLM3SA n = 14 PLMWT n = 10, aspartate PLM3SA n = 13 PLMWT n = 10) (*P < 0.05 vs PLMWT, succinate, citrate, glutamine, alanine P < 0.005 vs PLMWT by t-test, two tailed, df = 10). d Representative 1H metabolomic NMR spectra. e Myocardial energetic reserve (PCr/ATP) ratio determined by 31P NMR spectroscopy (PLM3SA n = 14, PLMWT n = 7, P < 0.22, vs control by t-test, two tailed, t = 1.2, df = 19). f Representative 31P spectra of PLMWT and PLM3SA hearts. g Impact of 30 min perfusion with 1μM CGP37157 in KHmetab buffer on 1H NMR metabolomic profile of PLM3SA versus PLMWT hearts. Metabolite fold change vs control (control = 1) with propagated error of mean. (n = 8/group PLM3SA and PLMWT). **P < 0.05 vs PLMWT,succinate, citrate, glutamine, alanine P < 0.005 vs PLMWT by t-test, two tailed, df = 10. Data are mean ± SEM. Source data are provided as a Source Data file.
Fig. 2
Fig. 2. Metabolic profile of pressure-overload induced (banding) hypertrophy.
a representative Sham control and banded hypertrophy (dry hearts). b Myocardial 13C MRS assessment of oxidative metabolism—% contribution of 13C-U palmitate, 13C 1,6 glucose and the remnant unlabelled 12C substrate pool (triglycerides, glycogen, pyruvate, lactate, ketone bodies). Impact of the mitochondrial Na/Ca exchange inhibition with CGP37157 on metabolic fluxes: myocardial 13C NMR assessment of oxidative metabolism after 30 min administration of CGP37157 in 13C-KHmetab buffer—% contribution of 13C-U palmitate, 13C 1,6 glucose and the remnant unlabelled 12C substrate pool to oxidative phosphorylation Banded vs Sham hearts (n = 5/group). Banded vs Sham palmitate oxidation P < 0.05, glucose oxidation P < 0.005, unlabelled P < 0.03 by t-test (two-tailed); Banded + CGP37157 vs banded P < 0.05, by one-way ANOVA and Bonferroni multiple comparisons post-test. c 1H NMR metabolite profile - fold change normalized to control concentration (Sham levels = 1) with propagated error (SEM) (n = 6/group). *P < 0.05 vs control by t-test (two tailed, df = 9). d Impact of 30 min perfusion with 1 μM CGP37157 in KHmetab buffer on 1H NMR metabolomic profile of Banded (n = 4) versus Sham (n = 5) hearts. *P < 0.05 vs Sham, by t-test (two tailed) ♯♯P < 0.01 PCr vs. Sham + CGP37157, P < 0.01 Aspartate Banded CGP37157 vs Sham by one-way ANOVA and Bonferroni multiple comparisons post-test. Data are mean ± SEM. Source data are provided as a Source Data file.
Fig. 3
Fig. 3. Impact of acute 30 min Na/K ATPase inhibition on Nai and ex vivo function.
a Time course of Nai elevation measured by 23Na TQF filtered NMR. 40 min P < 0.01 vs baseline, 45 and 50 min P < 0.0001 vs baseline. b Impact on left ventricular developed pressure (LVDP) **P < 0.01 versus baseline. c Heart rate (HR) and d coronary flow. Data are presented as mean ± SEM. Ouab = 75 μmol/l ouabain (n = 8); Ouab + Blebbi = 75 μmol/l ouabain + 100 nmol/l blebbistatin (n = 11); Control = KH buffer + vehicle (DMSO) (n = 7); Blebbi = 100 nmol/l blebbistatin (n = 5). P value is for the effect of the drug treatment by two-way ANOVA. Source data are provided as a Source Data file.
Fig. 4
Fig. 4. Impact of acute 30 min Nai elevation on myocardial metabolism.
a Myocardial 13C NMR assessment of oxidative metabolism—% contribution of 13C-U palmitate, 13C 1,6 glucose and the remnant unlabelled 13C substrate pool (pyruvate, lactate, amino acids, triglycerides, glycogen). 13C glucose + unlabelled = 100%-13C palmitate oxidation) (n = 5/group) ***P < 0.005 vs control by unpaired t-test (two-tailed, t = 3.74 df = 8). b Metabolic profile plotted as metabolite fold change normalized to control concentration (control levels = 1) with propagated error (SEM). 1H NMR metabolite analysis: NAD, ATP + ADP, PCr, creatine, carnitine, phosphocholine, choline, acetyl carnitine, acetate, aspartate, glutamine, glutamate, glycine, alanine. GC and LC-MS/MS analysis: pyruvate, lactate, citrate, isocitrate, α ketoglutarate, succinate, fumarate, malate. C57/BL6 hearts perfused for 30 min with Control = Krebs Henseleit buffer + vehicle (DMSO); Ouab = 75 μmol/l ouabain; Blebbi = 100 nmol/l blebbistatin; Ouab + Blebbi = 75 μmol/l ouabain + 100 nmol/l ouabain. P < 0.005 vs control by unpaired t-test (two-tailed, df = 2.2). c Energetic reserve PCr/ATP (Control n = 8, n = 4/treatment group, *P < 0.001 vs control by one-way ANOVA F = 8.6). d Impact of the mitochondrial Na/Ca exchange inhibition with CGP37157 on GC-MS/MS metabolic profile. CGP37157 + Ouab + Blebbi = 1 μmol/l CGP37157 + 75 μmol/l ouabain + 100 nmol/l blebbistatin; CGP37157 = 1 μmol/l CGP37157; Control = KH buffer + vehicle (DMSO); Blebbi = 100 nmol/l blebbistatin (n = 5/group)*P < 0.05 lactate, P < 0.0002 citrate, succinate, fumarate, malate vs control by one-way ANOVA. Data are mean ± SEM (a, c) and fold change versus control (control = 1) with propagated error of mean (b, d). Comparisons by one-way ANOVA were subject to Bonferroni multiple comparisons post-test. Source data are provided as a Source Data file.
Fig. 5
Fig. 5. Metabolic adaptation in response to acute and chronic Na elevation.
Unsupervised hierarchical clustering of estimated z-scored flux rate changes reveals metabolic adaptation in response to [Na]i elevation. Heat maps summarize results for reactions in the Krebs cycle, OXPHOS, and glucose metabolism. Flux distributions were calculated by Flux balance analysis (FBA) using the mammalian network of cardiac metabolism, CardioNet. Z-scores were calculated to visualize how many standard deviations an estimated flux rate is away from the mean across all experimental groups. The z-score describes the distance from the mean for a given flux rate as a function of the standard deviation. For example, a z-score equal to 1 represents a flux for a given experimental group that is 1 standard deviation greater than the mean across all experimental groups. The colour scale indicates the degree to which estimated flux rate changes are predicted to be respectively lower or higher in response to Nai elevation. Source data are provided in Supplementary Data 1.
Fig. 6
Fig. 6. CardioNet in silico metabolic flux changes in response to acute and chronic Nai elevation.
Graph denotes estimated flux distribution in response to acute and chronic Nai elevation. The coloured nodes represent metabolites assigned to five different compartments: extracellular space, cytosol, mitochondria, microsome, lysosome. The black square nodes indicate reactions; two reactions are linked by a directed edge indicating the reaction flux. The line thickness of each edge is proportional to predicted flux rate change. Source data are provided as a Source Data file.

References

    1. Fuller W, et al. Regulation of the cardiac sodium pump. Cell. Mol. Life Sci. 2013;70:1357–1380. - PMC - PubMed
    1. Pavlovic D, Fuller W, Shattock MJ. Novel regulation of cardiac Na pump via phospholemman. J. Mol. Cell. Cardiol. 2013;61:83–93. - PubMed
    1. Aksentijevic, D., O’Brien, B. A., Eykyn, T. R. & Shattock, M. J. Is there a causal link between intracellular Na elevation and metabolic remodelling in cardiac hypertrophy? Biochem. Soc. Trans.10.1042/BST20170508 (2018). - PMC - PubMed
    1. Kohlhaas M, et al. Elevated cytosolic Na+ increases mitochondrial formation of reactive oxygen species in failing cardiac myocytes. Circulation. 2010;121:1606–1613. - PMC - PubMed
    1. Liu T, Brown DA, O’Rourke B. Role of mitochondrial dysfunction in cardiac glycoside toxicity. J. Mol. Cell. Cardiol. 2010;49:728–736. - PMC - PubMed

Publication types

MeSH terms

Substances