. 2020 Aug 28;11(1):4353.
doi: 10.1038/s41467-020-18239-5.

Incorporating hydrology into climate suitability models changes projections of malaria transmission in Africa

Affiliations

Incorporating hydrology into climate suitability models changes projections of malaria transmission in Africa

M W Smith et al. Nat Commun. .

Abstract

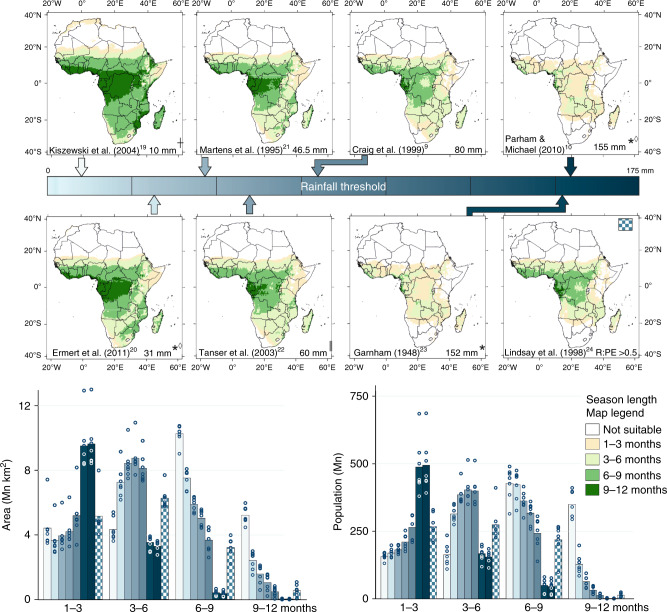
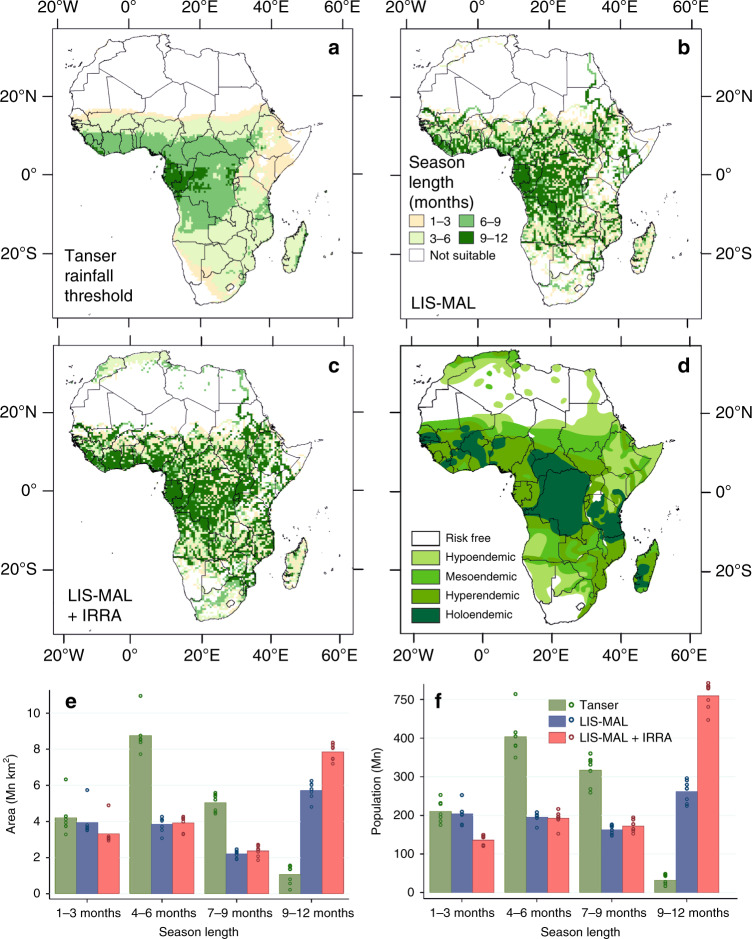
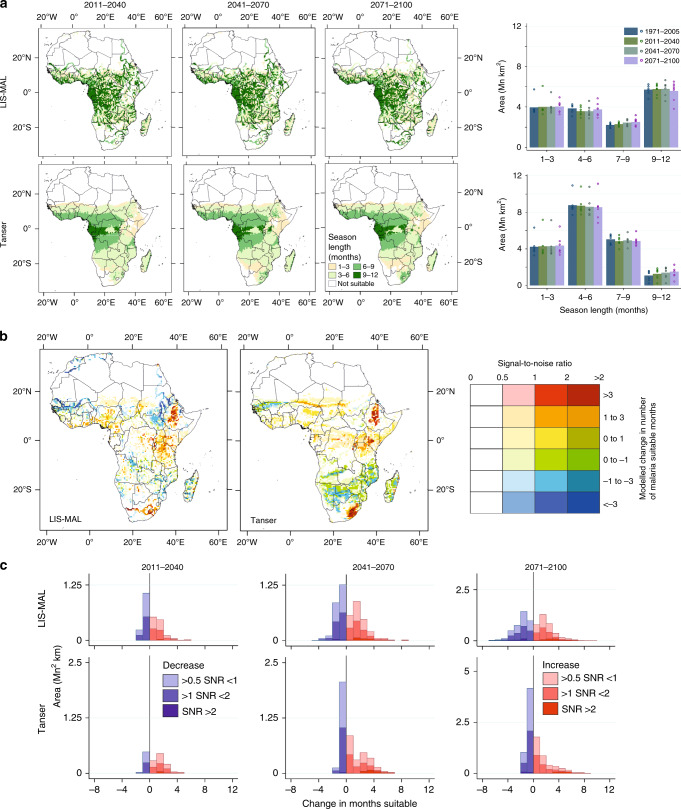
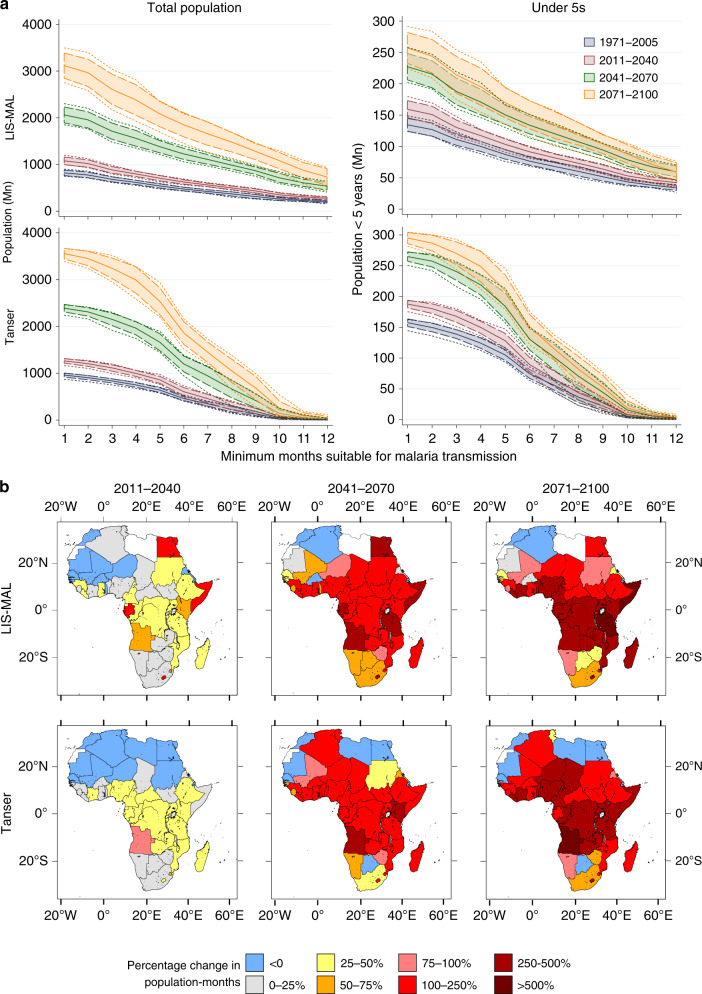
Continental-scale models of malaria climate suitability typically couple well-established temperature-response models with basic estimates of vector habitat availability using rainfall as a proxy. Here we show that across continental Africa, the estimated geographic range of climatic suitability for malaria transmission is more sensitive to the precipitation threshold than the thermal response curve applied. To address this problem we use downscaled daily climate predictions from seven GCMs to run a continental-scale hydrological model for a process-based representation of mosquito breeding habitat availability. A more complex pattern of malaria suitability emerges as water is routed through drainage networks and river corridors serve as year-round transmission foci. The estimated hydro-climatically suitable area for stable malaria transmission is smaller than previous models suggest and shows only a very small increase in state-of-the-art future climate scenarios. However, bigger geographical shifts are observed than with most rainfall threshold models and the pattern of that shift is very different when using a hydrological model to estimate surface water availability for vector breeding.


Conflict of interest statement

The authors declare no competing interests.

Figures

Fig. 1
Fig. 1. The effect of rainfall threshold on estimates of climatic suitability for malaria transmission.
The estimates from eight rainfall thresholds reported in the literature (see Supplementary Table 1 for further details) combined with the Mordecai et al.. thermal response curve for Africa over the period 1971–2005. Areas within 3-month bands are calculated for season length, with the coloured arrows locating each rainfall threshold on the linear scale bar providing a legend. Bars indicate mean of model estimates (n = 7); points indicate individual model estimates. *Originally calculated for daily (or dekadal) rainfall and scaled up for a monthly value; ││ includes a ‘catalyst month’ of 80 mm rainfall; ◊ also implements an upper rainfall threshold (Supplementary Table 1); only for ‘temporary’ water bodies that form the breeding habitat of the Anopheles gambiae s.l. complex.
Fig. 2
Fig. 2. Comparison of estimates of climatic suitability for malaria transmission in Africa.
Results from the LIS-MAL model over the period 1971–2005 are compared with those using a 60 mm month−1 rainfall threshold (with an 80 mm catalyst month). Thermal response in both is represented using the Mordecai et al.. curve for consistency. Mean values of climatic projections from each of seven downscaled general circulation models (detailed in Supplementary Table 2) for: a the Tanser rainfall threshold; b LIS-MAL; and c LIS-MAL with mapped irrigation compared with d the pre-intervention malaria map of Lysenko and Semashko. Comparison of estimated area (e) and population (f) in 3-month bands of (hydro-) climatic suitability for malaria transmission. Bars indicate mean of model estimates (n = 7); points indicate individual model estimates.
Fig. 3
Fig. 3. Future predictions of climatic suitability for malaria transmission.
a Mean model predictions for LIS-MAL and the Tanser rainfall threshold at each time step with a summary of areas in 3-month categories. Bars indicate mean of model estimates (n = 7); points indicate individual model estimates. b Mean changes in malaria hydro-climatic suitability predicted across forcing models by LIS-MAL and Tanser models between 1971–2005 and 2071–2100, where the signal-to-noise ratio >0.5. Different saturations indicate the signal-to-noise ratio across the seven projections, with the noise defined as the standard deviation of estimates across the projections. c Stacked histograms showing changes number of months climatically suitable up to 2071–2100 split into categories of signal-to-noise ratio from b. For changes between all periods and all hydrological models see Supplementary Figs. 6–8.
Fig. 4
Fig. 4. Future populations in areas climatically suitable for malaria transmission.
a Populations within areas climatically suitable for malaria transmission. Solid lines show the mean of the GCM forcing models, shaded areas indicate ±1 standard deviation and dashed lines show a range of predictions. Total population and under-5s calculated for both the Tanser rainfall threshold and LIS-MAL estimates using the WorldPop gridded distributions and UN medium variant projections for each period. b Predicted percentage changes in population-months (i.e. population exposed multiplied by the number of additional months of exposure) by country. White shading indicates no estimated malaria suitability.

Similar articles

Cited by

References

    1. World Health Organisation. World Malaria Report 2018 (World Health Organization, Geneva, 2018).
    1. Caminade C, et al. Impact of climate change on global malaria distribution. Proc. Natl Acad. Sci. 2014;111:3286–3291. - PMC - PubMed
    1. Shapiro LL, Whitehead SA, Thomas MB. Quantifying the effects of temperature on mosquito and parasite traits that determine the transmission potential of human malaria. PLoS Biol. 2017;15:2003489. - PMC - PubMed
    1. Jepson WF, Moutia A, Courtois C. The malaria problem in Mauritius: the binomics of Mauritian anophelines. Bull. Entomol. Res. 1947;38:177–208. - PubMed
    1. Waite JL, Suh E, Lynch PA, Thomas MB. Exploring the lower thermal limits for development of the human malaria parasite, Plasmodium falciparum. Biol. Lett. 2019;15:20190275. - PMC - PubMed

Publication types