Effective plans for hospital system response to earthquake emergencies
- PMID: 32859917
- PMCID: PMC7455727
- DOI: 10.1038/s41467-020-18072-w
Effective plans for hospital system response to earthquake emergencies
Abstract
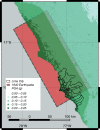
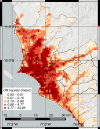
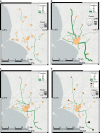
Hospital systems play a critical role in treating injuries during disaster emergency responses. Simultaneously, natural disasters hinder their ability to operate at full capacity. Thus, cities must develop strategies that enable hospitals' effective disaster operations. Here, we present a methodology to evaluate emergency response based on a model that assesses the loss of hospital functions and quantifies multiseverity injuries as a result of earthquake damage. The proposed methodology can design effective plans for patient transfers and allocation of ambulances and mobile operating rooms. This methodology is applied to Lima, Peru, subjected to a disaster scenario following a magnitude 8.0 earthquake. Our results show that the spatial distribution of healthcare demands mismatches the post-earthquake capacities of hospitals, leaving large zones on the periphery significantly underserved. This study demonstrates how plans that leverage hospital-system coordination can address this demand-capacity mismatch, reducing waiting times of critically injured patients by factors larger than two.
Conflict of interest statement
The authors declare no competing interests.
Figures


Similar articles
-
Estimation of the Demand for Hospital Care After a Possible High-Magnitude Earthquake in the City of Lima, Peru.Prehosp Disaster Med. 2017 Feb;32(1):106-111. doi: 10.1017/S1049023X16001254. Epub 2016 Dec 12. Prehosp Disaster Med. 2017. PMID: 27938450
-
Consideration of Medical and Public Health Coordination - Experience from the 2016 Kumamoto, Japan Earthquake.Prehosp Disaster Med. 2019 Apr;34(2):149-154. doi: 10.1017/S1049023X19000177. Epub 2019 Apr 14. Prehosp Disaster Med. 2019. PMID: 30981285
-
Impact of the 2007 Ica earthquake on health facilities and health service provision in southern Peru.Prehosp Disaster Med. 2009 Jul-Aug;24(4):326-32. doi: 10.1017/s1049023x00007056. Prehosp Disaster Med. 2009. PMID: 19806557
-
Challenges of providing of special care services in hospitals during emergencies and disasters: a scoping review.BMC Emerg Med. 2024 Dec 18;24(1):238. doi: 10.1186/s12873-024-01160-1. BMC Emerg Med. 2024. PMID: 39695959 Free PMC article.
-
Natural disasters and dialysis care in the Asia-Pacific.Nephrology (Carlton). 2015 Dec;20(12):873-80. doi: 10.1111/nep.12522. Nephrology (Carlton). 2015. PMID: 26032113 Review.
Cited by
-
CRUSH SYNDROME IN EARTHQUAKES - STAY AND PLAY OR LOAD AND GO?Acta Clin Croat. 2023 Jul;62(Suppl2):158-165. doi: 10.20471/acc.2023.62.s2.24. Acta Clin Croat. 2023. PMID: 38966034 Free PMC article. Review.
-
Pregnant women's migration patterns before childbirth after large-scale earthquakes and the added impact of concerns regarding radiation exposure in Fukushima and five prefectures.PLoS One. 2022 Aug 1;17(8):e0272285. doi: 10.1371/journal.pone.0272285. eCollection 2022. PLoS One. 2022. PMID: 35913902 Free PMC article.
-
Supply-demand mismatch causes substantial deterioration in prehospital emergency medical service under disasters.Commun Eng. 2025 Aug 7;4(1):145. doi: 10.1038/s44172-025-00481-8. Commun Eng. 2025. PMID: 40775464 Free PMC article.
-
Healthcare system resilience and adaptability to pandemic disruptions in the United States.Nat Med. 2024 Aug;30(8):2311-2319. doi: 10.1038/s41591-024-03103-6. Epub 2024 Jul 2. Nat Med. 2024. PMID: 38956198
-
Operational Health Pavilions in Mass Disasters: Lessons Learned from the 2023 Earthquake in Turkey and Syria.Healthcare (Basel). 2023 Jul 17;11(14):2052. doi: 10.3390/healthcare11142052. Healthcare (Basel). 2023. PMID: 37510493 Free PMC article.
References
-
- Centre for Research on the Epidemiology of Disasters. EM-DAT ∣ The international disasters database https://www.emdat.be/ (2019).
-
- Myrtle RC, Masri SF, Nigbor RL, Caffrey JP. Classification and prioritization of essential systems in hospitals under extreme events. Earthq. Spectra. 2005;21:779–802.
-
- American Red Cross MultiDisciplinary Team. Report on the 2010 Chilean Earthquake and Tsunami Response: U.S. Geological Survey. Open-File Report 2011-1053 v1.1. (Virginia, 2011). https://pubs.usgs.gov/of/2011/1053/.
-
- Parmar P, Arii M, Kayden S. Learning from japan: strengthening US emergency care and disaster response. Health Aff. 2013;32:2172–2178. - PubMed
-
- Schultz C, Koenig K, Lewis R. Decisionmaking in hospital earthquake evacuation: does distance from the epicenter matter? Ann. Emerg. Med. 2007;50:320–326. - PubMed
Publication types
MeSH terms
LinkOut - more resources
Full Text Sources
Medical

