. 2020 Aug 28;6(1):28.
doi: 10.1038/s41540-020-00145-7.

Mitigating the risk of cytokine release syndrome in a Phase I trial of CD20/CD3 bispecific antibody mosunetuzumab in NHL: impact of translational system modeling

Affiliations

Mitigating the risk of cytokine release syndrome in a Phase I trial of CD20/CD3 bispecific antibody mosunetuzumab in NHL: impact of translational system modeling

Iraj Hosseini et al. NPJ Syst Biol Appl. .

Abstract

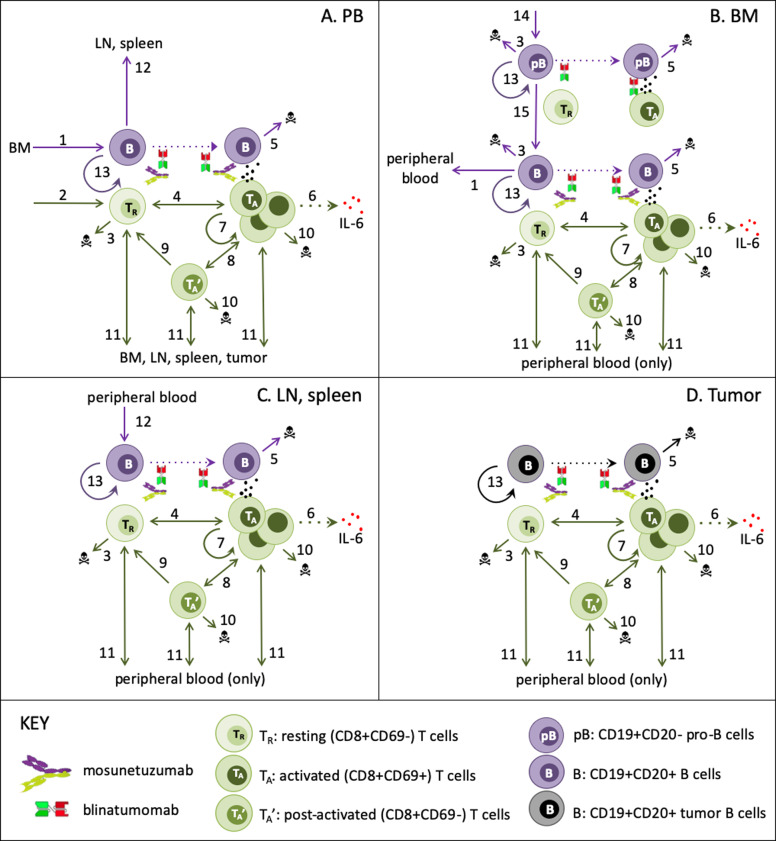
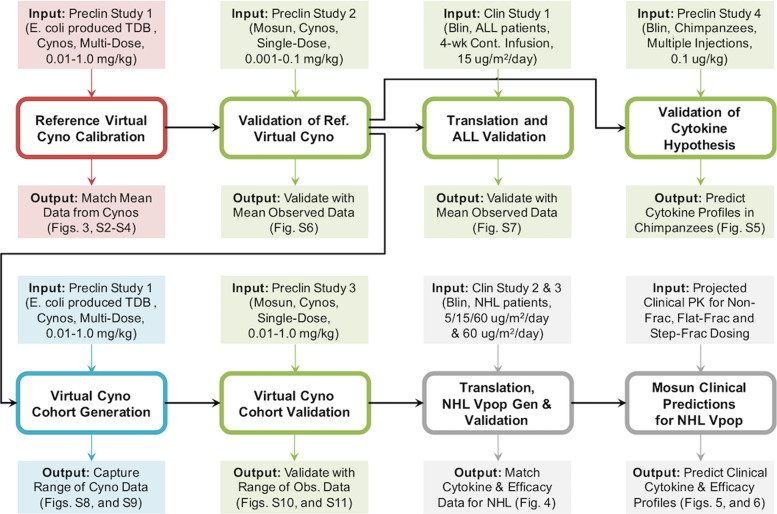
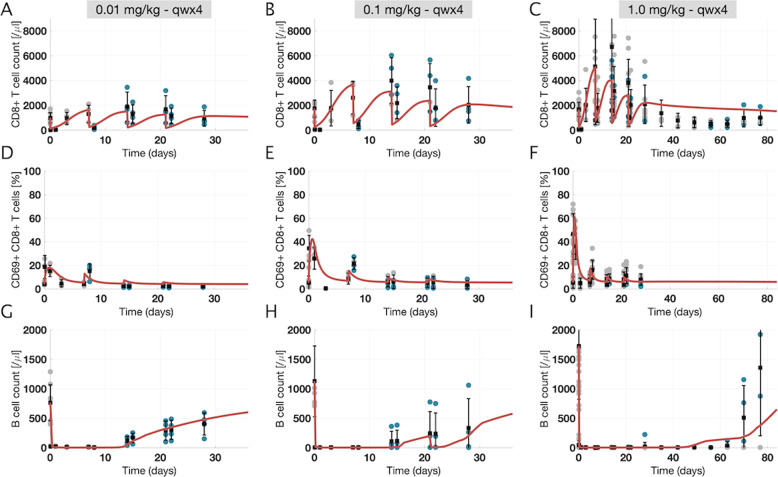
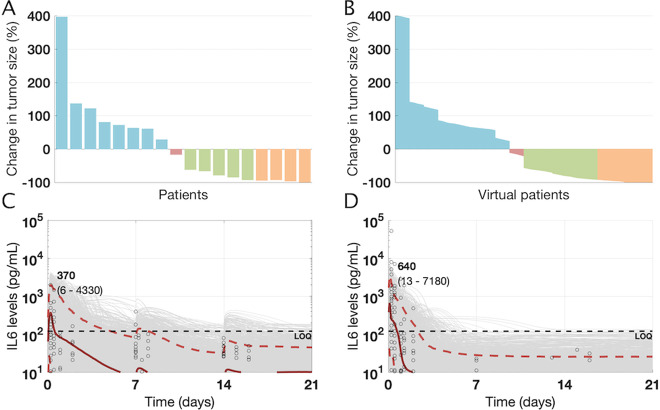
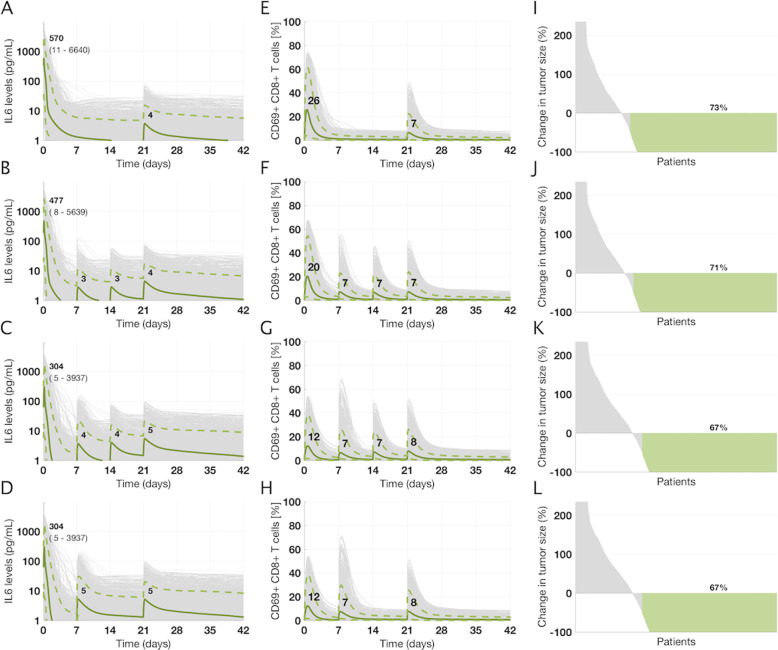
Mosunetuzumab, a T-cell dependent bispecific antibody that binds CD3 and CD20 to drive T-cell mediated B-cell killing, is currently being tested in non-Hodgkin lymphoma. However, potent immune stimulation with T-cell directed therapies poses the risk of cytokine release syndrome, potentially limiting dose and utility. To understand mechanisms behind safety and efficacy and explore safety mitigation strategies, we developed a novel mechanistic model of immune and antitumor responses to the T-cell bispecifics (mosunetuzumab and blinatumomab), including the dynamics of B- and T-lymphocytes in circulation, lymphoid tissues, and tumor. The model was developed and validated using mosunetuzumab nonclinical and blinatumomab clinical data. Simulations delineated mechanisms contributing to observed cell and cytokine (IL6) dynamics and predicted that initial step-fractionated dosing limits systemic T-cell activation and cytokine release without compromising tumor response. These results supported a change to a step-fractionated treatment schedule of mosunetuzumab in the ongoing Phase I clinical trial, enabling safer administration of higher doses.


Conflict of interest statement

I.H., K.G., E.S., C.-C.L., and S.R. are all employees of Genentech Inc.; L.L.S. was an employee of Genentech at the time the studies were conducted and is currently an employee at Harpoon Therapeutics. Y.-W.C. was an employee of Genentech at the time the studies were conducted and is currently an employee at Fate Therapeutics. Genentech has filed patent applications related to TDBs, and is currently conducting clinical studies of the molecule mosunetuzumab. Genentech holds no stake in the molecule blinatumomab, which is a clinically-approved molecule for the treatment of ALL. Investigators may request materials from Genentech by submitting a request form at www.gene.com/gene/reagents-program/request.do.

Figures

Fig. 1
Fig. 1. QSP model schematic of T-cell/B-cell bispecifics.
The QSP model describes the in vivo dynamics of B and T-cells and their interactions in the presence of mosunetuzumab and blinatumomab interactions in the following compartments: a peripheral blood PB, b bone marrow BM, c separate lymph node and spleen compartments, and d an optional NHL tumor compartment. The key biological interactions are labeled in the diagram as follows: (1) migration of newly generated B-cells from BM to PB, (2) Homeostatic thymic generation of new CD8+ T-cells (only when PB T-cells are diminished), (3) homeostatic apoptosis/loss of B-cells (only in BM) and T-cells (only when in excess), (4) T-cell activation due to interaction of bispecific drugs with B and T-cells; for mosunetuzumab, this requires CD20+ B-cells, (5) B-cell death due to T-cell cytolytic activity; for mosunetuzumab, this applies only to CD20+ B-cells, (6) activated T-cell induction of cytokine release, (7) activated T-cell proliferation, (8) interconversion of activated and post-activated T-cells, (9) conversion of post-activated to resting T-cells (e.g., memory cells), (10) activation-related apoptosis of activated and post-activated T-cells, (11) PB T-cell traffic to/from tissues, (12) PB B-cell traffic to replenish normal tissues (only when tissue B-cells are diminished), (13) proliferation of tumor B-cells (constitutive) and normal tissue B-cells (only when diminished), (14) Generation of pro-B-cells from stem cell precursors (15) maturation of CD20- pro-B-cells to CD20+ B-cells. Dotted lines represent mechanisms that do not alter cell states.
Fig. 2
Fig. 2. Workflow of mosunetuzumab QSP model development.
The QSP model was calibrated using multiple dose preclinical data of E. coli produced anti-CD20/CD3 TDB in cynomolgus monkeys (preclinical study 1, 0.01–1 mg/kg). The outcome was a reference virtual cyno, which reproduces the dynamics of cytokines, B and T-cells in the PB and lymphoid tissues. The model was then validated against data from the single-dose mosunetuzumab in cynomolgus monkeys (preclinical study 2, 0.001–0.1 mg/kg) by using the reference virtual cyno to predict the B and T-cell profiles. Next, the reference virtual cyno was translated to the human ALL patient using the appropriate physiological volume and T and B-cell numbers for different tissues and including blinatumomab PK and its downstream effects on T-cell activation and B-cell killing. The model was successfully validated against the clinical data from blinatumomab in ALL patients. In addition, we used reference virtual cyno and human models to validate the cytokine hypothesis by predicting the IL6 Levels measured in chimpanzees treated with multiple weekly injections of blinatumomab (preclinical study 4). To capture the observed variability in cyno measurements, we generated a virtual cohort of healthy cynos using the range of observed measurements in the multiple dose study of mosunetuzumab in cynomolgus monkeys (preclinical study 1) and validated against the single-dose mosunetuzumab in cynomolgus monkeys (Preclinical study 3, 0.01–1.0 mg/kg). We generated a virtual NHL population by translating the virtual cohort of healthy cynos, adding a tumor compartment by implementing a large B-cell dense mass using human physiology and including additional disease-related variability such as baseline peripheral B and T-cells, tumor load, tumor cell doubling time and revised B:T ratio in the tumor microenvironment. The virtual NHL population matched the distribution of antitumor efficacy and cytokine time profiles following blinatumomab treatment. This population was subsequently used to predict and compare the time course of systemic cytokine levels and antitumor efficacy for different dosing regimens of mosunetuzumab.
Fig. 3
Fig. 3. Time profile data and model fits for peripheral blood pharmacodynamic measurements in the multiple dose study of mosunetuzumab in cynomolgus monkeys (preclinical study 1).
The reference virtual cyno model replicates T and B-cell dynamics in the peripheral blood for different dose levels of mosunetuzumab in cynos. Each column shows a different dose level, ranging from 0.01 to 1 mg/kg given weekly for 4 weeks. Each row shows a measurement in PB (ac: CD8+ T-cells; df: percentage of activated T-cells (CD8+ CD69+ T-cells); and g–i: B-cells). Gray and blue dots show individual ADA− and ADA+ data points, respectively (n = 4 for 0.01 and 0.1 mg/kg; total n = 11 for 1 mg/kg with n = 4 after D29 in the recovery phase), and vertical black lines show mean ± standard deviation. Red curves are the model outputs calibrated to data (reference virtual cyno).
Fig. 4
Fig. 4. Clinical data and model outputs for antitumor efficacy and cytokine profiles in DLBCL/NHL patients following treatment with blinatumomab.
a Efficacy data for patients (n = 18) treated with continuous infusion of blinatumomab for 8 weeks using a step-up dosing regimen is shown. b The overall antitumor efficacy from virtual population of NHL patients (n = 4500 virtual patients) treated with Blinatumomab match the observed clinical data. c, d The cytokine (IL6) levels from are digitized and replotted for two cohorts of patients treated with either continuous infusion of blinatumomab using (c) a step-up dose with 5 μg/m2/day for the 1st week, 15 μg/m2/day for the 2nd week and 60 μg/m2/day for the 3rd week or (d) continuous infusion of blinatumomab at 60 μg/m2/day for 3 weeks. The cytokine characteristics of the virtual population of NHL patients was calibrated using the step-up dosing schedule and subsequently validated against the cytokine levels for blinatumomab treatment at 60 μg/m2/day. Black dots show digitized cytokine data (n = 21 for 5/15/60 μg/m2/day; n = 9 for 60 μg/m2/day), gray curves represent individual virtual patients and the red curves represent median, 5, and 95 percentiles for cytokine profiles across the virtual population, consistent with the median and range of measured cytokines. Numbers shown in bold indicate median IL6 peaks whereas numbers shown in parentheses indicate the 5–95 percentile range. Note that it was not technically feasible to digitally capture all the cytokine data/levels that were overlaid at the horizontal line corresponding to 10 pg/mL.
Fig. 5
Fig. 5. Projected time profiles of cytokines, activated T-cells, and antitumor efficacy in NHL patients treated with different dosing regimens of mosunetuzumab.
The NHL virtual population was used to predict and compare IL6 levels, fraction of activated T-cells and efficacy profiles for different dosing regimens (a, e, and i: 20 mg on Cycle 1 Day 1 (C1D1); b, f, and j: 6.7 mg on C1D1, C1D8, C1D15; c, g, and k: 1.6/10/10 mg on C1D1, C1D8, and C1D15; d, h, and l: 1.6/20 mg on C1D1, and C1D8; in all regimens 20 mg is administered on Day 1 of subsequent cycles). Gray curves represent individual virtual patients and green curves represent median, 5, and 95 percentiles for cytokine and activated T-cell profiles across the virtual population. Numbers shown in bold indicate median IL6 peaks whereas numbers shown in parentheses indicate the 5–95 percentile range. In the third column, the numbers indicate percentage of virtual patients with more than 50% reduction in tumor size on Day 84 and are only used for comparison purposes across dosing regimens.
Fig. 6
Fig. 6. Projected range of first IL6 peaks post mosunetuzumab treatment in NHL patients and comparison with clinical data.
The NHL virtual population was used to project range of clinical IL6 peaks after the first dose of Cycle 1 for a range of clinically tested doses of mosunetuzumab (0.05–2.8 mg). The gray shaded region represents the range of simulated IL6 peak after the first dose of mosunetuzumab was administered. The black dots represent the first IL6 peak in mosunetuzumab Phase 1 clinical data (n = 1, 2, 8, 47, 17, 6, 5, 3, 8 for 0.05, 0.2, 0.4, 0.8, 1, 1.2, 1.6, 2, 2.8 mg, respectively).

Similar articles

Cited by

References

    1. Coiffier B, et al. CHOP chemotherapy plus rituximab compared with CHOP alone in elderly patients with diffuse large-B-cell lymphoma. N. Engl. J. Med. 2002;346:235–242. doi: 10.1056/NEJMoa011795. - DOI - PubMed
    1. Feugier P, et al. Long-term results of the R-CHOP study in the treatment of elderly patients with diffuse large B-cell lymphoma: a study by the Groupe d’Etude des Lymphomes de l’Adulte. J. Clin. Oncol. 2005;23:4117–4126. doi: 10.1200/JCO.2005.09.131. - DOI - PubMed
    1. Hiddemann W, et al. Frontline therapy with rituximab added to the combination of cyclophosphamide, doxorubicin, vincristine, and prednisone (CHOP) significantly improves the outcome for patients with advanced-stage follicular lymphoma compared with therapy with CHOP alone: results of a prospective randomized study of the German Low-Grade Lymphoma Study Group. Blood. 2005;106:3725–3732. doi: 10.1182/blood-2005-01-0016. - DOI - PubMed
    1. Vidal, L. et al. Bendamustine for patients with indolent B cell lymphoid malignancies including chronic lymphocytic leukaemia. Cochrane Database of Syst. Rev. 9 (2012). - PMC - PubMed
    1. Jemal A, et al. Global cancer statistics. CA Cancer J. Clin. 2011;61:69–90. doi: 10.3322/caac.20107. - DOI - PubMed

Publication types

MeSH terms