. 2020 Aug 28;3(1):476.
doi: 10.1038/s42003-020-01201-y.

Loss of β-cell identity and diabetic phenotype in mice caused by disruption of CNOT3-dependent mRNA deadenylation

Affiliations

Loss of β-cell identity and diabetic phenotype in mice caused by disruption of CNOT3-dependent mRNA deadenylation

Dina Mostafa et al. Commun Biol. .

Abstract

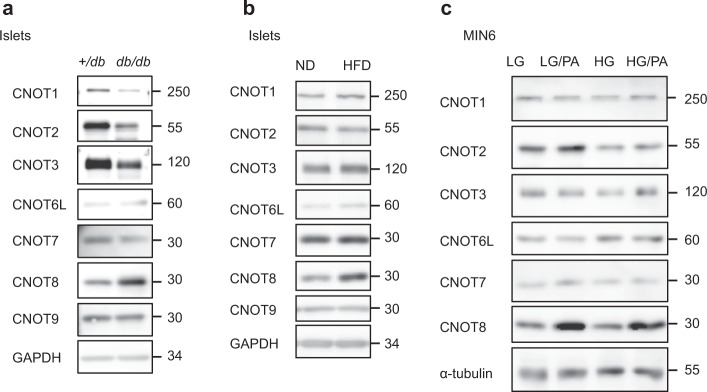
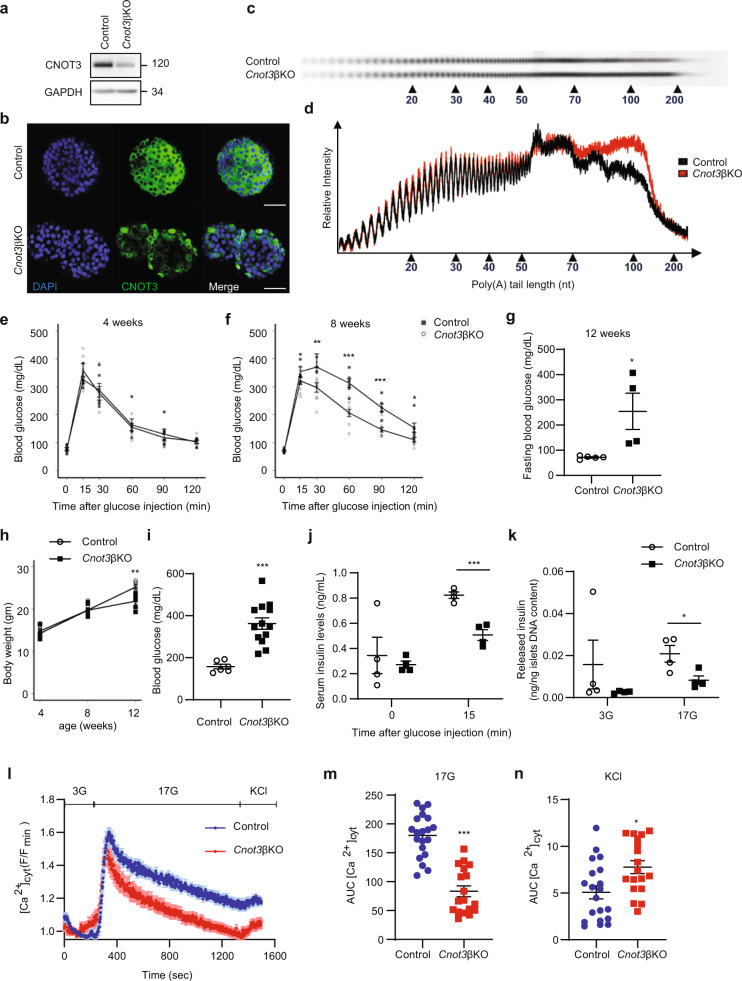
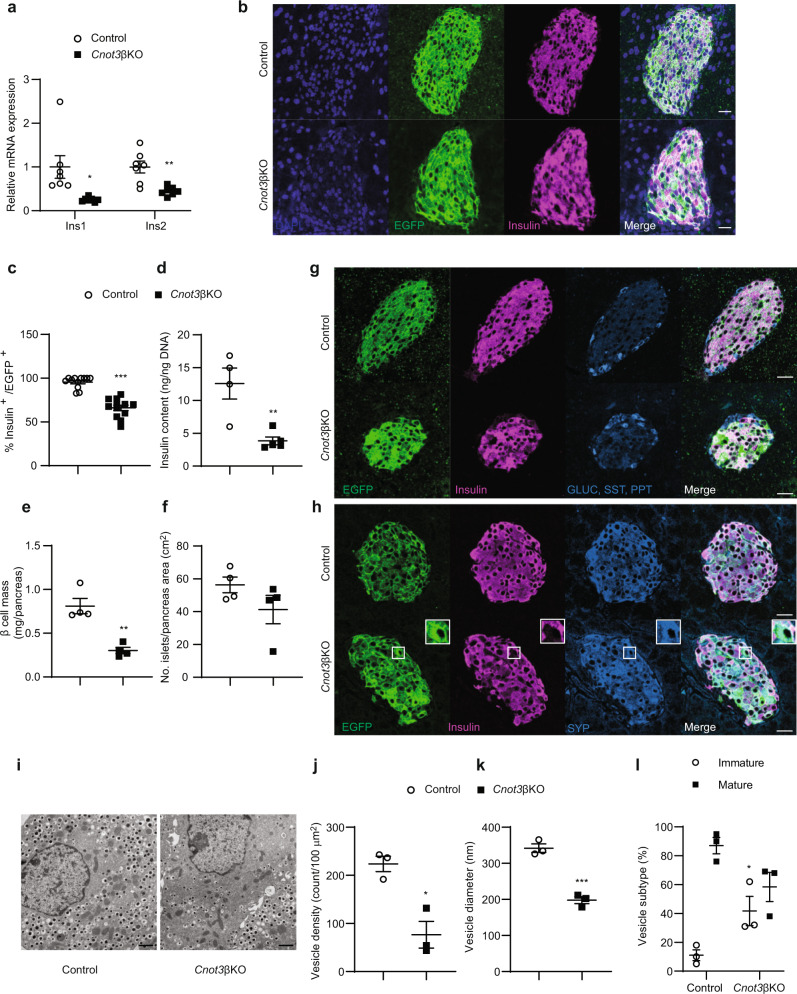
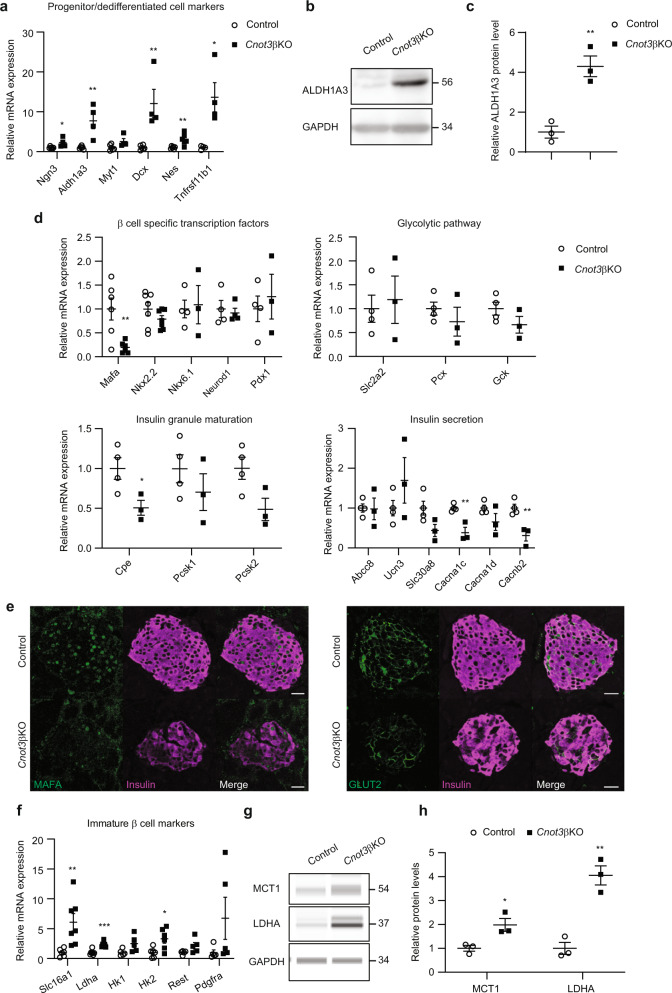
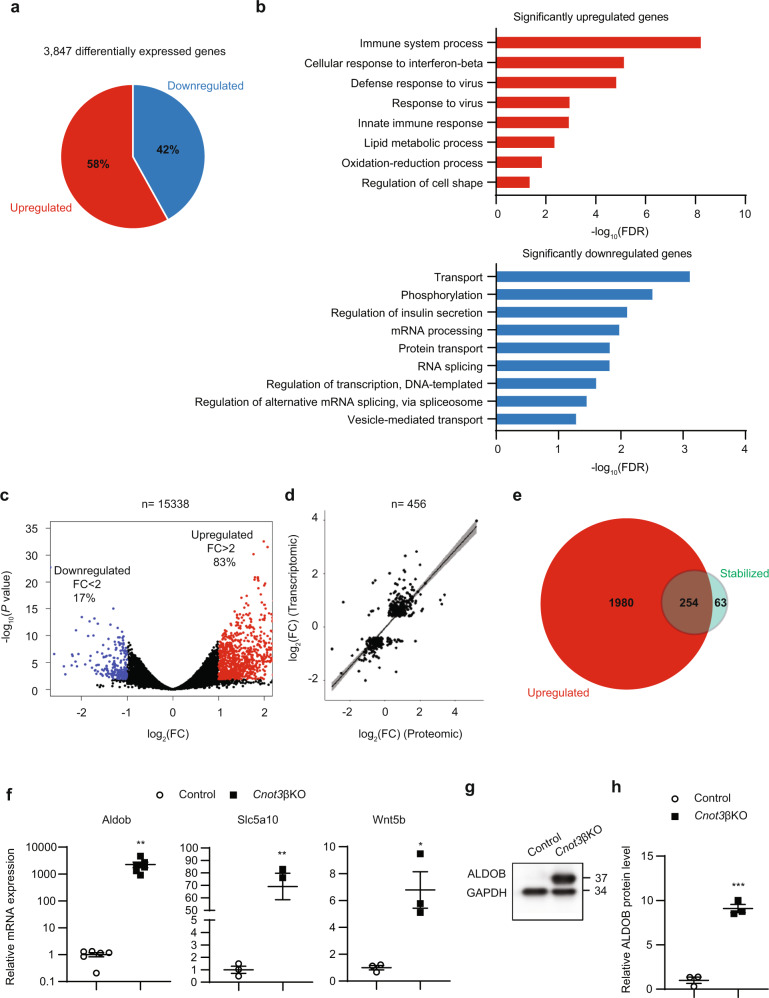
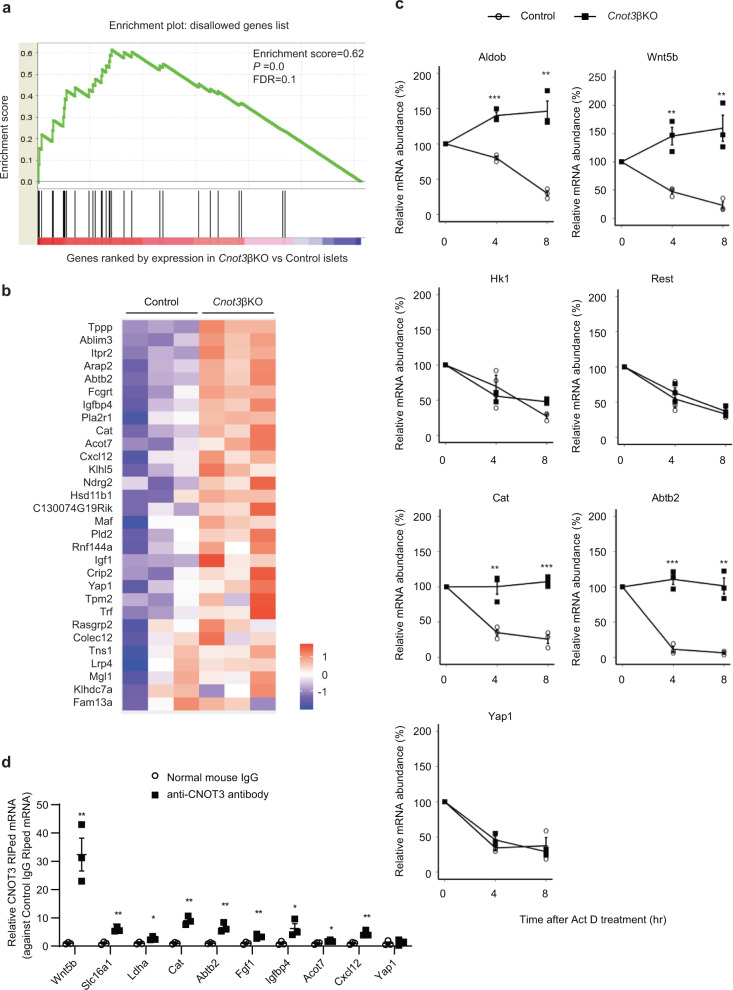
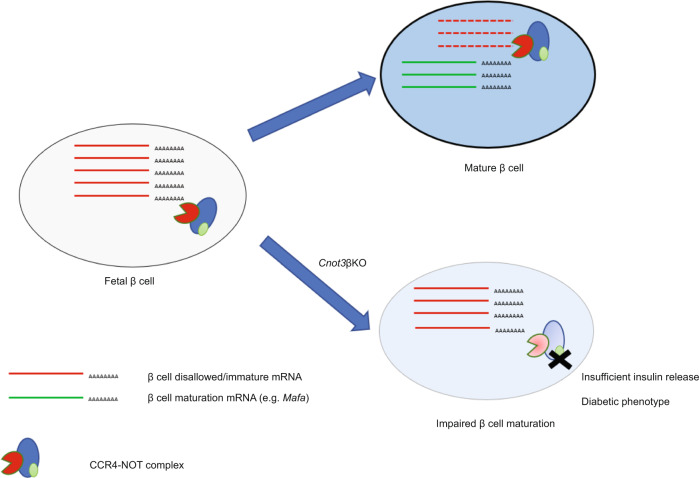
Pancreatic β-cells are responsible for production and secretion of insulin in response to increasing blood glucose levels. Defects in β-cell function lead to hyperglycemia and diabetes mellitus. Here, we show that CNOT3, a CCR4-NOT deadenylase complex subunit, is dysregulated in islets in diabetic db/db mice, and that it is essential for murine β cell maturation and identity. Mice with β cell-specific Cnot3 deletion (Cnot3βKO) exhibit impaired glucose tolerance, decreased β cell mass, and they gradually develop diabetes. Cnot3βKO islets display decreased expression of key regulators of β cell maturation and function. Moreover, they show an increase of progenitor cell markers, β cell-disallowed genes, and genes relevant to altered β cell function. Cnot3βKO islets exhibit altered deadenylation and increased mRNA stability, partly accounting for the increased expression of those genes. Together, these data reveal that CNOT3-mediated mRNA deadenylation and decay constitute previously unsuspected post-transcriptional mechanisms essential for β cell identity.


Conflict of interest statement

The authors declare no competing interests.

Figures

Fig. 1
Fig. 1. CCR4–NOT complex subunits are deregulated in mouse models of diabetes and obesity.
ac Immunoblot analysis of CCR4–NOT complex subunits in: a islet lysates from 16-week-old +/db control and db/db mice. b islet lysates from 20-week-old mice fed a normal diet (ND) or a high-fat diet (HFD) for 12 weeks. c MIN6 cells under low/high-glucose conditions (LG/HG) with or without palmitic acid (PA) treatment. Each blot is a representative of three different blots.
Fig. 2
Fig. 2. The loss of CNOT3 in β cells impairs glucose tolerance and causes diabetes.
a Immunoblot analysis of CNOT3 in islet lysates from 8-week-old control and Cnot3βKO mice. This blot is a representative of three different blots. b Immunofluorescence of CNOT3 (green) in islets from 8-week-old control and Cnot3βKO mice. Nuclei were stained with DAPI (blue). A scale bar represents 50 µm. c Poly(A) tail lengths of global mRNAs by bulk poly (A) assay in control and Cnot3βKO islets (n = 1, each sample was pooled from four mice). d Densitograms of poly(A) tail lengths shown in (c). Intraperitoneal glucose tolerance tests in: e 4- and f 8-week-old control and Cnot3βKO mice (n = 6–9). g Fasting blood glucose in 12-week-old control (n = 5) and Cnot3βKO mice (n = 4). h Body weight comparisons between control and Cnot3βKO mice at 4, 8 and 12 weeks of age (n = 6). i Blood glucose in 8-week-old control (n = 6) and Cnot3βKO (n = 13) mice fed with ND. j Serum insulin in 8-week-old control and Cnot3βKO mice after 16 h fasting (0 min) and 15 min after glucose injection (2 g/kg body weight) (n = 4). k Insulin released by islets from 8-week-old control and Cnot3βKO mice in response to low 3 mM glucose (3G) and high 17 mM glucose (17G) stimulation for 1 h. This experiment is a representative of three independent experiments using three different biological replicates (n = 3). Data are presented as mean ± SEM; *P < 0.05; **P < 0.01; ***P < 0.001, two-tailed Student’s t test. l Cytosolic Ca2+ ([Ca2+] cyt) responses in control (n = 20) and Cnot3βKO (n = 18) islets from three 8-week-old mice from each genotype in response to low (3G), high (17G) glucose or 20 mM KCl. m AUC of glucose-evoked Ca2+ traces. AUC was calculated using different baseline values for each group (0.95 for control and 1.03 for Cnot3βKO). n AUC of depolarizing stimulus, KCl, response. AUC was calculated using different baseline values for each group (1.15 for control and 0.95 for Cnot3βKO). Data are presented as mean ± SEM; *P < 0.05; **P < 0.01; ***P < 0.001, Mann–Whitney test.
Fig. 3
Fig. 3. The lack of CNOT3 in β cells reduces insulin expression.
a qPCR analysis of insulin mRNA isoforms (Ins1 and Ins2), normalized to the Gapdh mRNA level, in control and Cnot3βKO islets (n = 7). b Co-immunofluorescence staining of EGFP (green), insulin (magenta) and DAPI (blue) in pancreatic sections from 8-week-old control and Cnot3βKO mice. A scale bar represents 25 µm. Representative results from three 8-week-old mice from each genotype are shown. c Quantification data of immunofluorescence analysis presented in Fig. 3b. Each data point represents %EGFP+ in Insulin+ β cells in control and Cnot3βKO islets (n = 12) from three 8-week-old mice from each genotype. d Insulin content of islets from 8-week-old control (n = 4) and Cnot3βKO (n = 5) mice. e β-cell mass measurement in pancreatic sections from 8-week-old control and Cnot3βKO mice (n = 4). f Islet number per pancreas area in pancreatic sections from 8-week-old control and Cnot3βKO mice (n = 4). g Co-immunofluorescence staining of EGFP (green), insulin (magenta), GLUC (blue), SST (blue) and PPT (blue) in pancreatic sections from 8-week-old mTmG reporter: “control (Cnot3+,+; +/Ins1-Cre) and Cnot3βKO” mice. A scale bar represents 25 µm. h Co-immunofluorescence staining of EGFP (green), insulin (magenta) and SYP (blue) in pancreatic sections from 8-week-old mTmG reporter: “control (Cnot3+,+; +/Ins1-Cre) and Cnot3βKO” mice. A scale bar represents 25 µm. Representative results from three 8-week-old mice from each genotype are shown. il Transmission electron microscopy performed on islets isolated from 8-week-old control and Cnot3βKO mice (n = 3), including quantification of j vesicle density, k vesicle diameter and l the percentage of mature (black bar) and immature vesicles (white bar). A scale bar represents 1 µm. Data are presented as mean ± SEM; *P < 0.05; **P < 0.01; ***P < 0.001, two-tailed Student’s t test.
Fig. 4
Fig. 4. CNOT3 is essential for β-cell maturation and identity.
a qPCR analysis of progenitor cells/dedifferentiation markers, normalized to the Gapdh mRNA level, in control and Cnot3βKO islets (n = 4–6). b Immunoblot analysis of ALDH1A3 in islet lysates from 8-week-old control and Cnot3βKO mice. This blot is a representative of three different blots. c Band quantification of an immunoblot of ALDH1A3 (n = 3) in Fig. 4b. d qPCR analysis of β-cell-specific functional mRNAs expression categorized as β-cell-specific transcription factors, glycolytic pathway, insulin granule maturation, and insulin secretion mRNAs, normalized to the Gapdh mRNA level, in control and Cnot3βKO islets (n = 3–7). e Co-immunofluorescence staining of MAFA (green), GLUT2 (green), and insulin (magenta) in pancreatic sections from 8-week-old control and Cnot3βKO mice. A scale bar represents 25 µm. Representative results from four 8-week-old mice from each genotype are shown. f qPCR analysis of immature β-cell markers, normalized to the Gapdh mRNA level, in control and Cnot3βKO islets (n = 5–7). g Immunoblot analysis of MCT1 and LDHA in islet lysates from 8-week-old control and Cnot3βKO mice. This blot is a representative of three different blots. h Band quantification of immunoblot of MCT1 and LDHA (n = 3). Data are presented as mean ± SEM; *P < 0.05; **P < 0.01; ***P < 0.001, two-tailed Student’s t test.
Fig. 5
Fig. 5. Global gene expression changes in Cnot3βKO islets.
a 3847 genes were differentially expressed (DE) in islets following CNOT3 depletion in β cells. The graph indicates the percentage distribution of genes differentially expressed (P < 0.05) in Cnot3βKO compared with control islets (n = 3, each sample was pooled from two mice). Multidimensional scaling (MDS) plot is presented in Supplementary Fig. 10. b GO analysis of mRNAs significantly upregulated (red) and downregulated (blue) in Cnot3βKO islets. Bar charts of GO terms (Biological Process) ranked by FDR (<0.05) are shown. Gene lists included in each GO term are summarized in Supplementary Data 1. c Volcano plot of DE genes indicating the percentage distribution of DE (P < 0.05) genes by more than twofold upregulation (red) or downregulation (blue). d Pearson correlation analysis between differentially expressed genes and proteins identified by RNA-seq analysis and MS analysis of control and Cnot3βKO islets. e Venn diagram showing the overlap of significantly upregulated (red) and stabilized (green) mRNAs in Cnot3βKO compared with control islets. f qPCR analysis of three top upregulated and stabilized mRNAs (Aldob, Slc5a10 and Wnt5b), normalized to the Gapdh mRNA level, in control and Cnot3βKO islets (n = 3–6). g Immunoblot analysis of ALDOB in islet lysates from 8-week-old control and Cnot3βKO mice (n = 3). This blot is a representative of three different blots. h Band quantification of immunoblot of ALDOB (n = 3). Data are presented as mean ± SEM; *P < 0.05; **P < 0.01; ***P < 0.001, two-tailed Student’s t test.
Fig. 6
Fig. 6. Derepression of β cell-disallowed genes and their mRNA stabilization in Cnot3βKO islets.
a GSEA of β-cell-disallowed genes, identified in Pullen et al., in Cnot3βKO islets. b Heatmap of 30 disallowed genes showing mRNA expression obtained from RNA-seq analysis of control and Cnot3βKO islets. c Decay curves of the indicated mRNAs. Total RNA was prepared from control and Cnot3βKO islets treated with Act D for 0, 4, or 8 h. Relative mRNA levels were determined by qPCR and normalized to the Gapdh mRNA level. mRNA levels without Act D treatment (0 h) were set to 100% (n = 3). d RIP-qPCR in MIN6 cells using normal anti-mouse and anti-CNOT3 antibodies revealing the interaction of CNOT3 with the indicated mRNAs that adversely affect β cell function (n = 3). Data are presented as mean ± SEM; *P < 0.05; **P < 0.01; ***P < 0.001, two-tailed Student’s t test.
Fig. 7
Fig. 7. A schematic model of role of CCR4–NOT complex-mediated deadenylation in β-cell maturation.
CNOT3, one key subunit of the CCR4–NOT complex, is required for proper function of the CCR4–NOT complex. CNOT3 (Green oval) regulates expression of some β-cell-disallowed/immature genes, possibly through CCR4–NOT complex-mediated mRNA decay. Therefore, Cnot3 KO in β cells impairs β-cell maturation due to failure to repress β-cell-disallowed/immature genes.

Similar articles

Cited by

References

    1. Ashcroft FrancesM, Rorsman P. Diabetes mellitus and the β cell: the last ten years. Cell. 2012;148:1160–1171. - PMC - PubMed
    1. Talchai C, et al. Pancreatic β cell dedifferentiation as a mechanism of diabetic β cell failure. Cell. 2012;150:1223–1234. - PMC - PubMed
    1. Rutter GuyA, Pullen TimothyJ, Hodson DavidJ, Martinez-Sanchez A. Pancreatic β-cell identity, glucose sensing and the control of insulin secretion. Biochem. J. 2015;466:203–218. - PubMed
    1. Wicksteed B, Alarcon C, Briaud I, Lingohr MK, Rhodes CJ. Glucose-induced translational control of proinsulin biosynthesis is proportional to preproinsulin mRNA levels in islet beta-cells but not regulated via a positive feedback of secreted insulin. J. Biol. Chem. 2003;278:42080–42090. - PubMed
    1. Guay C, et al. Emerging roles of non-coding RNAs in pancreatic β-cell function and dysfunction. Diabetes Obes. Metab. 2012;14:12–21. - PubMed

Publication types

MeSH terms