. 2021 Mar;31(3):345-361.
doi: 10.1038/s41422-020-00397-2. Epub 2020 Aug 28.

Oncogenic AURKA-enhanced N6-methyladenosine modification increases DROSHA mRNA stability to transactivate STC1 in breast cancer stem-like cells

Affiliations

Oncogenic AURKA-enhanced N6-methyladenosine modification increases DROSHA mRNA stability to transactivate STC1 in breast cancer stem-like cells

Fei Peng et al. Cell Res. 2021 Mar.

Abstract

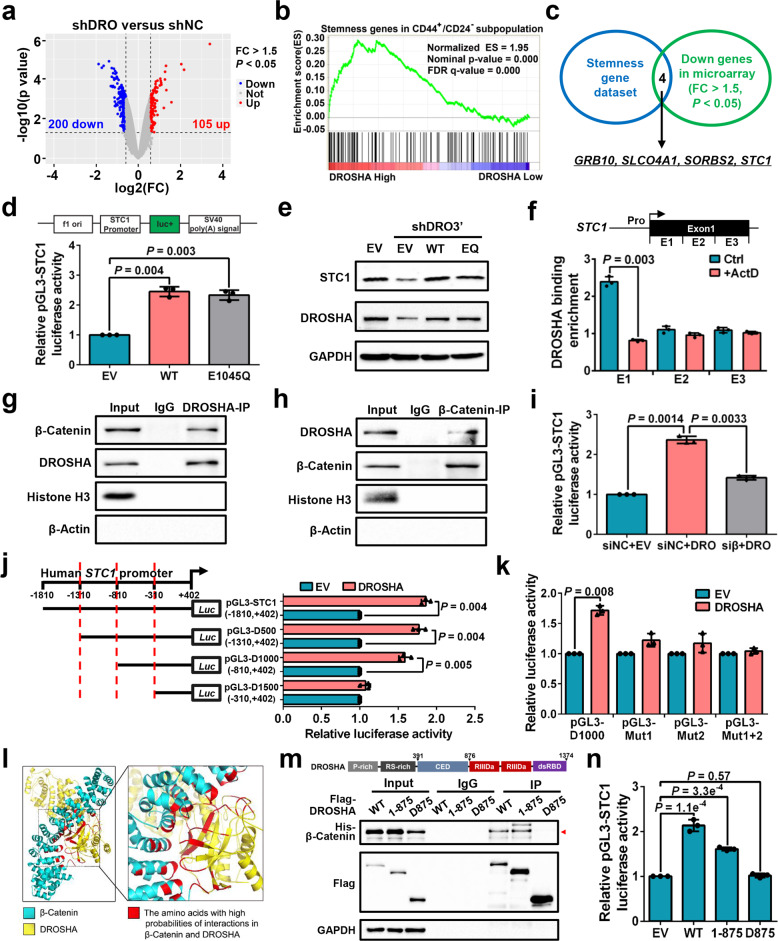
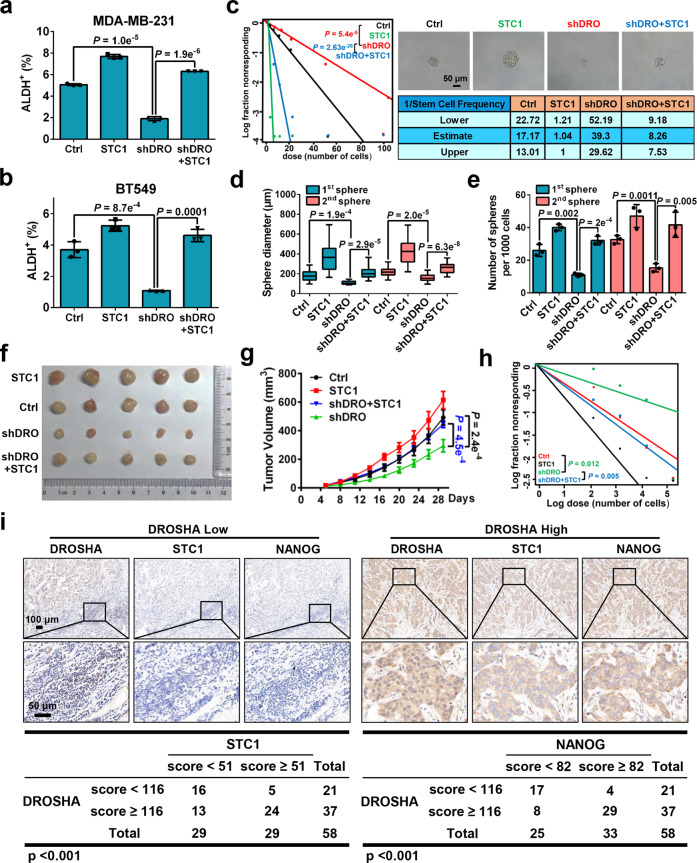
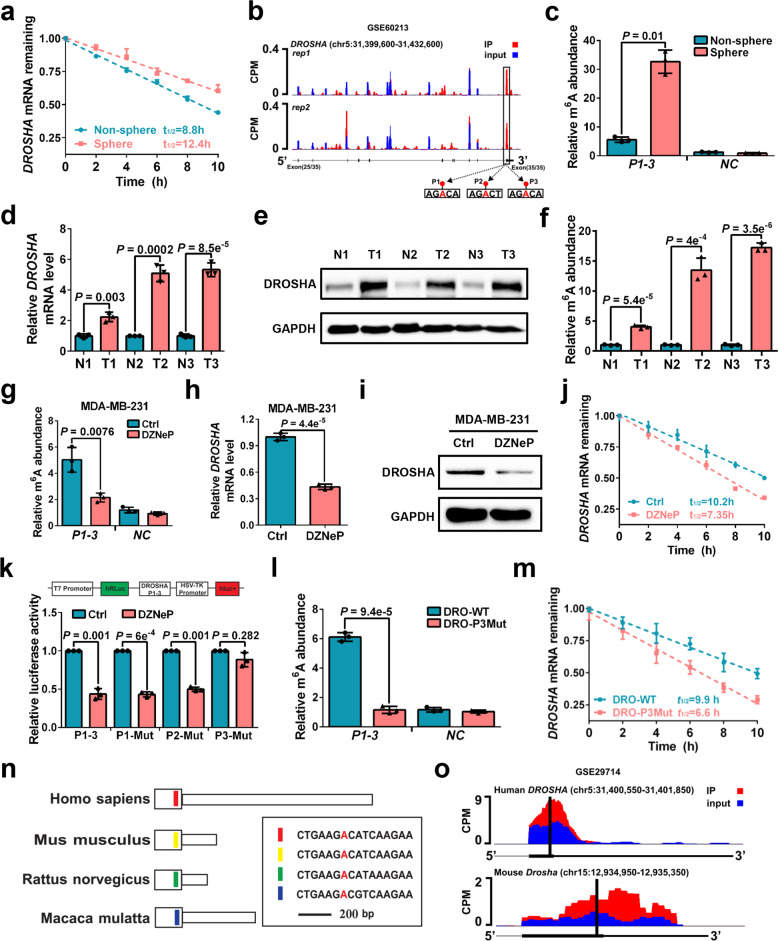
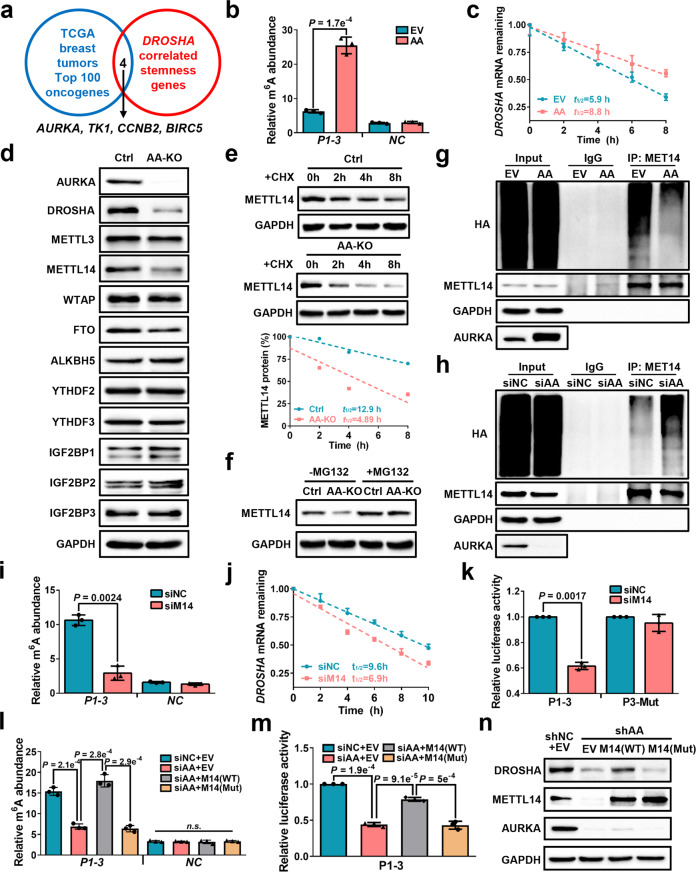
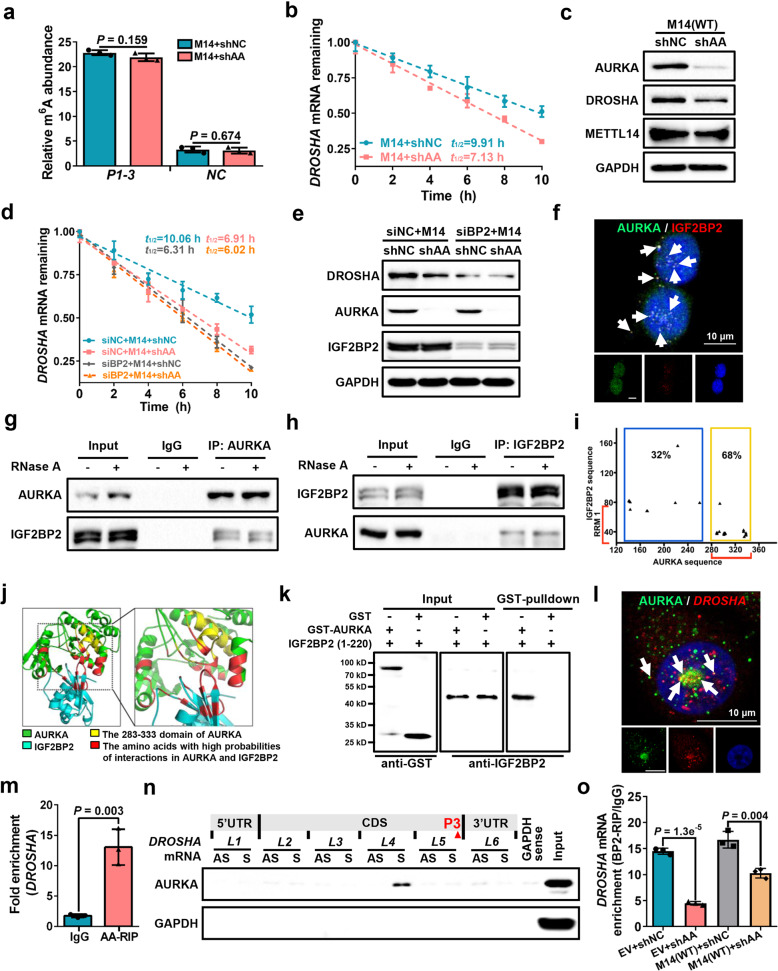
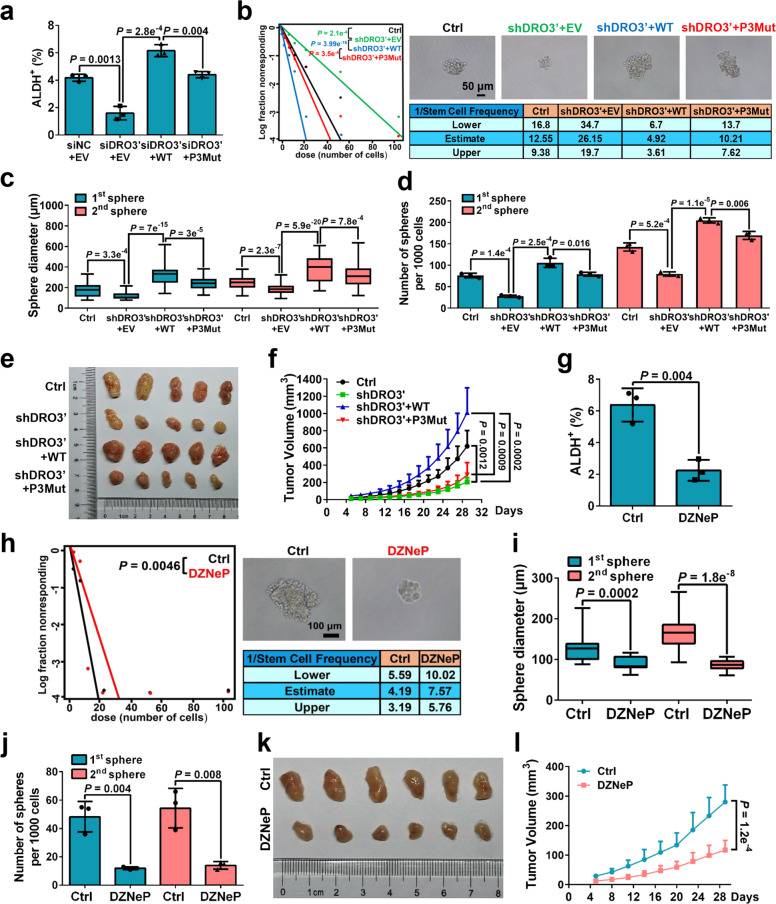
RNase III DROSHA is upregulated in multiple cancers and contributes to tumor progression by hitherto unclear mechanisms. Here, we demonstrate that DROSHA interacts with β-Catenin to transactivate STC1 in an RNA cleavage-independent manner, contributing to breast cancer stem-like cell (BCSC) properties. DROSHA mRNA stability is enhanced by N6-methyladenosine (m6A) modification which is activated by AURKA in BCSCs. AURKA stabilizes METTL14 by inhibiting its ubiquitylation and degradation to promote DROSHA mRNA methylation. Moreover, binding of AURKA to DROSHA transcript further strengthens the binding of the m6A reader IGF2BP2 to stabilize m6A-modified DROSHA. In addition, wild-type DROSHA, but not an m6A methylation-deficient mutant, enhances BCSC stemness maintenance, while inhibition of DROSHA m6A modification attenuates BCSC traits. Our study unveils the AURKA-induced oncogenic m6A modification as a key regulator of DROSHA in breast cancer and identifies a novel DROSHA transcriptional function in promoting the BCSC phenotype.


Conflict of interest statement

The authors declare no competing interests.

Figures

Fig. 1
Fig. 1. A non-canonical function of DROSHA in promoting STC1 transcription.
a Volcano plots displaying DEGs in microarray data comparing shDROSHA with shNC MDA-MB-231 cells. The numbers of significantly variant genes (FC > 1.5, P < 0.05) were shown. Vertical dashed lines indicate cut-off of FC (1.5), whereas the horizontal dashed lines indicate cut-off of P value (0.05). FC, fold change. b Upregulated DEGs in shNC group of microarray data were subjected to GSEA using the gene expression signature that was upregulated in the CD44+/CD24 signature acquired from a public database (GSE7513). c Overlapping stemness gene dataset and downregulated genes in shDROSHA cells from microarray data (FC > 1.5, P < 0.05), common genes were listed. d Relative luciferase activity of pGL3-STC1 in HEK293T cells with forced expression of WT and E1045Q DROSHA. e Western blotting showing STC1 and DROSHA expression in MDA-MB-231 cells with endogenous DROSHA knockdown and forced expression of WT and E1045Q DROSHA. f ChIP was performed to quantify the binding of DROSHA to STC1 in MDA-MB-231 cells with or without 5 μg/mL actinomycin D (ActD). g, h Co-IP assay to detect the interaction between DROSHA and β-Catenin in the nuclear extraction of MDA-MB-231 cells. Histone H3 as nuclear internal control and β-Actin as cytoplasmic internal control. i Relative luciferase activity of pGL3-STC1 in HEK293T cells with knockdown of β-Catenin and forced expression of DROSHA. siβ, siRNA against β-Catenin. j, k Relative luciferase activity of STC1 truncated promoters (j) and mutant promoters (k) in HEK293T cells with overexpression of DROSHA. l The simulated interaction diagram of β-Catenin and DROSHA. m Ability of the indicated Flag-labeled DROSHA derivatives to co-immunoprecipitate His-tagged β-Catenin defined by immunoblotting in HEK293T cells. n Relative luciferase activity of pGL3-STC1 in HEK293T cells with overexpression of the indicated DROSHA derivatives. Data are shown as means ± SD. P values were calculated with two-tailed unpaired Student’s t-test and P < 0.05 is considered statistically significant.
Fig. 2
Fig. 2. DROSHA-STC1 axis promotes BCSC properties.
a, b ALDH+ populations were analyzed in MDA-MB-231 (a) and BT549 (b) cells with DROSHA knockdown and forced expression of STC1. shDRO, shRNA against DROSHA. STC1, overexpression of STC1. c Left: ELDA was performed in MDA-MB-231 cells with DROSHA knockdown and forced expression of STC1. Top right: The representative sphere images are shown. Scale bars, 50 μm. Bottom right: Stemness frequency illustration of the cells with the upper and lower 95% confidence intervals meaning that the frequency of one stem cell in cancer cells. Spheres were counted from 24 replicate wells. d, e Replating sphere formation was performed in MDA-MB-231 cells with DROSHA knockdown and forced expression of STC1. The diameter (d) and number (e) of spheres were quantified. Spheres were counted from three replicate wells. The diameter and number of each experiment represent the total count of three replicate wells. f, g Immunodeficient mice (n = 5, biological replicates) were subcutaneously inoculated with MDA-MB-231 cells with forced expression of STC1 and DROSHA silencing (f), and tumor volumes were monitored (g). Ctrl, control cells. h Secondary limited dilution xenograft was performed by plating gradually decreasing numbers of primary xenografted tumor cells into immunodeficient mice (n = 5, biological replicates) and calculated with ELDA analysis. i Representative images of DROSHA, STC1 and NANOG IHC staining in breast tumor specimens (n = 58, biological replicates). Scale bars, 100 μm or 50 μm. Data are shown as means ± SD. P values were calculated with two-tailed unpaired Student’s t-test in a, b, e, g, ANOVA test in d, χ2 test in c, h, Pearson’s correlation test in i. P < 0.05 is considered statistically significant.
Fig. 3
Fig. 3. DROSHA mRNA is stabilized by m6A deposition.
a Stability of DROSHA mRNA in non-sphere and sphere of MDA-MB-231 cells. mRNA levels were quantified by RT-qPCR. b UCSC Genome Browser plot containing tracks for m6A-seq IP reads (red) and input reads (blue) at the DROSHA locus by analyzing meRIP-seq data (GSE60213). The sequence of m6A motif near DROSHA stop codon is highlighted in three black boxes. c meRIP-qPCR was used to quantify relative DROSHA P1-3 m6A levels in non-sphere or sphere of MDA-MB-231 cells. NC, negative control, the primer of DROSHA non-m6A segment. d, e Relative mRNA (d) and protein (e) levels of DROSHA were determined between three breast tumor specimens and paired adjacent normal breast specimens. f meRIP-qPCR was used to quantify relative DROSHA m6A levels in three breast tumor specimens and paired adjacent normal breast specimens. g meRIP-qPCR was used to quantify relative DROSHA P1-3 m6A levels in MDA-MB-231 cells treated with DZNeP. h, i Relative mRNA (h) and protein (i) levels of DROSHA were determined in MDA-MB-231 cells treated with DZNeP. j Stability of DROSHA mRNA in MDA-MB-231 cells treated with DZNeP. k Relative luciferase activity of the DROSHA P1-3, P1-Mut, P2-Mut or P3-Mut reporter in HEK293T cells treated with DZNeP (n = 3, biological replicates). l meRIP-qPCR was used to quantify relative DROSHA P1-3 m6A levels in MDA-MB-231 cells with forced expression of DRO-WT and DRO-P3Mut. m Stability of DROSHA mRNA in MDA-MB-231 cells by forced expression of DRO-WT and DRO-P3Mut. n Diagram of the last exon of DROSHA genes from various organisms including coding sequence (large box) and 3’UTR. The conserved sequences are indicated by colored boxes. o m6A-seq reads cluster at the same distinct regions of DROSHA in both human brain RNA (top) and mouse brain RNA (bottom) by analyzing meRIP-seq data (GSE29714). Data are shown as means ± SD. P values were calculated with two-tailed unpaired Student’s t-test and P < 0.05 is considered statistically significant.
Fig. 4
Fig. 4. AURKA-stabilized METTL14 maintains DROSHA transcript via m6A deposition.
a Comparison of DROSHA-correlated stemness genes with highly expressed oncogenes in TCGA breast tumor (top 100), common genes were listed. b meRIP-qPCR was used to determine relative DROSHA P1-3 m6A levels in AURKA-overexpressing SK-BR-3 cells. EV, empty vector, AA, overexpression of AURKA. c Stability of DROSHA mRNA in AURKA-overexpressing SK-BR-3 cells. d The expression of indicated proteins was detected in AURKA-knockout MDA-MB-231 cells by western blotting. AA-KO, knockout of AURKA. e METTL14 expression was detected in AURKA-knockout MDA-MB-231 cells treated with cycloheximide (CHX, 200 μg/mL). METTL14 proteins were quantified by densitometry and plotted as a scatter diagram at the bottom. f METTL14 expression was detected in AURKA-knockout MDA-MB-231 cells treated with MG132 (10 μM) for 8 h. g, h HEK293T cells were transfected with indicated constructs (g) or siRNAs (h) followed by co-transfection with HA-Ub and METTL14 constructs. Cells were treated with MG132 (10 μM) for 8 h before collection. The whole cell lysate was subjected to immunoprecipitation with METTL14 antibody and western blotting with anti-HA antibody to detect ubiquitylated METTL14. i meRIP-qPCR was performed to verify relative DROSHA P1-3 m6A levels in METTL14-knockdown MDA-MB-231 cells. j Stability of DROSHA mRNA in METTL14-knockdown MDA-MB-231 cells. k Relative luciferase activity of P1-3 and P3-Mut in HEK293T cells with METTL14 knockdown. l Relative DROSHA P1-3 m6A levels were detected in AURKA-deficient MDA-MB-231 cells with or without overexpression of indicated METTL14. m Relative luciferase activity of P1-3 in AURKA-deficient HEK293T cells with or without indicated overexpression of METTL14. n DROSHA, METTL14 and AURKA protein expression was identified in AURKA-deficient MDA-MB-231 cells with or without overexpression of indicated METTL14. shAA, shRNA against AURKA. Data are shown as means ± SD. P values were calculated with two-tailed unpaired Student’s t-test and P < 0.05 is considered statistically significant.
Fig. 5
Fig. 5. AURKA strengthens IGF2BP2 binding to m6A for DROSHA transcript stabilization.
a meRIP-qPCR was performed to verify relative DROSHA P1-3 m6A levels in METTL14-overexpressing MDA-MB-231 cells with or without AURKA-deficiency. b Stability of DROSHA mRNAs were identified in METTL14-overexpressing MDA-MB-231 cells with or without AURKA-deficiency. c The protein expression of AURKA, DROSHA and METTL14 was identified in METTL14-overexpressing MDA-MB-231 cells with or without AURKA deficiency. d Stability of DROSHA mRNAs was evaluated in METTL14-overexpressing plus IGF2BP2-knockdown (siIGF2BP2) or siNC MDA-MB-231 cells with or without AURKA deficiency. e DROSHA, AURKA and IGF2BP2 proteins were detected by western blotting in METTL14-overexpression plus siIGF2BP2 or siNC MDA-MB-231 cells with or without AURKA deficiency. f The representative image of co-staining of AURKA protein (green) and IGF2BP2 protein (red) were observed in MDA-MB-231 cells. The nucleus was stained by DAPI (blue). Scale bars, 10 μm. g, h Co-IP assay to identify the endogenous interaction between AURKA and IGF2BP2 in MDA-MB-231 cells. Cell extracts were untreated (–) or treated (+) with RNase A (50 mg/mL). i The dot plot represents the amino acids in orange box located in the nucleotide 283–333 region of the AURKA sequence and the RRM region of the IGF2BP2 sequence. j The simulated interaction diagram of AURKA and IGF2BP2. k Direct interaction between GST-AURKA fusion protein and recombinant IGF2BP2 (1–220) protein was determined by in vitro interaction assay. l The representative image of co-staining (indicated by white arrows) of AURKA protein (green) and DROSHA mRNA (red) observed in the nucleus (blue). Scale bars, 10 μm. m Levels of AURKA-binding to DROSHA mRNA were determined by RIP assay in MDA-MB-231 cells. n Proteins in MDA-MB-231 cells pulled down by the indicated biotin-RNAs were analyzed with AURKA antibody. AS, antisense; S, sense. o Levels of IGF2BP2 binding to DROSHA mRNA were determined by RIP assay with or without AURKA-deficiency in control MDA-MB-231 cells or METTL14-overexpressing MDA-MB-231 cells. Data are shown as means ± SD. P values were calculated with two-tailed unpaired Student’s t-test and P < 0.05 is considered statistically significant.
Fig. 6
Fig. 6. Suppression of DROSHA m6A modification attenuates BCSC traits.
a ALDH+ populations were analyzed following endogenous DROSHA knockdown and forced expression of WT or P3Mut DROSHA in MDA-MB-231 cells. siDRO3′, siRNA against DROSHA 3′UTR. b Left: ELDA was performed in MDA-MB-231 cells with endogenous DROSHA knockdown and forced expression of WT or P3Mut DROSHA. Top right: The representative sphere images are shown. Scale bars, 50 μm. Bottom right: Stemness frequency illustration of the cells with the upper and lower 95% confidence intervals meaning that the frequency of one stem cell in cancer cells. shDRO3′, shRNA against DROSHA 3′UTR. Spheres were counted from 24 replicate wells. c, d Replating sphere formation was performed in MDA-MB-231 cells with endogenous DROSHA knockdown and forced expression of indicated DROSHA. The diameter (c) and number (d) of spheres were quantified. Spheres were counted from three replicate wells. The diameter and number of each experiment represent the total count of three replicate wells. e, f Immunodeficient mice (n = 5, biological replicates) were subcutaneously inoculated with MDA-MB-231 cells with endogenous DROSHA knockdown and forced expression indicated DROSHA (e), and tumor volumes were monitored (f). g ALDH+ populations were analyzed in MDA-MB-231 cells treated with DZNeP. h Left: ELDA was addressed in MDA-MB-231 cells treated with DZNeP. Top right: The representative sphere images are shown. Scale bars, 100 μm. Bottom right: Stemness frequency illustration of the cells with the upper and lower 95% confidence intervals meaning that the frequency of one stem cell in cancer cells. Spheres were counted from twenty-four replicate wells. i, j Replating sphere formation was performed in MDA-MB-231 cells treated with DZNeP. The diameter (i) and number (j) of spheres were quantified. Spheres were counted from three replicate wells. The diameter and number of each experiment represent the total count of three replicate wells. k, l Immunodeficient mice (n = 6, biological replicates) were subcutaneously inoculated with MDA-MB-231 cells treated with DZNeP (k), and tumor volumes were measured (l). Data are shown as means ± SD. P values were calculated with two-tailed unpaired Student’s t-test in a, d, fg, j, l, ANOVA test in c and i, χ2 test in b, h. P < 0.05 is considered statistically significant.

Similar articles

Cited by

References

    1. Han J, et al. Posttranscriptional crossregulation between Drosha and DGCR8. Cell. 2009;136:75–84. doi: 10.1016/j.cell.2008.10.053. - DOI - PMC - PubMed
    1. Melamed Z, et al. Alternative splicing regulates biogenesis of miRNAs located across exon-intron junctions. Mol. Cell. 2013;50:869–881. doi: 10.1016/j.molcel.2013.05.007. - DOI - PubMed
    1. Nepal C, et al. Transcriptional, post-transcriptional and chromatin-associated regulation of pri-miRNAs, pre-miRNAs and moRNAs. Nucleic Acids Res. 2016;44:3070–3081. doi: 10.1093/nar/gkv1354. - DOI - PMC - PubMed
    1. Wagschal A, et al. Microprocessor, Setx, Xrn2, and Rrp6 co-operate to induce premature termination of transcription by RNAPII. Cell. 2012;150:1147–1157. doi: 10.1016/j.cell.2012.08.004. - DOI - PMC - PubMed
    1. Lin S, Gregory RI. MicroRNA biogenesis pathways in cancer. Nat. Rev. Cancer. 2015;15:321–333. doi: 10.1038/nrc3932. - DOI - PMC - PubMed

Publication types

MeSH terms