. 2020 Nov 2;217(11):e20191115.
doi: 10.1084/jem.20191115.

β-Catenin induces transcriptional expression of PD-L1 to promote glioblastoma immune evasion

Affiliations

β-Catenin induces transcriptional expression of PD-L1 to promote glioblastoma immune evasion

Linyong Du et al. J Exp Med. .

Abstract

PD-L1 up-regulation in cancer contributes to immune evasion by tumor cells. Here, we show that Wnt ligand and activated EGFR induce the binding of the β-catenin/TCF/LEF complex to the CD274 gene promoter region to induce PD-L1 expression, in which AKT activation plays an important role. β-Catenin depletion, AKT inhibition, or PTEN expression reduces PD-L1 expression in tumor cells, enhances activation and tumor infiltration of CD8+ T cells, and reduces tumor growth, accompanied by prolonged mouse survival. Combined treatment with a clinically available AKT inhibitor and an anti-PD-1 antibody overcomes tumor immune evasion and greatly inhibits tumor growth. In addition, AKT-mediated β-catenin S552 phosphorylation and nuclear β-catenin are positively correlated with PD-L1 expression and inversely correlated with the tumor infiltration of CD8+ T cells in human glioblastoma specimens, highlighting the clinical significance of β-catenin activation in tumor immune evasion.


Conflict of interest statement

Disclosures: The authors declare no competing interests exist.

Figures

None
Graphical abstract
Figure 1.
Figure 1.
Wnt-induced β-catenin activation results in PD-L1 up-regulation in tumor cells. (B, D, F, and G) Immunoblotting analyses were performed with the indicated antibodies. (E–G) Data represent the means ± SD of three independent experiments. (A) IHC staining of 20 diffuse astrocytoma (grade II), 20 anaplastic astrocytoma (grade III), and 50 GBM (grade IV) specimens was performed with the indicated antibodies. Representative images of IHC staining from the specimens are shown. Scale bar, 50 µm. Red arrows point to CD8+ cells. (B) The indicated tumor cells were serum starved for 12 h and then stimulated with Wnt3A (20 ng/ml) for the indicated periods of time. Immunoblotting analyses were performed. (C) U87/EGFR cells were treated with or without Wnt3A (20 ng/ml) for 12 h. A cell surface analysis of PD-L1 protein was performed using a flow cytometer. (D) Serum-starved U87/EGFR cells were pretreated with or without actinomycin D (1 µg/ml) for 2 h and then stimulated with or without Wnt3A (20 ng/ml) for 12 h. (E) The indicated tumor cells were serum starved for 12 h and then stimulated with or without Wnt3A (20 ng/ml) for the indicated periods of time. Real-time PCR analyses were performed. *, P < 0.0001, on the basis of Student’s t test. (F) U87/EGFR cells with stable expression of β-catenin shRNA or a control shRNA were treated with or without Wnt3A (20 µg/ml) for 12 h. A real-time PCR analysis (top panel) and immunoblotting analyses (bottom panel) were performed. β-Catenin shRNA#2 was used for the subsequent experiments. *, P < 0.0001, on the basis of Student’s t test. (G) U251 and U87/EGFR cells were transfected with control vector or CA β-catenin for 48 h. A real-time PCR analysis (top panel) and immunoblotting analyses (bottom panel) were performed. *, P < 0.0001, on the basis of Student’s t test. (H) A control vector or CA β-catenin was stably expressed in U87/EGFR cells. A cell surface analysis of PD-L1 protein was performed using a flow cytometer. WB, Western blot.
Figure S1.
Figure S1.
Wnt-induced β-catenin activation results in PD-L1 up-regulation in tumor cells. (A) The IHC stains in Fig. 1 A were scored, and correlation analyses were performed. A Pearson correlation test was used. Note that the scores of some samples overlap. (B) Serum-starved U251 cells were pretreated with or without actinomycin D (1 µg/ml) for 2 h and then stimulated with or without Wnt3A (20 ng/ml) for 12 h. Immunoblotting analyses were performed with the indicated antibodies. (C) U251 and U87/EGFR cells were treated with or without Wnt3A (20 ng/ml) for the indicated periods of time in the presence of actinomycin D (1 µg/ml). Real-time PCR analyses were performed. (D) The indicated tumor cells were serum starved for 12 h and then stimulated with or without Wnt3A (20 ng/ml) for the indicated periods of time. Real-time PCR analyses were performed. (E) U251 cells with or without stable expression of β-catenin shRNA or a control shRNA were treated with or without Wnt3A (20 µg/ml) for 12 h. A real-time PCR analysis (top) and immunoblotting analyses (bottom) were performed. Data represent the means ± SD of three independent experiments. *, P < 0.0001, on the basis of Student’s t test. LPF, low-power field; WB, Western blot.
Figure 2.
Figure 2.
AKT activation induced by EGFR-dependent PI3K activation, PTEN loss, and Wnt3A enhances PD-L1 expression in a β-catenin–dependent manner. (A–J) Real-time PCR analyses or immunoblotting analyses were performed with the indicated primer or antibodies. (A, C–H, J) Data represent the means ± SD of three independent experiments. (A) Left panel: The indicated tumor cells were serum starved for 12 h and then stimulated with or without EGF (100 ng/ml) for 12 h. Right panel: U87 cells were stably transfected with plasmids expressing control vector or EGFRvIII. Real-time PCR analyses (top panel) and immunoblotting analyses (bottom panel) were performed. *, P < 0.0001, on the basis of Student’s t test. (B) Serum-starved U87/EGFR cells were pretreated with or without actinomycin D (1 µg/ml) for 2 h and then stimulated with or without EGF (100 ng/ml) for 12 h. (C) U87/EGFRvIII cells were stably expressed with a β-catenin shRNA or a control shRNA. *, P < 0.0001, on the basis of Student’s t test. (D) U87/EGFRvIII cells with stable expression of the β-catenin shRNA or a control shRNA were reconstituted with or without WT rβ-catenin or rβ-catenin S552A mutant. *, P < 0.001, on the basis of the one-way ANOVA; n.s., not significant. (E) U87/EGFR cells were stably transfected with an HA vector or HA-myr-AKT1. *, P < 0.0001, on the basis of Student’s t test. (F) Serum-starved U87/EGFRvIII cells were treated with DMSO, MK2206 (5 µM), or LY294002 (20 µM) for 12 h. *, P < 0.0001, on the basis of Student’s t test. (G) U87/EGFRvIII cells were transfected with control vector or CA β-catenin for 48 h and then treated with DMSO or MK2206 (5 µM) for 12 h. *, P < 0.001, on the basis of one-way ANOVA. (H) U251 and U87 cells were transfected with SFB-tagged control vector or SFB-PTEN for 48 h and then treated with EGF (100 ng/ml) for 12 h. *, P < 0.001, on the basis of Student’s t test. (I) U87/EGFR cells were pretreated with DMSO or MK2206 (5 µM) for 2 h and then stimulated with or without Wnt3A (20 ng/ml) for 30 min. (J) U87/EGFR cells were pretreated with DMSO or MK2206 (5 µM) for 2 h and then stimulated with or without Wnt3A (20 ng/ml) for 12 h. *, P < 0.01, on the basis of Student’s t test. WB, Western blotting.
Figure S2.
Figure S2.
AKT activation induced by EGFR-dependent PI3K activation, PTEN loss, and Wnt3A enhances PD-L1 expression in a β-catenin–dependent manner. (A) Serum-starved U251 cells were pretreated with or without actinomycin D (1 µg/ml) for 2 h and then stimulated with or without EGF (100 ng/ml) for 12 h. Immunoblotting analyses were performed with the indicated antibodies. (B) U251 cells with stable expression of a β-catenin shRNA or a control shRNA were treated with or without EGF (100 ng/ml) for 12 h. Real-time PCR analyses were performed. Data represent the means ± SD of three independent experiments. *, P < 0.0001, on the basis of Student’s t test. Immunoblotting analyses were performed with the indicated antibodies. (C) U251 and U87/EGFR cells with stable expression of a β-catenin shRNA or a control shRNA were treated with or without EGF (100 ng/ml) for 12 h in the presence or absence of actinomycin D (1 µg/ml). Real-time PCR analyses were performed. Data represent the means ± SD of three independent experiments. *, P < 0.0001, on the basis of Student’s t test. (D) Serum-starved U251 cells were pretreated with DMSO, MK2206 (5 µM), or LY294002 (20 µM) for 2 h and then stimulated with or without EGF (100 ng/ml) for 12 h. Real-time PCR analyses were performed. Data represent the means ± SD of three independent experiments. *, P < 0.0001, on the basis of Student’s t test. Immunoblotting analyses were performed with the indicated antibodies. (E) GSC 6–27 and GSC 7–11 human primary GBM cells were pretreated with DMSO or MK2206 (5 µM) for 2 h and then stimulated with or without EGF (100 ng/ml) for 12 h. Immunoblotting analyses were performed with the indicated antibodies. WB, Western blot.
Figure 3.
Figure 3.
β-Catenin/TCF/LEF complex binds to the CD274 promoter region in response to AKT activation and enhances CD274 transcription. (B–G) Data represent the means ± SD of three independent experiments. (A) Schematic illustration of the proximal region of human CD274 promoter. (B) U87/EGFR cells were transfected with luciferase reporter vectors containing WT or TCF/LEF mutant sequences of CD274 promoter (600 bp upstream from the transcription start site). After cotransfection with a control vector or a vector expressing CA β-catenin, the cells were stimulated with or without Wnt3A (20 ng/ml) or EGF (100 ng/ml) for 12 h. Luciferase activity was measured. *, P < 0.0001, on the basis of Student’s t test; n.s., not significant. (C) U87/EGFR cells were transfected with a control vector or a vector expressing CA β-catenin for 48 h or stimulated with or without Wnt3A (20 ng/ml) or EGF (100 ng/ml) for 12 h. ChIP assays were performed with an anti-IgG, anti–β-catenin (left panel) or anti-LEF1 antibody (right panel), and quantitative PCR analyses were performed with primers against the promoter of CD274. *, P < 0.0001, on the basis of Student’s t test. (D) U87/EGFR cells with expression of a luciferase reporter vector containing WT TCF/LEF sequence of CD274 promoter were pretreated with or without MK2206 (5 µM) for 2 h and then stimulated with or without Wnt3A (20 ng/ml) or EGF (100 ng/ml) for 12 h. Luciferase activity was measured. *, P < 0.01, on the basis of Student’s t test. (E) U87/EGFR cells were pretreated with or without MK2206 (5 µM) for 2 h and then stimulated with or without Wnt3A (20 ng/ml) or EGF (100 ng/ml) for 12 h. ChIP assays were performed with an anti–IgG or anti–β-catenin antibody, and quantitative PCR analyses were performed with primer against promoter of CD274. *, P < 0.01, on the basis of Student’s t test. (F) U87/EGFRvIII cells with stable expression of the β-catenin shRNA and with reconstituted expression of WT rβ-catenin or rβ-catenin S552A mutant were transfected with a luciferase reporter vector containing WT LEF/TCF sequence of CD274 promoter. These cells were stimulated with or without Wnt3A (20 ng/ml) or EGF (100 ng/ml) for 12 h. Luciferase activity was measured. *, P < 0.01, on the basis of Student’s t test. (G) U87/EGFRvIII cells with stable expression of the β-catenin shRNA were reconstituted with WT rβ-catenin or rβ-catenin S552A mutant expression. The cells were stimulated with or without Wnt3A (20 ng/ml) or EGF (100 ng/ml) for 12 h. ChIP assays with an anti-IgG or anti-Flag antibody and quantitative PCR analyses with primers against promoter of CD274 were performed. *, P < 0.01, on the basis of Student’s t test. IP, immunoprecipitation; Mut, mutation.
Figure S3.
Figure S3.
β-catenin/TCF/LEF complex binds to the CD274 promoter region in response to AKT activation and enhances CD274 transcription. (C–G) Data represent the means ± SD of three independent experiments. (A) Serum-starved U251 cells were stimulated with or without Wnt3A (20 ng/ml) or EGF (100 ng/ml) for 6 h. Immunoprecipitation analyses were performed with an anti–β-catenin antibody. Immunoblotting analyses were conducted with the indicated antibodies. (B) U251 cells were stably expressed with LEF-1 shRNA or a control shRNA. Immunoblotting analyses were performed with the indicated antibodies. (C) U251 cells with stable expression of the LEF-1 shRNA or a control shRNA were transfected with a luciferase reporter vector containing the WT LEF/TCF sequence of CD274 promoter. These cells were stimulated with or without Wnt3A (20 ng/ml) or EGF (100 ng/ml) for 12 h. Luciferase activity was measured. *, P < 0.01, on the basis of Student’s t test. (D) U87/EGFRvIII cells with expression of a luciferase reporter vector containing WT LEF/TCF sequence of CD274 promoter were treated with or without MK2206 (5 µM) for 12 h. Luciferase activity was measured. *, P < 0.001, on the basis of Student’s t test. (E) U87/EGFRvIII cells were treated with or without MK2206 (5 µM) for 12 h. ChIP assays with an anti-IgG or anti–β-catenin antibody and quantitative PCR analyses with primers against promoter of CD274 were performed. *, P < 0.001, on the basis of Student’s t test. (F) U251 and U87 cells were cotransfected with a luciferase reporter vector containing WT LEF/TCF sequence of CD274 promoter and an SFB-tagged control vector or a vector expressing SFB-PTEN. These cells were stimulated with EGF (100 ng/ml) for 12 h. Luciferase activity was measured. *, P < 0.001, on the basis of Student’s t test. (G) U251 and U87 cells were transfected with an SFB-tagged control vector or a vector expressing SFB-PTEN for 48 h and then stimulated with EGF (100 ng/ml) for 12 h. ChIP assays with anti–β-catenin antibody and quantitative PCR analyses with primers against the promoter of CD274 were performed. *, P < 0.001, on the basis of Student’s t test. IP, immunoprecipitation; WB, Western blot.
Figure 4.
Figure 4.
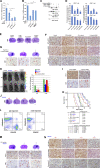
β-Catenin activation promotes immune evasion of tumor cells and brain tumor growth. (A) Mouse primary CD8+ T cells were preactivated for 12 h with PMA (20 ng/ml) and ionomycin (500 ng/ml) and co-cultured with or without PTEN shRNA or CA β-catenin–expressing GL261 cells that had been pretreated with Wnt3A (20 ng/ml) for 12 h to up-regulate PD-L1 expression. IL-2 mRNA expression levels in the mouse primary CD8+ T cells were measured by real-time PCR analysis 24 h after co-culture. Data represent the means ± SD of three independent experiments. **, P < 0.001; *, P < 0.01, on the basis of one-way ANOVA. (B–D) A total of 105 FL-expressing GL261 (GL261-FL) cells with or without expression of PTEN shRNA, CA β-catenin, or β-catenin shRNA were intracranially injected into syngeneic C57BL/6 mice. Tumor growth was monitored and analyzed beginning on the fourth day after injection. (B) Representative tumor growth was shown in vivo by bioluminescence imaging using IVIS 100 on day 15. (C) A bioluminescence imaging analysis of tumor burden was performed on the indicated days. Data represent the means ± SD of nine mice. *, P < 0.001, on the basis of Student’s t test. (D) Top: The mouse survival times were recorded and visualized using Kaplan-Meier survival curves. Bottom: Data represent the means ± SD of nine mice. Tables show the median survival of mice and the P values, which were calculated using the log-rank test and Gehan-Breslow-Wilcoxon test, respectively. *, P < 0.001, on the basis of Student’s t test. (E) The IHC staining of the mouse tumor tissues was performed with the indicated antibodies. Representative images are shown. Scale bar, 100 µm (CD8+ images); 50 µm (PD-L1 images). High-magnification images correspond to the areas marked by the red box. Red arrows point to CD8+ cells. (F–H) 105 GL261-FL cells with expression of PTEN shRNA were intracranially injected into syngeneic C57BL/6 mice. Tumor growth was monitored and analyzed beginning on the fourth day after injection. (F) Top: The treatment protocol is summarized. Bottom: Representative tumor growth is shown in vivo by bioluminescence imaging using IVIS 100 on day 15. (G) A bioluminescence imaging analysis of tumor burden was performed on the indicated days. Data represent the means ± SD of nine mice. *, P < 0.001; **, P < 0.0001 on the basis of Student’s t test. (H) Top: Mouse survival time was recorded and visualized using Kaplan-Meier survival curves. Data represent the means ± SD of nine mice. Bottom: Tables show the median survival of mice and the P values, which were calculated using the log-rank test and Gehan-Breslow-Wilcoxon test, respectively. *, P < 0.001; **, P < 0.0001 on the basis of Student’s t test. (I) The IHC staining of mouse tumor tissues was performed with the indicated antibodies. Representative images are shown. Scale bar, 100 µm (CD8+ images); 50 µm (PD-L1 images). High-magnification images correspond to the areas marked by the red box. Red arrows point to CD8+ cells. Min, minimum; Max, maximum.
Figure S4.
Figure S4.
β-catenin activation promotes immune evasion of tumor cells and brain tumor growth. (A) GL261 cells with or without expressing PTEN shRNA or CA β-catenin were pretreated with Wnt3A (20 ng/ml) for 12 h to up-regulate PD-L1 expression, whereas mouse primary CD8+ T cells were preactivated for 12 h with PMA (20 ng/ml) and ionomycin (500 ng/ml). These CD8+ T cells were then cultured with or without the GL261 cells for 24 h. IFNγ mRNA expression levels in the mouse primary CD8+ T cells were measured by real-time PCR analysis. Data represent the means ± SD of three independent experiments. *, P < 0.01, on the basis of one-way ANOVA. (B) Jurkat T cells were preactivated for 12 h with PMA (20 ng/ml) and ionomycin (500 ng/ml) and co-cultured with or without SFB-PTEN–, β-catenin shRNA–, or control vector–expressing U251 cells that had been pretreated with Wnt3A (20 ng/ml) for 12 h to up-regulate PD-L1 expression. IL-2 mRNA expression levels in the Jurkat T cells were measured by real-time PCR analysis 24 h after co-culture. Data represent the means ± SD of three independent experiments. *, P < 0.001; #, P < 0.01, on the basis of one-way ANOVA. (C and D) H2-KD shRNA, PTEN shRNA, or a control shRNA was stably expressed in GL261 cells. (C) Immunoblotting analyses were performed with the indicated antibodies. (D) These GL261 cells were co-cultured with activated CD4+ or CD8+ T cells. IL-2 and IFNγ production in CD8+ or CD4+ T cells was determined by ELISpot analyses. Data represent the means ± SD of three independent experiments. *, P < 0.001, on the basis of one-way ANOVA. (E) Hematoxylin and eosin–stained coronal brain sections in Fig. 4 B show representative tumor xenografts. Scale bar, 2 mm. (F) The IHC staining of the mouse tumor tissues was performed with the indicated antibodies. Representative images are shown. Scale bar, 50 µm. (G) GL261 cells with or without expression of β-catenin shRNA or Flag–PD-L1 were intracranially injected into syngeneic C57BL/6 mice. Top panel: Hematoxylin and eosin–stained coronal brain sections show representative tumor xenografts. Scale bar, 2 mm. Bottom panel: The IHC staining of the mouse tumor tissues was performed with an anti-CD8 antibody. Representative images are shown. Scale bar, 100 µm. Red arrows point to CD8+ cells. (H, I, and K) 105 CT-2A–FL cells with or without expression of β-catenin shRNA were intracranially injected into syngeneic C57BL/6 mice. The mice were treated with or without MK2206 or an anti–PD-1 antibody (as indicated in Fig. 4 F) in combination with or without an anti-CD8 antibody. Tumor growth was monitored and analyzed. (H) Left: Representative tumor growth is shown in vivo by bioluminescence imaging using IVIS 100 on day 15. Right: A bioluminescence imaging analysis of tumor burden was performed. *, P < 0.01; **, P < 0.001 on the basis of Student’s t test. (I) The IHC staining of the mouse tumor tissues was performed with the indicated antibodies. Representative images are shown. Scale bar, 100 µm. Red arrows point to CD8+ cells. (K) Top: The mouse survival times were recorded and visualized using Kaplan-Meier survival curves. Middle and bottom: Data represent the means ± SD of nine mice. Tables show the median survival of mice and the P values, which were calculated using the log-rank test and Gehan-Breslow-Wilcoxon test, respectively. *, P < 0.05, on the basis of Student’s t test. (J) Hematoxylin and eosin–stained coronal brain sections in Fig. 4 F show representative tumor xenografts. Scale bar, 2 mm. (L) Quantification of CD8+ T cells from spleens of the mice with IgG or an anti-CD8 antibody injection. (M) GL261 cells with or without expression of CA β-catenin were intracranially injected into syngeneic C57BL/6 mice. The mice were injected with or without MK2206 as described in Fig. 4 F legend. Top: Hematoxylin and eosin–stained coronal brain sections show representative tumor xenografts. Scale bar, 2 mm. Bottom: The IHC staining of the mouse tumor tissues was performed with the indicated antibodies. Representative images are shown. Scale bar, 100 µm. Red arrows point to CD8+ cells. (N) The IHC staining of the mouse tumor tissues was performed with the indicated antibodies. Representative images are shown. Scale bar, 50 µm. WB, Western blot.
Figure 5.
Figure 5.
PD-L1 expression is positively correlated with the levels of β-catenin S552 phosphorylation in human GBM. (A) TCGA analysis of CD274 mRNA expression (normalized Z-score) in GBM specimens (n = 145) with (n = 50) or without (n = 95) PTEN mutations was performed. Boxes represent the median and the interquartile range. Error bars are drawn from the 25th to the 75th percentile. The Wilcoxon rank-sum test was used to compare the differences in mRNA expression between two groups (i.e., PTEN mutation vs. WT). *, P < 0.05, on the basis of Student’s t test. (B) Human GBM specimens were subjected to immunoblotting analysis with the indicated antibodies. (C) The IHC staining of 50 human GBM specimens was performed with the indicated antibodies. Scale bar, 100 µm. Red arrows point to CD8+ T cells. (D) The IHC staining was scored, and correlation analyses were performed. The Pearson correlation test was used. Note that the scores of some samples overlap. (E) A mechanism of tumor immune evasion via transcriptional up-regulation of PD-L1. PD-L1 is transcriptionally enhanced by the β-catenin/TCF/LEF transcriptional complex in response to EGFR-dependent PI3K activation, PTEN loss, and active Wnt singling. Activated AKT activates β-catenin via direct phosphorylation of β-catenin and inhibition of GSK-3β. LPF, low-power field; MUT, mutant; WB, Western blot.
Figure S5.
Figure S5.
PD-L1 expression is positively correlated with the levels of β-catenin S552 phosphorylation in human GBM. (A) Correlative expression of CD274 mRNA expression with LEF-1 (left) and PPARδ (right) in the TCGA cohort of GBM (n = 145) was analyzed. Pearson r values and probabilities are presented for correlations. Gene expression values are normalized. (B) 39 human GBM specimens were subjected to an immunoblotting analysis with the indicated antibodies. (C) Immunofluorescent staining of the human GBM specimens was performed with the indicated antibodies. Scale bar, 50 µm. WB, Western blot.

Comment in

References

    1. Anastas J.N., and Moon R.T.. 2013. WNT signalling pathways as therapeutic targets in cancer. Nat. Rev. Cancer. 13:11–26. 10.1038/nrc3419 - DOI - PubMed
    1. Boussiotis V.A. 2016. Molecular and Biochemical Aspects of the PD-1 Checkpoint Pathway. N. Engl. J. Med. 375:1767–1778. 10.1056/NEJMra1514296 - DOI - PMC - PubMed
    1. Cabodevilla A.G., Sánchez-Caballero L., Nintou E., Boiadjieva V.G., Picatoste F., Gubern A., and Claro E.. 2013. Cell survival during complete nutrient deprivation depends on lipid droplet-fueled β-oxidation of fatty acids. J. Biol. Chem. 288:27777–27788. 10.1074/jbc.M113.466656 - DOI - PMC - PubMed
    1. Cadigan K.M., and Waterman M.L.. 2012. TCF/LEFs and Wnt signaling in the nucleus. Cold Spring Harb. Perspect. Biol. 4 a007906 10.1101/cshperspect.a007906 - DOI - PMC - PubMed
    1. Cancer Genome Atlas Research Network 2008. Comprehensive genomic characterization defines human glioblastoma genes and core pathways. Nature. 455:1061–1068. 10.1038/nature07385 - DOI - PMC - PubMed

Publication types

MeSH terms