

Stunting in childhood: an overview of global burden, trends, determinants, and drivers of decline
- PMID: 32860401
- PMCID: PMC7487433
- DOI: 10.1093/ajcn/nqaa159
Stunting in childhood: an overview of global burden, trends, determinants, and drivers of decline
Abstract
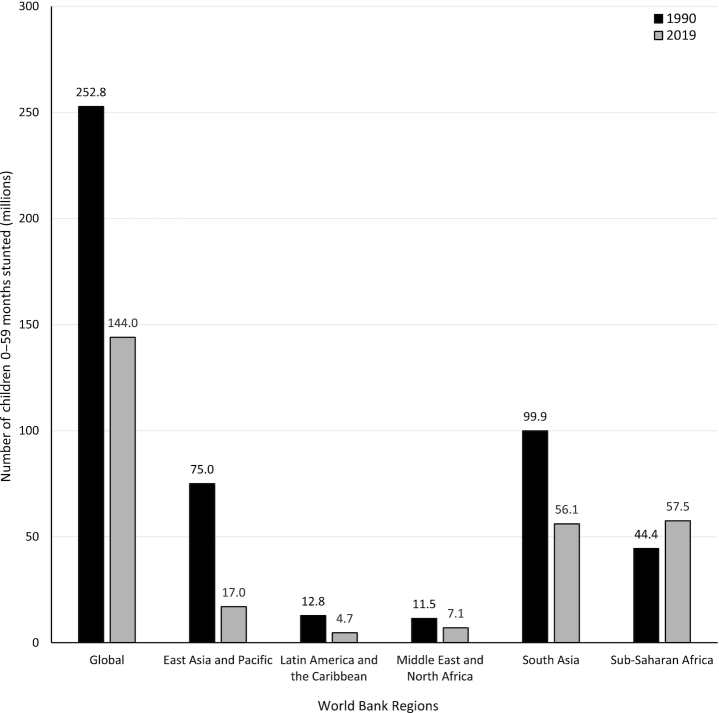
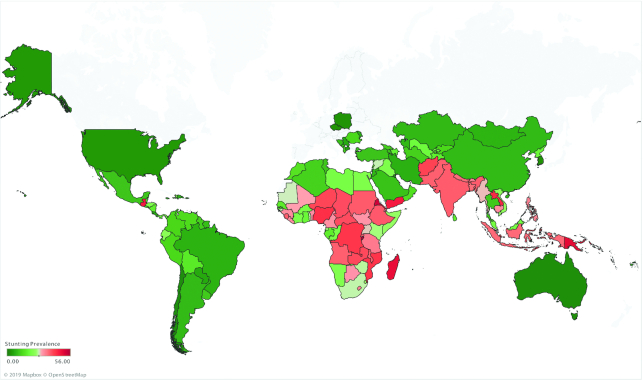
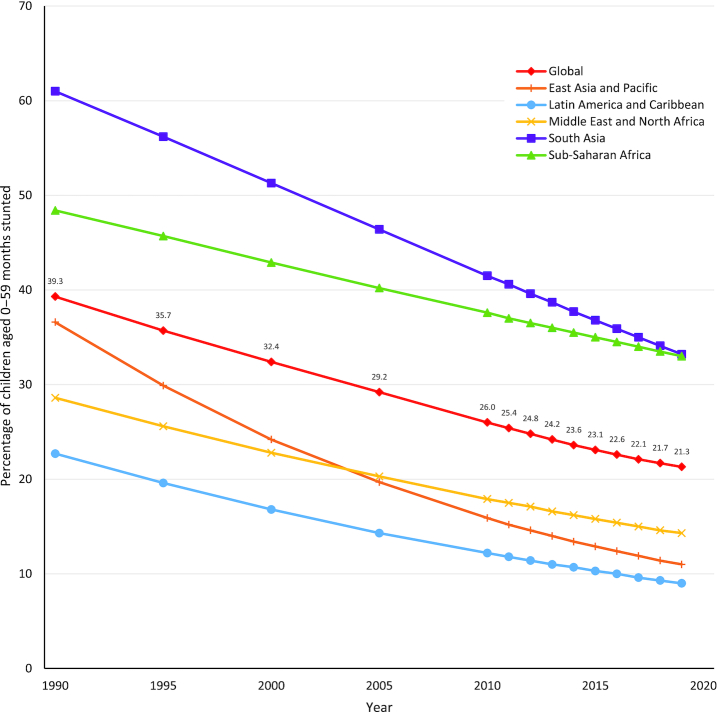
Background: Progress has been made worldwide in reducing chronic undernutrition and rates of linear growth stunting in children under 5 y of age, although rates still remain high in many regions. Policies, programs, and interventions supporting maternal and child health and nutrition have the potential to improve child growth and development.
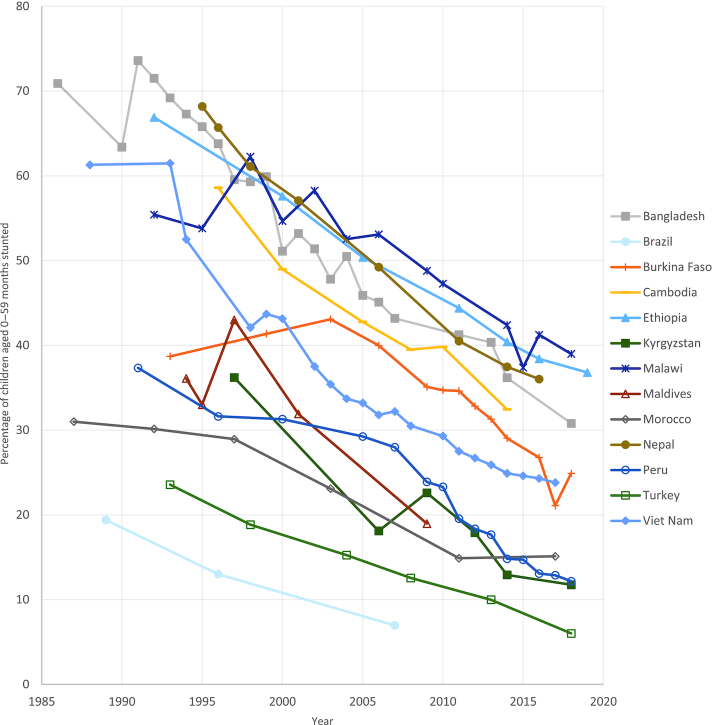
Objective: This article synthesizes the available global evidence on the drivers of national declines in stunting prevalence and compares the relative effect of major drivers of stunting decline between countries.
Methods: We conducted a systematic review of published peer-reviewed and gray literature analyzing the relation between changes in key determinants of child linear growth and contemporaneous changes in linear growth outcomes over time.
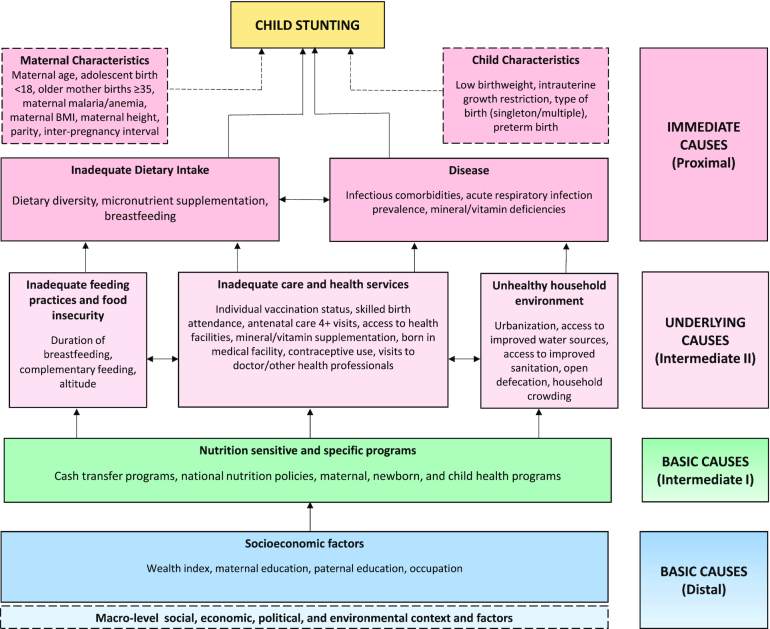
Results: Among the basic determinants of stunting assessed within regression-decomposition analyses, improvement in asset index score was a consistent and strong driver of improved linear growth outcomes. Increased parental education was also a strong predictor of improved child growth. Of the underlying determinants of stunting, reduced rates of open defecation, improved sanitation infrastructure, and improved access to key maternal health services, including optimal antenatal care and delivery in a health facility or with a skilled birth attendant, all accounted for substantially improved child growth, although the magnitude of variation explained by each differed substantially between countries. At the immediate level, changes in several maternal characteristics predicted modest stunting reductions, including parity, interpregnancy interval, and maternal height.
Conclusions: Unique sets of stunting determinants predicted stunting reduction within countries that have reduced stunting. Several common drivers emerge at the basic, underlying, and immediate levels, including improvements in maternal and paternal education, household socioeconomic status, sanitation conditions, maternal health services access, and family planning. Further data collection and in-depth mixed-methods research are required to strengthen recommendations for those countries where the stunting burden remains unacceptably high.
Keywords: child; height; infant; length; linear growth; nutrition; stunting.
Copyright © The Author(s) on behalf of the American Society for Nutrition 2020.
Figures
References
-
- Black RE, Victora CG, Walker SP, Bhutta ZA, Christian P, De Onis M, Ezzati M, Grantham-McGregor S, Katz J, Martorell R. Maternal and child undernutrition and overweight in low-income and middle-income countries. Lancet North Am Ed. 2013;382(9890):427–51. - PubMed
-
- Sudfeld CR, Charles McCoy D, Danaei G, Fink G, Ezzati M, Andrews KG, Fawzi WW. Linear growth and child development in low- and middle-income countries: a meta-analysis. Pediatrics. 2015;135(5):e1266–e75. - PubMed
-
- Perumal N, Bassani DG, Roth DE. Use and misuse of stunting as a measure of child health. J Nutr. 2018;148(3):311–15. - PubMed
