Drivers of stunting reduction in Peru: a country case study
- PMID: 32860403
- PMCID: PMC7487430
- DOI: 10.1093/ajcn/nqaa164
Drivers of stunting reduction in Peru: a country case study
Erratum in
-
Corrigendum to: Drivers of stunting reduction in Peru: a country case study. Am J Clin Nutr 2020;112:816S-829S.Am J Clin Nutr. 2021 Jan 4;113(1):246. doi: 10.1093/ajcn/nqaa356. Am J Clin Nutr. 2021. PMID: 36103384 Free PMC article. No abstract available.
Abstract
Background: Peru reduced its under-5 child stunting prevalence notably from 31.3% in 2000 to 13.1% in 2016.
Objectives: We aimed to study factors and key enablers of child stunting reduction in Peru from 2000-2016.
Methods: Demographic and Health Surveys were used to conduct descriptive analyses [height-for-age z scores (HAZ) means and distributions, equity analysis, predicted child growth curves through polynomial regressions] and advanced regression analyses. An ecological (at department level) multilevel regression analysis was conducted to identify the major predictors of stunting decline from 2000 to 2016, and Oaxaca-Blinder decomposition was conducted to identify the relative contribution of each factor to child HAZ change. A systematic literature review, policy and program analysis, and interviews with relevant stakeholders were conducted to understand key drivers of stunting decline in Peru.
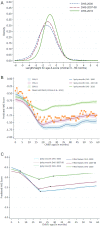
Results: The distribution of HAZ scores showed a slight rightward shift from 2000 to 2007/2008, and a greater shift from 2007/2008 to 2016. Stunting reduction was higher in the lowest wealth quintile, in rural areas, and among children with the least educated mothers. Decomposing predicted changes showed that the most important factors were increased maternal BMI and maternal height, improved maternal and newborn health care, increased parental education, migration to urban areas, and reduced fertility. Key drivers included the advocacy role of civil society and political leadership around poverty and stunting reduction since the early 2000s. Key enablers included the economic growth and the consolidation of democracy since the early 2000s, and the acknowledgement that stunting reduction needs much more than food supplementation.
Conclusions: Peru reduced child stunting owing to improved socioeconomic determinants, sustained implementation of out-of-health-sector and within-health-sector changes, and implementation of health interventions. These efforts were driven through a multisectoral approach, strong civil society advocacy, and keen political leadership. Peru's experience offers useful lessons on how to tackle the problem of stunting under differing scenarios, with the participation of multiple sectors.
Keywords: Latin America; Peru; children; exemplar; linear growth; mixed methods; nutrition; stunting.
Copyright © The Author(s) on behalf of the American Society for Nutrition 2020.
Figures


References
-
- UN General Assembly. United Nations Millennium Declaration. A/RES/55/2. New York: UN; 2000.
-
- Joint Malnutrition Estimates. UNICEF/WHO/World Bank joint child malnutrition estimates:stunting (national and disaggregated) [Internet] New York: UNICEF; 2018. Available from: https://data.unicef.org/topic/nutrition/malnutrition/.
-
- Joint Malnutrition Estimates. UNICEF/WHO/World Bank joint child malnutrition estimates:stunting (national and disaggregated). New York: UNICEF; 2019.
-
- Instituto Nacional de Estadística e Informática, Perú. La Autoidentificación Étnica: Población Indígena y Afroperuana. Censos Nacionales 2017. [Cited November 23, 2019.] [Internet]. Lima, Peru: Ministerio de Cultura, INEI; Available from: https://www.inei.gob.pe/media/MenuRecursivo/publicaciones_digitales/Est/....
Publication types
MeSH terms
LinkOut - more resources
Full Text Sources
Medical

