. 2020 Dec 7;217(12):e20190354.
doi: 10.1084/jem.20190354.

Interleukin-17-induced neutrophil extracellular traps mediate resistance to checkpoint blockade in pancreatic cancer

Affiliations

Interleukin-17-induced neutrophil extracellular traps mediate resistance to checkpoint blockade in pancreatic cancer

Yu Zhang et al. J Exp Med. .

Abstract

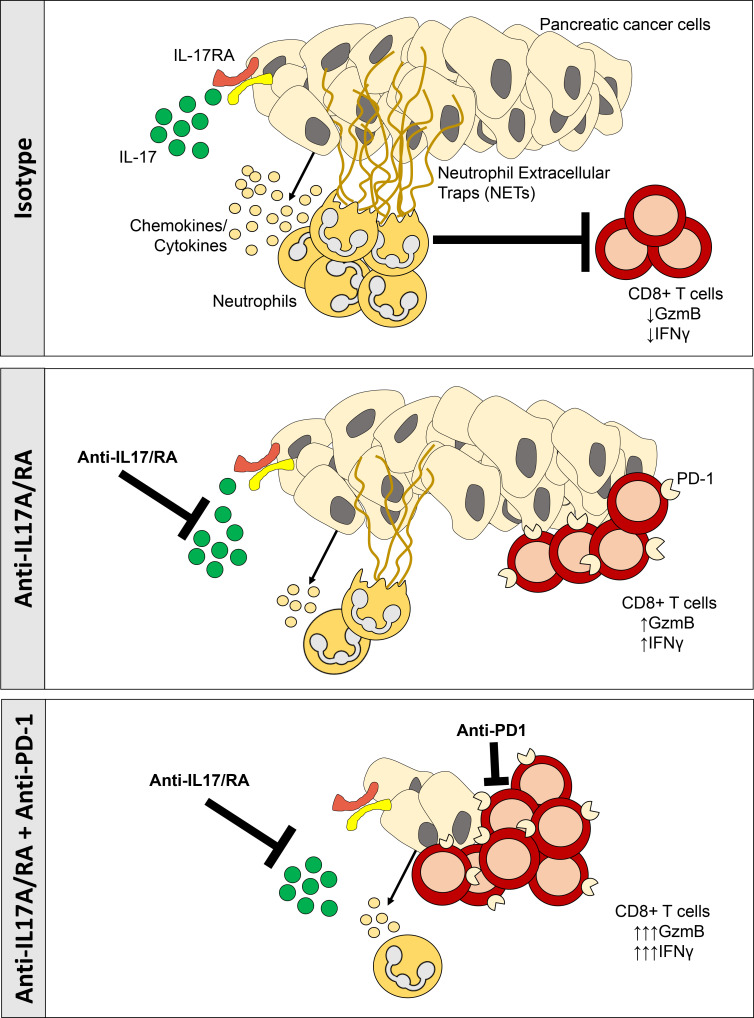
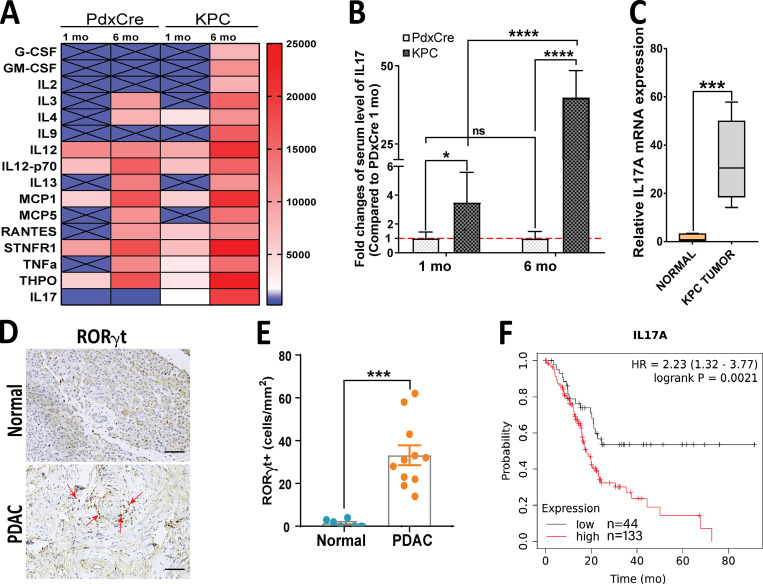
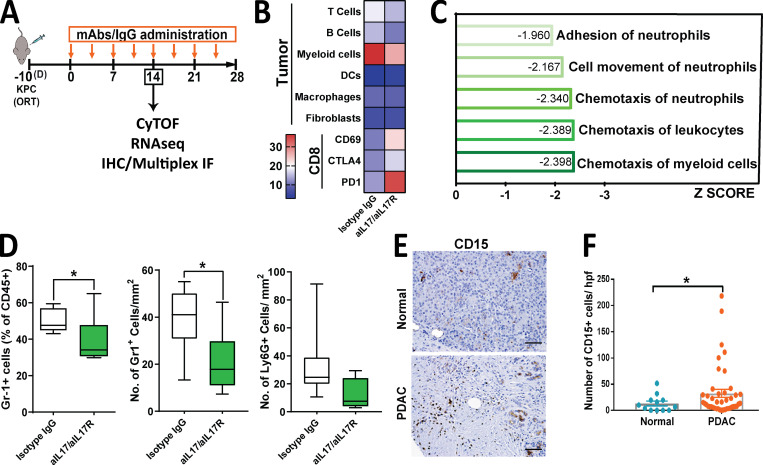
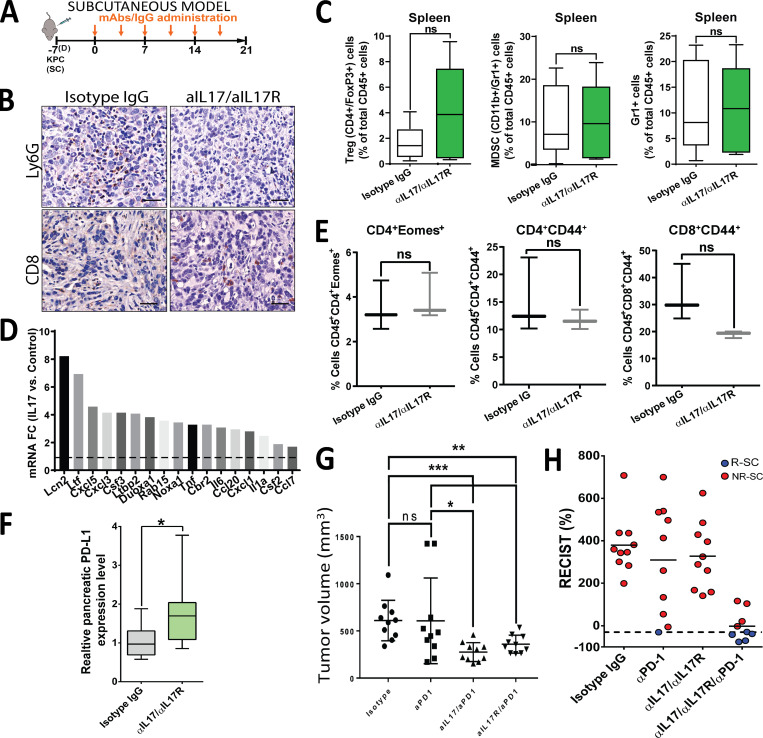
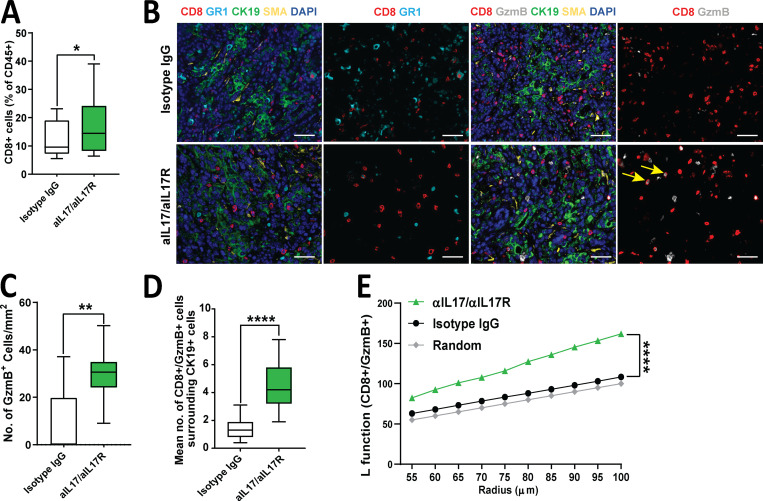
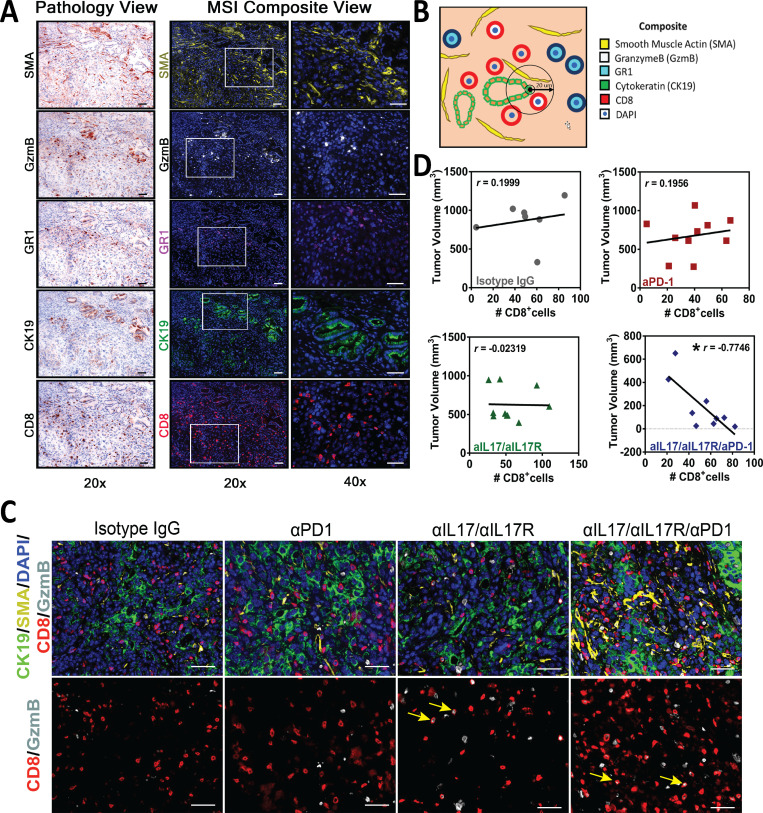
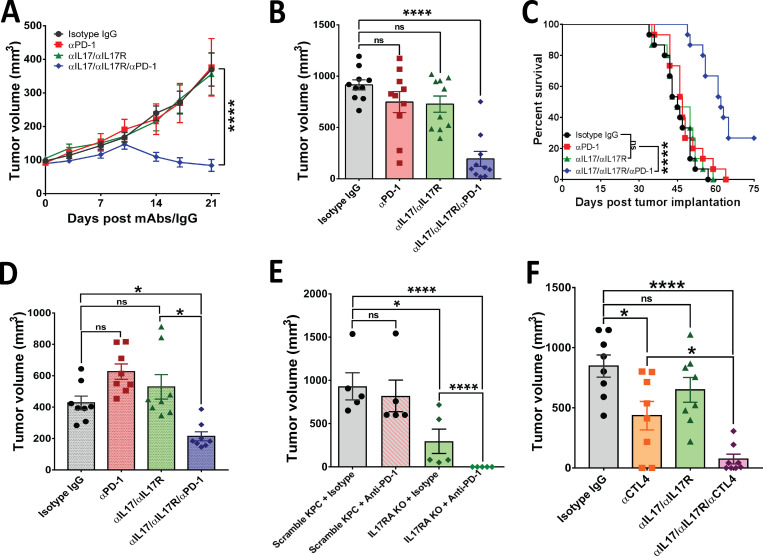
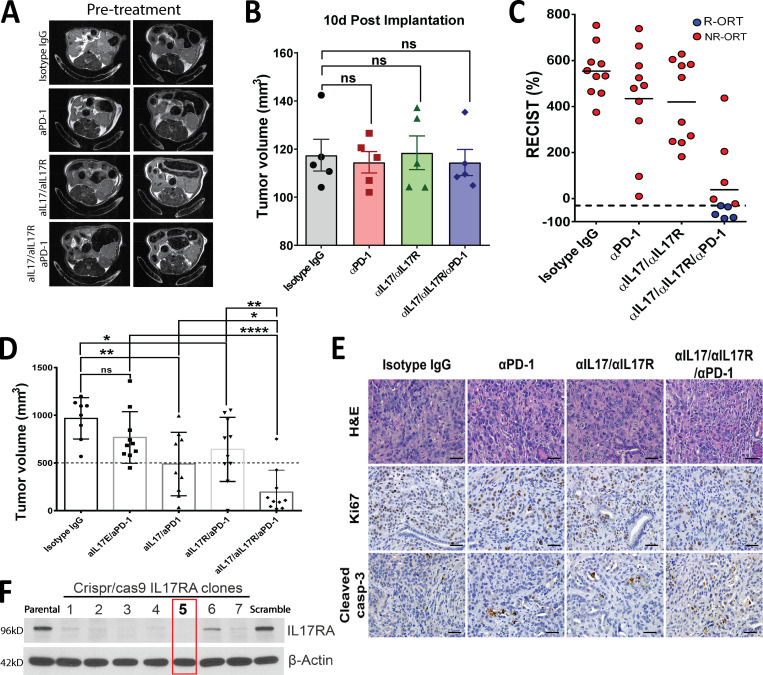
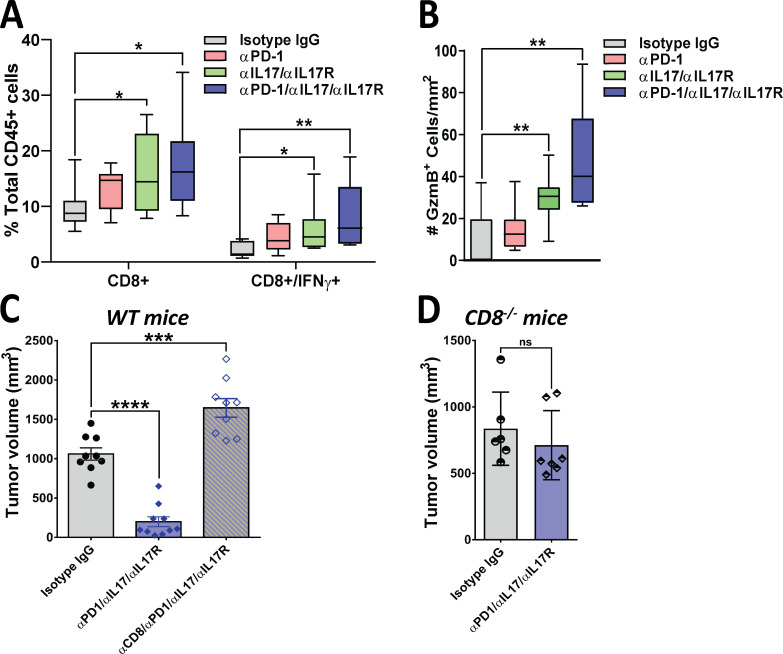
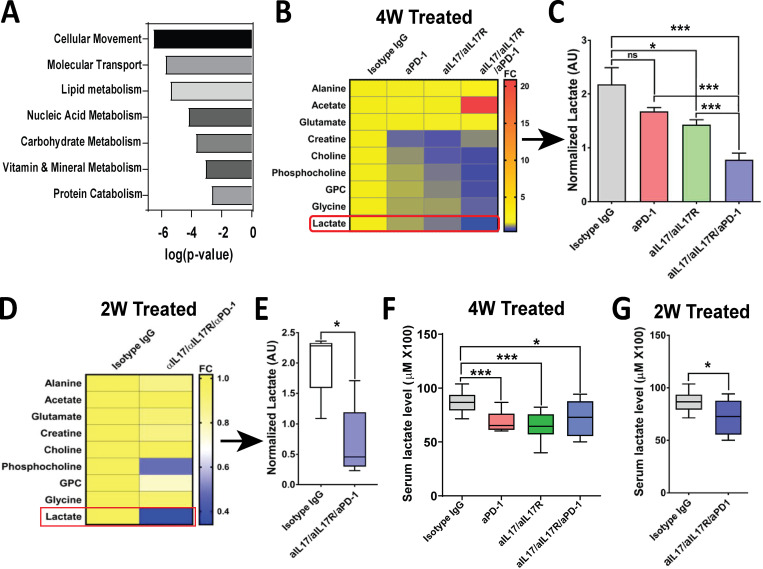
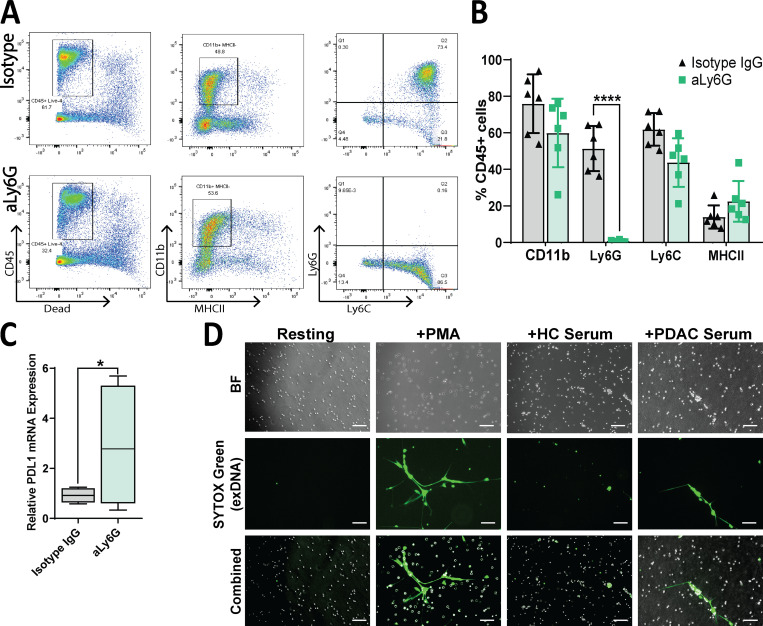
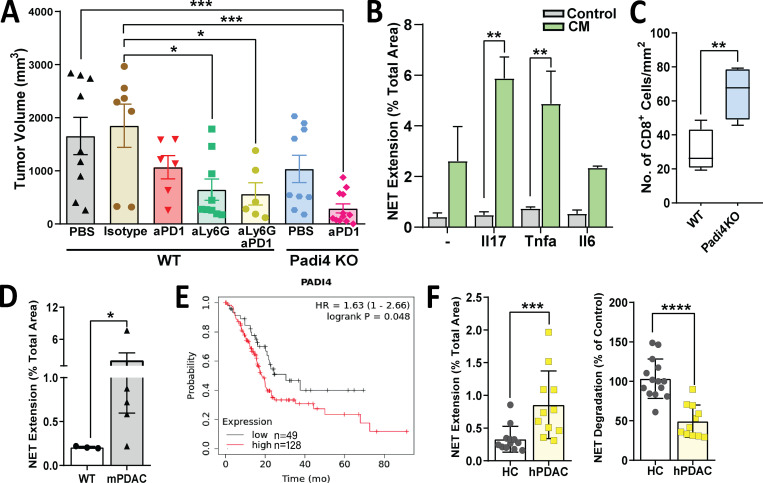
Pancreatic ductal adenocarcinoma (PDAC) remains a lethal malignancy with an immunosuppressive microenvironment that is resistant to most therapies. IL17 is involved in pancreatic tumorigenesis, but its role in invasive PDAC is undetermined. We hypothesized that IL17 triggers and sustains PDAC immunosuppression. We inhibited IL17/IL17RA signaling using pharmacological and genetic strategies alongside mass cytometry and multiplex immunofluorescence techniques. We uncovered that IL17 recruits neutrophils, triggers neutrophil extracellular traps (NETs), and excludes cytotoxic CD8 T cells from tumors. Additionally, IL17 blockade increases immune checkpoint blockade (PD-1, CTLA4) sensitivity. Inhibition of neutrophils or Padi4-dependent NETosis phenocopies IL17 neutralization. NMR spectroscopy revealed changes in tumor lactate as a potential early biomarker for IL17/PD-1 combination efficacy. Higher expression of IL17 and PADI4 in human PDAC corresponds with poorer prognosis, and the serum of patients with PDAC has higher potential for NETosis. Clinical studies with IL17 and checkpoint blockade represent a novel combinatorial therapy with potential efficacy for this lethal disease.


Conflict of interest statement

Disclosure: Dr. Maitra reports Thrive Earlier Detection has licensed an invention from Johns Hopkins University in which Dr. Maitra is listed as an inventor. The focus of the license is on pancreatic cancer early detection. In addition, Dr. Maitra receives royalties from Cosmos Wisdom Biotechnology Ltd on an invention related to pancreatic cancer early detection, licensed from MD Anderson Cancer Center. Dr. Banerjee is a paid consultant with Minneamrita Therapeutics; this is managed by the University of Miami. No other disclosures were reported.

Figures

None
Graphical abstract
Figure 1.
Figure 1.
IL17-secreting cells are increased in murine and human pancreatic adenocarcinoma carcinoma. (A) Heat map representing serum levels of cytokines from a spontaneous pancreatic adenocarcinoma mouse model (KPC) and control mice (Pdx1-Cre) at 1 mo and 6 mo of age. (B) Serum IL17 levels measured by Luminex assay in Pdx-Cre and KPC mice at 1 mo and 6 mo of age. Results show the mean ± SD of fold changes from KPC over Pdx-Cre (n = 5). (C) Relative IL17 mRNA expression measured by quantitative RT-PCR in normal pancreatic tissue and tumor tissue formed from KPC cells orthotopically implanted into syngeneic mice. Results show the mean ± SD of fold changes from KPC tumors over normal pancreas (n = 5). (D) Th17 cells in normal human pancreatic tissue and PDAC based on RORγt staining by IHC. Scale bars represent 50 µm. (E) Quantification of human RORγt+ cells on tissue from normal versus PDAC. (F) Kaplan-Meier survival curves comparing survival of patients with PDAC with low versus high levels of median IL17A expression. *, P < 0.05; ***, P < 0.001; ****, P < 0.0001.
Figure 2.
Figure 2.
IL17 recruits neutrophils to the pancreatic tumor microenvironment. (A) Experimental protocol for orthotopic implantation of KPC cells into syngeneic WT mice followed by treatment with anti-IL17 and anti-IL17R mAb (aIL17/aIL17R) versus control isotype IgG. CyTOF, RNA sequencing (RNAseq), IHC, and multiplex IF were performed at 14 d after treatment initiation. (B) Heat map showing distribution of tumor-infiltrating immune cells as identified by CyTOF analysis of tumors from A, represented as a percentage of total CD45+ cells (n = 5/group). DC, dendritic cell. (C) Ingenuity Pathway Analysis showing the top five cellular functions predicted using genes significantly downregulated in tumors from A. As indicated on the x axis, biological functions with P < 0.05 are sorted based on Z scores. (D) Quantification of Gr1+ cells measured in tumors from A by flow cytometry (left panel) or IHC (middle panel) and Ly6G+ cells measured by IHC (right panel). Results are expressed as the relative percentage of total gated CD45+ cells for flow cytometry and total number of cells/mm2 for IHC. (E) Representative images of neutrophils infiltrating human PDAC tissue versus normal adjacent tissue by CD15 staining performed by IHC. Scale bars represent 50 µm. (F) Quantification of CD15 staining in E. Results are expressed as the number of CD15+ cells per high-power field (hpf). *, P < 0.05.
Figure S1.
Figure S1.
Immunological effects of IL17 blockade and antitumoral effects of combination with PD-1 blockade in subcutaneous tumors. (A) Experimental protocol for subcutaneous implantation of KPC cells into syngeneic mice. Cells were treated with isotype IgG, aPD-1, aIL17/aIL17R, or aIL17/aIL17R/aPD-1 antibodies. (B) Representative IHC staining for Ly6G and CD8+ cells in tumors from A. Scale bars represent 100 µm. (C) Flow cytometric analysis showing CD45+/CD4+/FoxP3+ (left), CD45+/CD11b+/Gr1+ (middle), and CD45+/Gr1+ (right) cells in spleens from mice implanted with orthotopic KPC tumors. (D) mRNA upregulation fold change (FC) of neutrophil-related genes in KPC cells upregulated by ≥1.5-fold after in vitro stimulation with IL17 for 7 d, as identified by RNA sequencing. All genes were statistically significantly upregulated. (E) Exhaustion markers CD4+/Eomes+ (left), CD4+CD44+ (middle), and CD8+/CD44+ (right) detected by flow cytometry on orthotopic tumors. (F) Quantitative RT-PCR analysis of PD-L1 gene relative expression in orthotopic tumors (n = 10 mice/group). (G) Subcutaneous tumor volumes at endpoint in A. (H) RECIST analysis of subcutaneously implanted KPC tumors from A. R, responders; NR, nonresponders. *, P < 0.05; **, P < 0.01; ***, P < 0.001.
Figure 3.
Figure 3.
IL17 signaling modulates the pancreatic tumor microenvironment. (A) Quantification of CD8+ cells by flow cytometry measured in tumors from Fig. 2 A treated with isotype IgG or aIL17/aIL17R antibodies. Results are expressed as the relative percentage of total gated CD45+ cells. (B) Representative pictures of multiplex IF staining showing CD8, Gr1, GzmB, CK19, SMA, and DAPI staining in tumor tissues from Fig. 2 A. Scale bars represent 50 µm. Yellow arrows indicate double-positive cells for CD8 and GzmB staining. (C) Quantification of Gzmb+ cells measured in tumors shown in B by multiplex IF. Results are expressed as the total number of cells/mm2. (D) Spatial quantification of CD8+Gzmb+ cells surrounding CK19+ cells (within 40 µm) measured in tumors shown in B by multiplex IF. (E) Clustering of CD8+GzmB+ cells surrounding CK19+ cells represented as an L function measured in tumors in B. Random dispersion is denoted by the gray line. *, P < 0.05; **, P < 0.01; ****, P < 0.0001.
Figure S2.
Figure S2.
Multiplex immunofluorescence characterization of pancreatic tumor microenvironment. (A) Multiplex staining. Pathology view and multispectral image (MSIs) composite view for individual markers at 20× and 40× magnification. Scale bars represent 50 µm. (B) Diagram for visualization of spatial quantification. In this example, the number of CD8+/GzmB+ cells within 20-µm radius from CK19+ cells is quantified. (C) Representative pictures of multiplex IF staining showing CD8, GzmB, CK19, SMA, and DAPI (top panels) staining in orthotopic tumor tissues from Fig. 4 B. Bottom panels show only CD8/GzmB. Scale bars represent 50 µm. Yellow arrows indicate double-positive cells for CD8 and GzmB staining. (D) Correlation analysis between tumor volume and CD8+ T cell frequency in the four treatment arms in C.
Figure 4.
Figure 4.
Pharmacological and genetic blockade of IL17 signaling overcomes resistance to immune checkpoint inhibition. (A) Tumor growth curves for subcutaneously implanted KPC cells treated with anti-IL17/IL17R/PD-1 antibodies as described in Fig. S1 A (n = 10 mice/group). (B) Tumor volumes of orthotopically implanted KPC cells treated with anti-IL17/IL17R/PD-1 antibodies as described in Fig. 2 A (n = 10 mice/group). (C) Kaplan-Meier curves for syngeneic mice orthotopically implanted with KPC cells and treated with the indicated antibodies as described in Fig. 2 A (n = 10 mice/group). (D) Tumor volumes of orthotopically implanted mT3 cells treated with anti-IL17/IL17R/PD-1 antibodies as described in Fig. 2 A (n = 8 mice/group). (E) Tumor volumes of orthotopically implanted KPC cells (with genetic deletion of IL17R by CRISPR/Cas9 versus scramble control) into syngeneic mice in presence/absence of aPD-1 (n = 5 mice/group). (F) Tumor volumes of orthotopically implanted KPC cells into syngeneic mice treated with anti-IL17/CTLA4 antibodies as described in Fig. 2 A (n = 7 mice/group). *, P < 0.05; ****, P < 0.0001.
Figure S3.
Figure S3.
Antitumoral effect of combination of IL17 and PD-1 blockade in orthotopic tumors. (A) Axial abdominal MRI scans of mice in all groups before the start of treatment at 10 d after orthotopic tumor implantation. (B) Quantification of tumor volumes as measured by MRI in A. (C) RECIST analysis in mice with orthotopically implanted KPC tumors in Fig. 4 B. R, responders; NR, nonresponders. (D) Tumor volumes of KPC tumors orthotopically implanted into syngeneic hosts and treated with isotype, aIL17E/aPD-1, aIL17/aPD-1, aIL17RA/aPD-1, and aIL17R/aIL17R/aPD-1. (E) Representative pictures of H&E and IHC staining for Ki67 and cleaved caspase 3 on tumor tissues from KPC cells orthotopically implanted in Fig. 4 B. Scale bars represent 100 µm. (F) Immunoblotting for IL17RA on CRISPR/Cas9 IL17RA-KO KPC cell clones. β-actin was used as a loading control. Parental KPC cells and scramble negative control cells are also included. *, P < 0.05; **, P < 0.01; ****, P < 0.0001.
Figure 5.
Figure 5.
The antitumoral effect of combinatorial IL17 and PD-1 blockade is CD8+ T cell dependent. (A) Flow cytometry–based analysis of tumor-infiltrating CD8+ and CD8+IFNγ+ cells. Tumors were obtained from syngeneic mice orthotopically implanted with KPC cells and treated with isotype IgG, aPD-1, aIL17/aIL17R, or aIL17/aIL17R/aPD-1 antibodies (n = 10 mice/group). Results are expressed as the percentage of total CD45+ gated viable cells. (B) IHC-based quantification of tumor-infiltrating cells expressing granzyme B (GzmB+) in tumors from A. Results are expressed as the total number of cells/mm2. (C) Tumor volumes of orthotopically implanted KPC cells into WT syngeneic mice treated with isotype IgG, anti-IL17/IL17R/PD-1, or anti-CD8 antibodies (aCD8; n = 10). (D) Tumor volumes of orthotopically implanted KPC cells into CD8-deficient (CD8−/−) syngeneic mice treated with isotype IgG or anti-IL17/IL17R/PD-1 antibodies (n = 6–7 mice/group). *, P < 0.05; **, P < 0.01; ***, P < 0.001; ****, P < 0.0001; ns, not significant.
Figure S4.
Figure S4.
Tumor metabolic changes with combination of IL17 and PD-1 blockade. (A) Ingenuity Pathway Analysis (IPA) showing top molecular and cellular functions predicted using genes significantly regulated in murine orthotopic KPC tumors treated with neutralizing aIL17/aIL17R/aPD-1 antibodies versus isotype IgG control (n = 10). X axis indicates biological functions with P < 0.05. (B) Heat map representing normalized metabolites in murine orthotopic KPC tumors treated with isotype IgG, aPD-1, aIL17/aIL17R, and aIL17/aIL17R/aPD-1 antibodies for 4 wk (n = 10). GPC, glycerophosphocholine. (C) Quantification of normalized lactate levels measured by NMR spectroscopy in B. (D) Heat map representing normalized metabolites in murine orthotopic KPC tumors treated with isotype IgG and aIL17/aIL17R/aPD-1 antibodies for 2 wk (n = 10). (E) Quantification of normalized lactate levels measured by NMR spectroscopy in D. (F) Serum lactate levels in mice from B. (G) Serum lactate levels in mice from D. *, P < 0.05; ***, P < 0.001.
Figure S5.
Figure S5.
Neutrophil depletion and NETosis imaging with human samples. (A) Representative plots depicting flow cytometric analysis of orthotopic tumors treated with isotype IgG or aLy6G antibodies. (B) Quantification of indicated markers as gated in A, as a percentage of viable CD45+ cells. (C) Quantitative RT-PCR analysis of relative PD-L1 mRNA expression in orthotopic tumors treated with isotype IgG or aLy6G antibodies (n = 5 per group). (D) Representative images of human neutrophils stimulated with PMA or serum of healthy control subjects (HC) or patients with PDAC. Green = extracellular (ex) DNA, as stained by SYTOX Green. Scale bars represent 100 µm. *, P < 0.05; ****, P < 0.0001. BF, bright field.
Figure 6.
Figure 6.
Tumor-promoting role of neutrophils and NETs during pancreatic cancer. (A) Tumor volume of orthotopic KPC tumors in syngeneic WT mice treated with PBS, isotype IgG, anti–PD-1, anti-Ly6G, or anti-Ly6G/anti–PD-1 or in PADi4-KO mice treated with PBS and anti–PD-1 according to the experimental protocol in Fig. 2 A. (B) NET extension of murine neutrophils upon direct stimulation with cytokines (Il17, Tnfα, Il6; control) or with CM from KPC cells stimulated in vitro with the indicated cytokines. NET extension is measured as the percentage of SYTOX Green staining of the total area. The experiment was performed in duplicates for n = 3. (C) Quantification of CD8+ cells measured in WT and Padi4-KO tumors from A by IHC. Results are expressed as the total number of cells/mm2. (D) NET formation of control WT murine neutrophils upon treatment with WT or murine PDAC (KPC) serum. (E) Kaplan-Meier survival curves comparing overall survival of patients with PDAC with low versus high levels of median PADI4 expression. (F) NET formation (left) and NET degradation (right) of control human neutrophils upon treatment with serum of healthy control subjects (HC) or patients with PDAC. *, P < 0.05; **, P < 0.01; ***, P < 0.001; ****, P < 0.0001.

References

    1. Balachandran, V.P., Beatty G.L., and Dougan S.K.. 2019. Broadening the impact of immunotherapy to pancreatic cancer: Challenges and opportunities. Gastroenterology. 156:2056–2072. 10.1053/j.gastro.2018.12.038 - DOI - PMC - PubMed
    1. Barnes, B.J., Adrover J.M., Baxter-Stoltzfus A., Borczuk A., Cools-Lartigue J., Crawford J.M., Daßler-Plenker J., Guerci P., Huynh C., Knight J.S., et al. . 2020. Targeting potential drivers of COVID-19: Neutrophil extracellular traps. J. Exp. Med. 217. e20200652. 10.1084/jem.20200652 - DOI - PMC - PubMed
    1. Bayne, L.J., Beatty G.L., Jhala N., Clark C.E., Rhim A.D., Stanger B.Z., and Vonderheide R.H.. 2012. Tumor-derived granulocyte-macrophage colony-stimulating factor regulates myeloid inflammation and T cell immunity in pancreatic cancer. Cancer Cell. 21:822–835. 10.1016/j.ccr.2012.04.025 - DOI - PMC - PubMed
    1. Beauvillain, C., Delneste Y., Scotet M., Peres A., Gascan H., Guermonprez P., Barnaba V., and Jeannin P.. 2007. Neutrophils efficiently cross-prime naive T cells in vivo. Blood. 110:2965–2973. 10.1182/blood-2006-12-063826 - DOI - PubMed
    1. Bennouna, S., Bliss S.K., Curiel T.J., and Denkers E.Y.. 2003. Cross-talk in the innate immune system: neutrophils instruct recruitment and activation of dendritic cells during microbial infection. J. Immunol. 171:6052–6058. 10.4049/jimmunol.171.11.6052 - DOI - PubMed

Publication types

MeSH terms