. 2020 Nov:90:235-247.
doi: 10.1016/j.bbi.2020.08.023. Epub 2020 Aug 27.

Peripherally-sourced myeloid antigen presenting cells increase with advanced aging

Affiliations

Peripherally-sourced myeloid antigen presenting cells increase with advanced aging

Pedram Honarpisheh et al. Brain Behav Immun. 2020 Nov.

Abstract

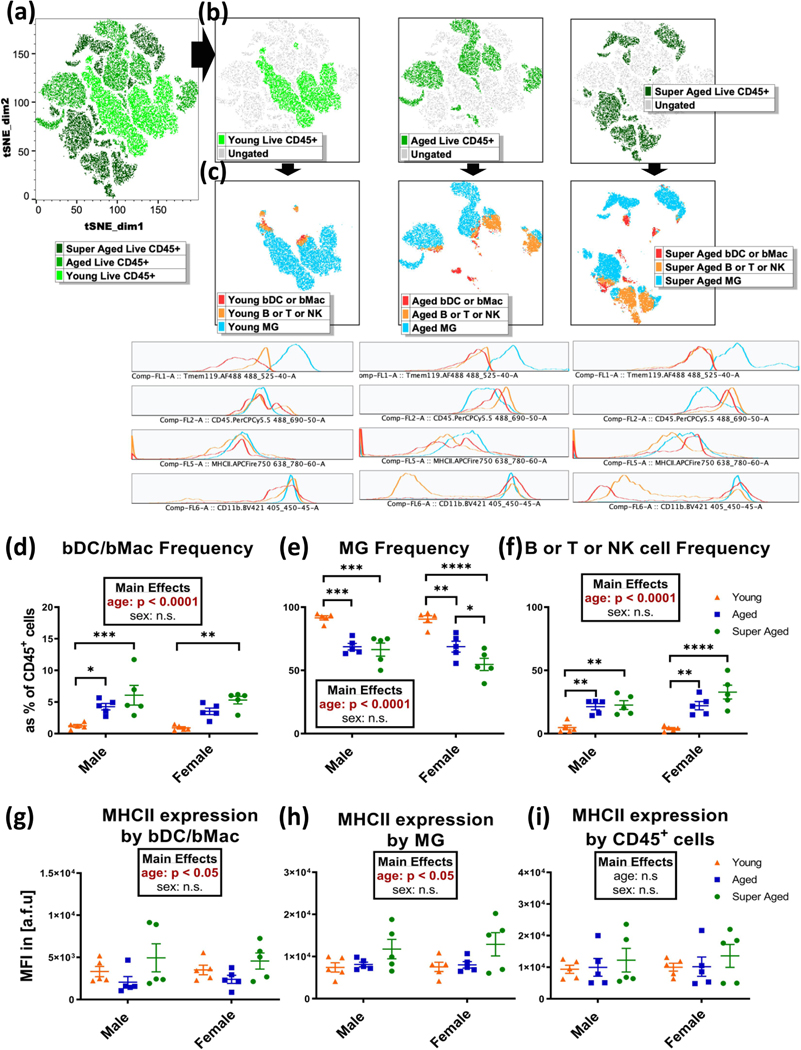
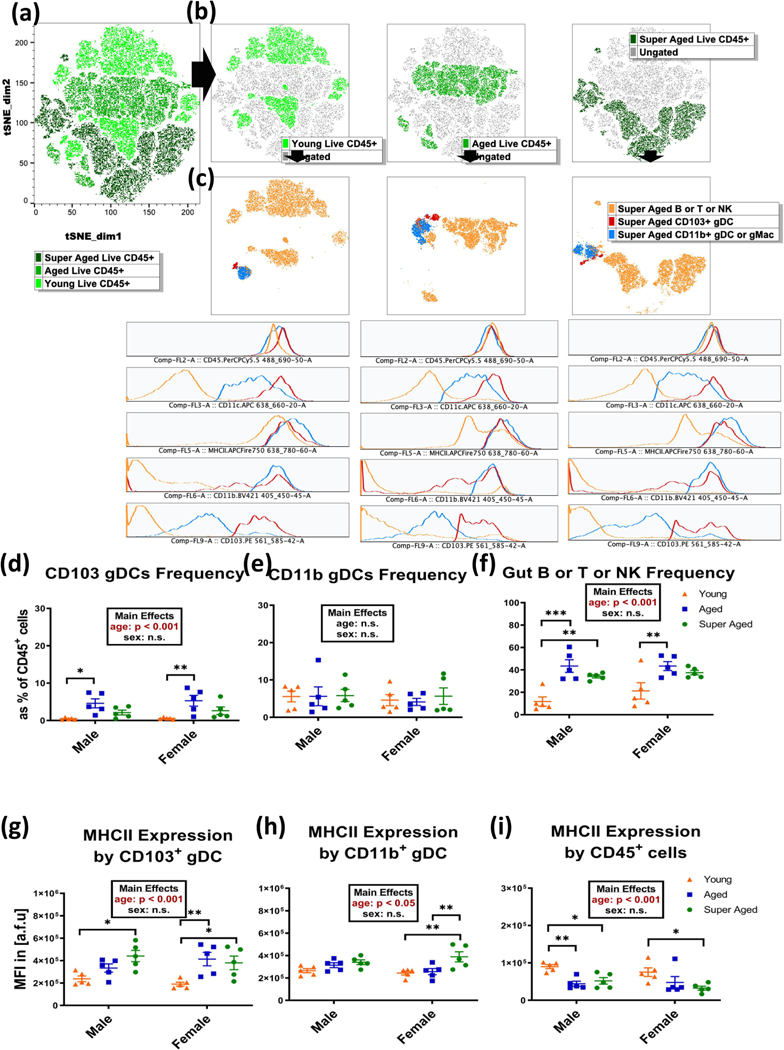
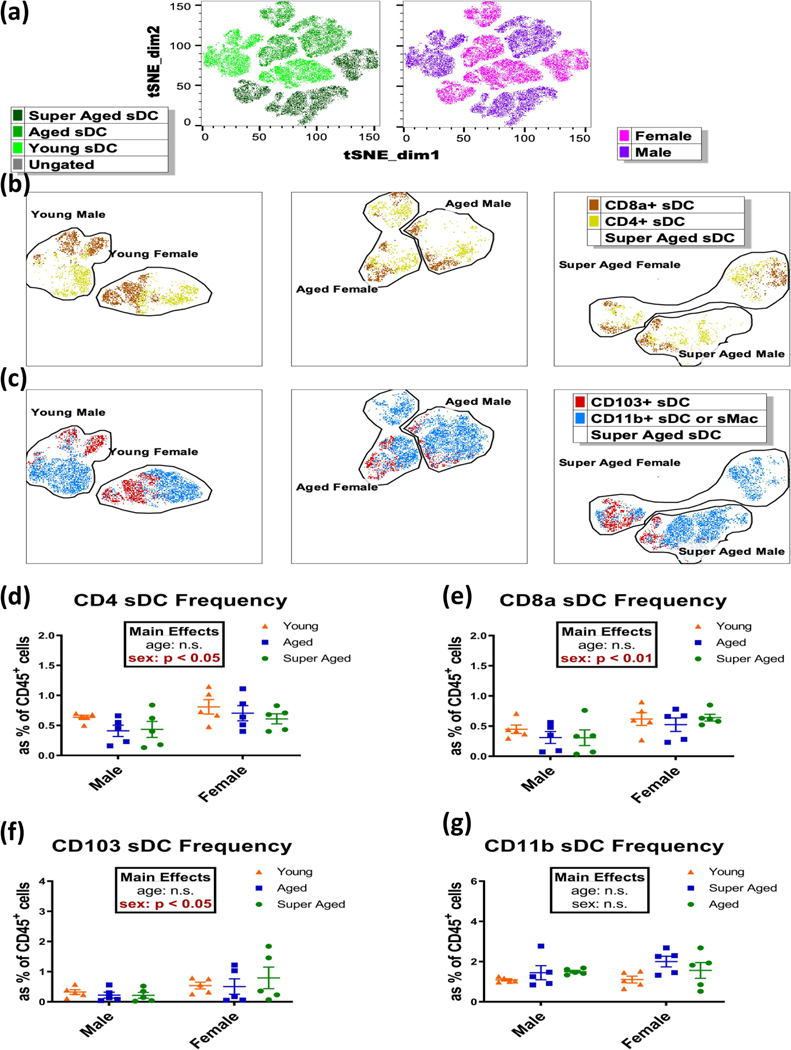
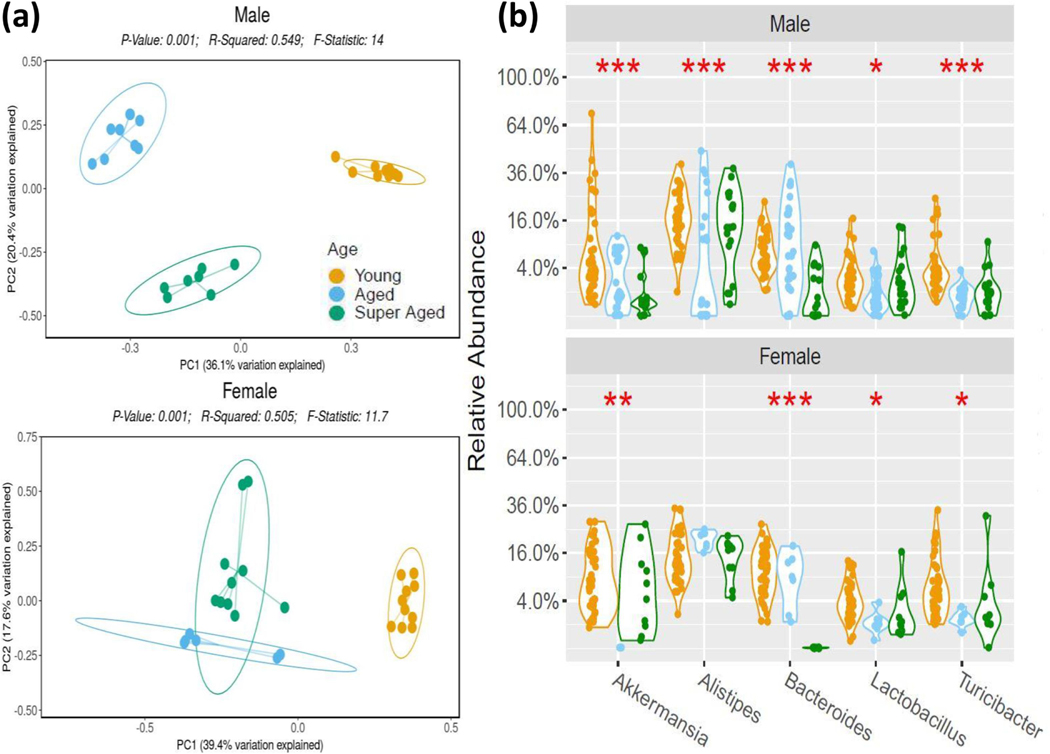
Aging is associated with dysfunction of the gut microbiota-immune-brain axis, a major regulatory axis in both brain health and in central nervous system (CNS) diseases. Antigen presenting cells (APCs) play a major role in sensing changes in the gut microbiota and regulation of innate and adaptive immune responses. APCs have also been implicated in various chronic inflammatory conditions, including age-related neurodegenerative diseases. The increase in chronic low-level inflammation seen with aging has also been linked to behavioral decline. Despite their acknowledged importance along the gut microbiota-immune-brain axis, there is limited evidence on how APCs change with aging. In this study, we examined age-related changes in myeloid APCs in the gut, spleen, and brain as well as changes in the gut microbiota and behavioral phenotype in mice ranging in age from 2 months up to 32 months of both sexes. Our data show that the number of peripherally-sourced myeloid APCs significantly increases with advanced aging in the brain. In addition, our data showed that age-related changes in APCs are subset-specific in the gut and sexually dimorphic in the spleen. Our work highlights the importance of studying myeloid APCs in an age-, tissue-, and sex-specific manner.

Keywords: Aging; Behavior; Dendritic cells; Gut microbiota-immune-brain axis; MHC-II; Myeloid cells; Sex differences.


Conflict of interest statement

Declaration of Competing Interest The authors declare that they have no known competing financial interests or personal relationships that could have appeared to influence the work reported in this paper.

Figures

Fig 1.
Fig 1.
Multi-dimensional analysis of brain flow cytometry data for young, aged, and super aged mice of both sexes gated on Live CD45+ parent populations. (a) Parent brain tSNE plot gated (color-coded) by age. (b) Live CD45+ populations in the brain separated into individual subplots by age. (c) Specific brain immune populations show increased frequency of bDC/bMac, identified as CD45+Tmem119(−)CD11c+MHC-II+Lin(−) (red) and B/T/NK, identified as CD45+Lin+ (orange) populations while decreased frequency of MG, identified as CD45+Tmem119+ (blue) with advancing age. Histogram representation of Tmem119, CD45, MHC-II, and CD11b surface expression levels for each brain immune population show that CD45 and MHC-II expressions increase with advancing age. (d, e, f) Relative frequency of brain immune populations show that number of peripherally sourced APCs (bDC/bMac) and B/T/NK cells increase with age while number of MG decreases with age. (g, h, i) MHC-II surface expression of brain immune population show that bDC/bMac and MG express higher levels of MHC-II with advancing age. Overall expression of MHCII by combined Live CD45+ cells remains unchanged with age. Abbreviations: bDC/bMac (brain dendritic cells/brain macrophages, MG (microglia), B/T/NK (pooled population of B, T, and NK cells). Lin marker was used to exclude B cells, T cells, and natural killer cells using CD19, CD3, and NK1.1 surface markers. Statistical analyses by 2-way ANOVA and post-hoc Sidak’s multiple comparison test. (n=5/gp, *p<0.05, **p<0.01, ***p<0.001, ****p<0.0001)
Fig 2.
Fig 2.
Multi-dimensional analysis of gut flow cytometry data for young, aged, and super aged mice of both sexes gated on Live CD45+ parent populations. (a) Parent gut tSNE plot gated (color-coded) by age. (b) Live CD45+ populations in the gut separated into individual plots by age. (c) Specific gut immune populations show increased frequency of CD103+ gDCs, identified as CD45+CD11c+MHC-II+ Lin(−)CD103+ (red) and B/T/NK cells identified as CD45+Lin+ (orange) populations increase with age. Histogram representation of CD45, CD11c, MHC-II, CD11b, and CD103 surface expression levels for each gut immune population. (d, e, f) Relative frequency of specific gut immune populations show that number of CD103+ gDCs and B/T/NK cells increase with age. (g, h) MHC-II surface expression of gut immune populations show that both CD103+ and CD11b+ gDC subsets express higher levels of MHC-II with aging. (i) The overall expression of MHC-II within the CD45+ parent population decreases with age. Abbreviations: gDC (gut dendritic cells) Lin marker was used to exclude B cells, T cells, and natural killer cells using CD19, CD3, and NK1.1 surface markers. Statistical analyses by 2-way ANOVA and post-hoc Sidak’s multiple comparison test. (n=5/gp, *p<0.05, **p<0.01, ***p<0.001, ****p<0.0001)
Fig 3.
Fig 3.
Multi-dimensional analysis of spleen flow cytometry data for young, aged, and super aged mice of both sexes gated on Live CD45+ parent populations. (a) Parent spleen tSNE plot gated (color-coded) by age and sex. (b, c) Live CD45+ populations in the spleen separated into individual subplots by age and sex as well as CD8a+, CD4+, CD103+, and CD11b+/sMac subsets of sDCs. Relative frequency analysis of these populations show that CD8a+, CD4+, and CD103+ sDC subsets exhibit sexual dimorphism with female spleen containing larger number of all three subsets when compared to males. Abbreviations: sDC (splenic dendritic cells), sMac (splenic macrophages), APC (antigen presenting cells) Lin marker was used to exclude B cells, T cells, and natural killer cells using CD19, CD3, and NK1.1 surface markers. Statistical analyses by 2-way ANOVA and post-hoc Sidak’s multiple comparison test. (n=5/gp, *p<0.05, **p<0.01, ***p<0.001, ****p<0.0001)
Fig 4.
Fig 4.
Significant differences in beta diversity between young, aged, and super aged gut microbiota exists in both sexes. (a) Principal coordinate analysis (PCoA) of between-sample diversity (beta) using Bray-Curtis distances shows robust clustering by age when comparing young, aged, and super aged for each sex. Unweighted and weighted PCoA plots included as supplementary material (Supplementary Figure 3, n=6–10/gp). (b) Genus-level relative abundance analysis of gut microbiota shows significant differences in Akkermansia, Bacteroidetes, Lactobacillus, and Turicibacter populations by age in both males and females. (n=6–10/gp)
Fig 5.
Fig 5.
Cognitive phenotype and measures of well-being in mice deteriorate with age and exhibits sexual dimorphism into the advanced age. (a) Nest building scores show that overall nest building activity of mice declines with age and females score higher than males. (b) Tail suspension immobility times show that overall depressive phenotype of mice increases with age and is sexually dimorphic in the super aged group. (c) Total distance travelled, mean velocity, movement duration, and time spent in the center of the arena from open filed test (OFT) decline with age and are sexually dimorphic in the super aged group with females exhibiting a more anxious phenotype. Statistical analyses by 2-way ANOVA and post-hoc Sidak’s multiple comparison test. (n=10–15/gp, *p<0.05, **p<0.01, ***p<0.001, ****p<0.0001)

Similar articles

Cited by

References

    1. Adhikaree J, Franks HA, Televantos C, Vaghela P, Kaur AP, Walker D, Schmitz M, Jackson AM, Patel PM, 2019. Impaired circulating myeloid CD1c+ dendritic cell function in human glioblastoma is restored by p38 inhibition - implications for the next generation of DC vaccines. Oncoimmunology 8, 1593803. 10.1080/2162402X.2019.1593803 - DOI - PMC - PubMed
    1. Agrawal A, Gupta S, 2011. Impact of aging on dendritic cell functions in humans. Ageing Res. Rev. 10, 336–45. 10.1016/j.arr.2010.06.004 - DOI - PMC - PubMed
    1. Agrawal A, Sridharan A, Prakash S, Agrawal H, 2012. Dendritic cells and aging: consequences for autoimmunity. Expert Rev. Clin. Immunol. 8, 73–80. 10.1586/eci.11.77 - DOI - PMC - PubMed
    1. Anandasabapathy N, Victora GD, Meredith M, Feder R, Dong B, Kluger C, Yao K, Dustin ML, Nussenzweig MC, Steinman RM, Liu K, 2011. Flt3L controls the development of radiosensitive dendritic cells in the meninges and choroid plexus of the steady-state mouse brain. J. Exp. Med. 208, 1695–705. 10.1084/jem.20102657 - DOI - PMC - PubMed
    1. Baruch K, Deczkowska A, David E, Castellano JM, Miller O, Kertser A, Berkutzki T, Barnett-Itzhaki Z, Bezalel D, Wyss-Coray T, Amit I, Schwartz M, 2014. Aging. Aging-induced type I interferon response at the choroid plexus negatively affects brain function. Science 346, 89–93. 10.1126/science.1252945 - DOI - PMC - PubMed

Publication types