. 2020 Dec:223:117301.
doi: 10.1016/j.neuroimage.2020.117301. Epub 2020 Aug 28.

A probabilistic atlas of locus coeruleus pathways to transentorhinal cortex for connectome imaging in Alzheimer's disease

Affiliations

A probabilistic atlas of locus coeruleus pathways to transentorhinal cortex for connectome imaging in Alzheimer's disease

Wei Sun et al. Neuroimage. 2020 Dec.

Abstract

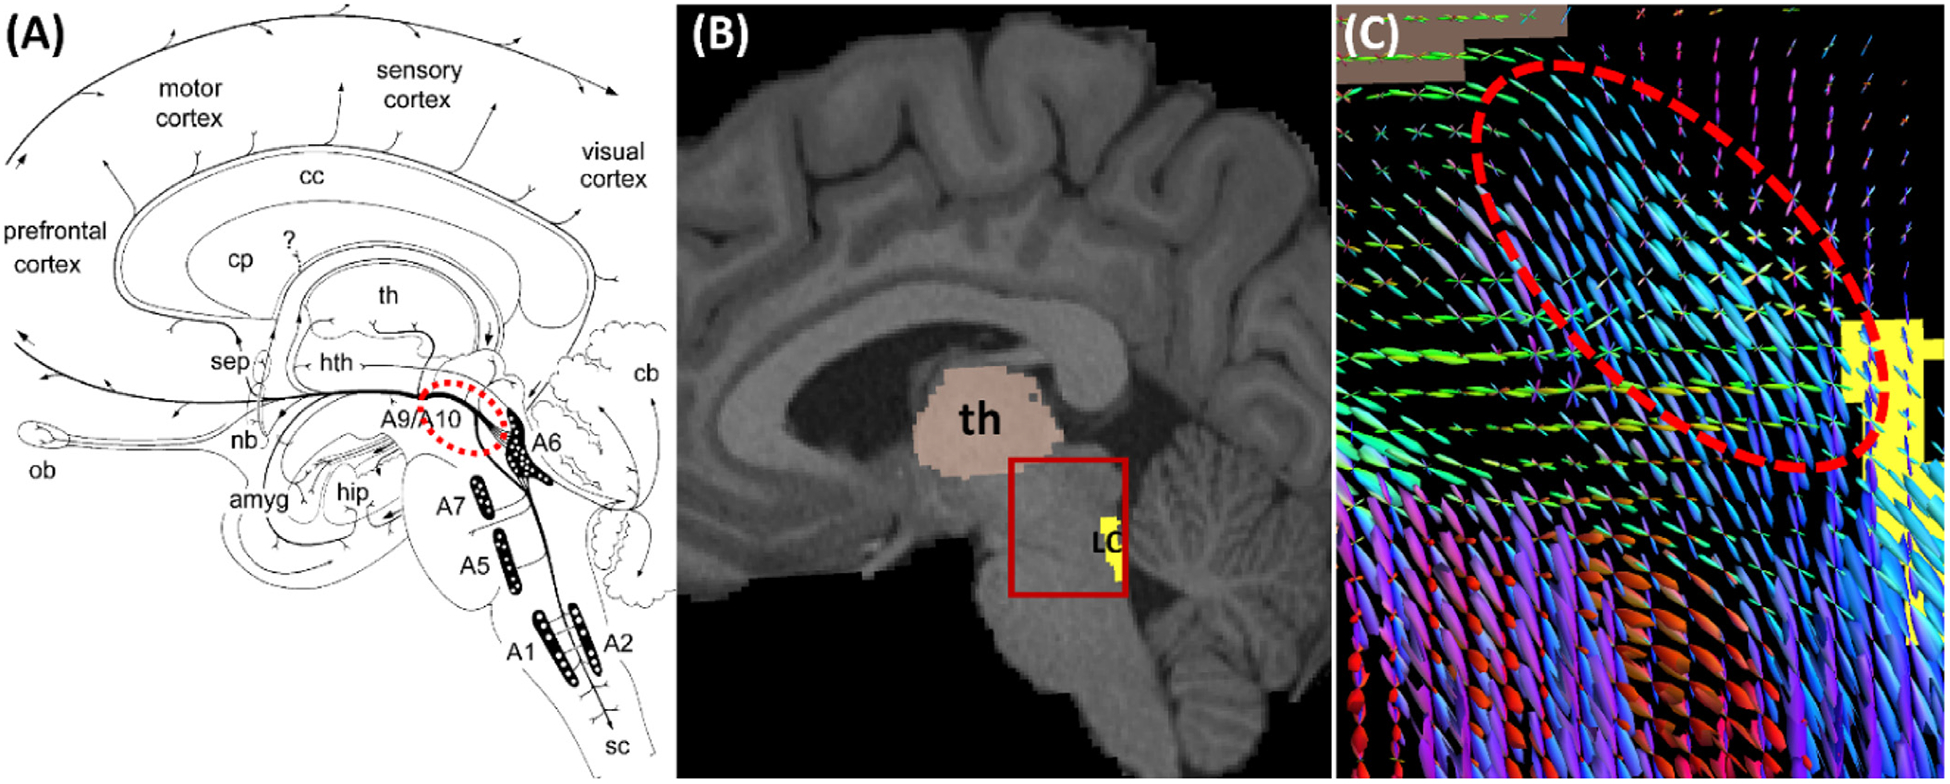
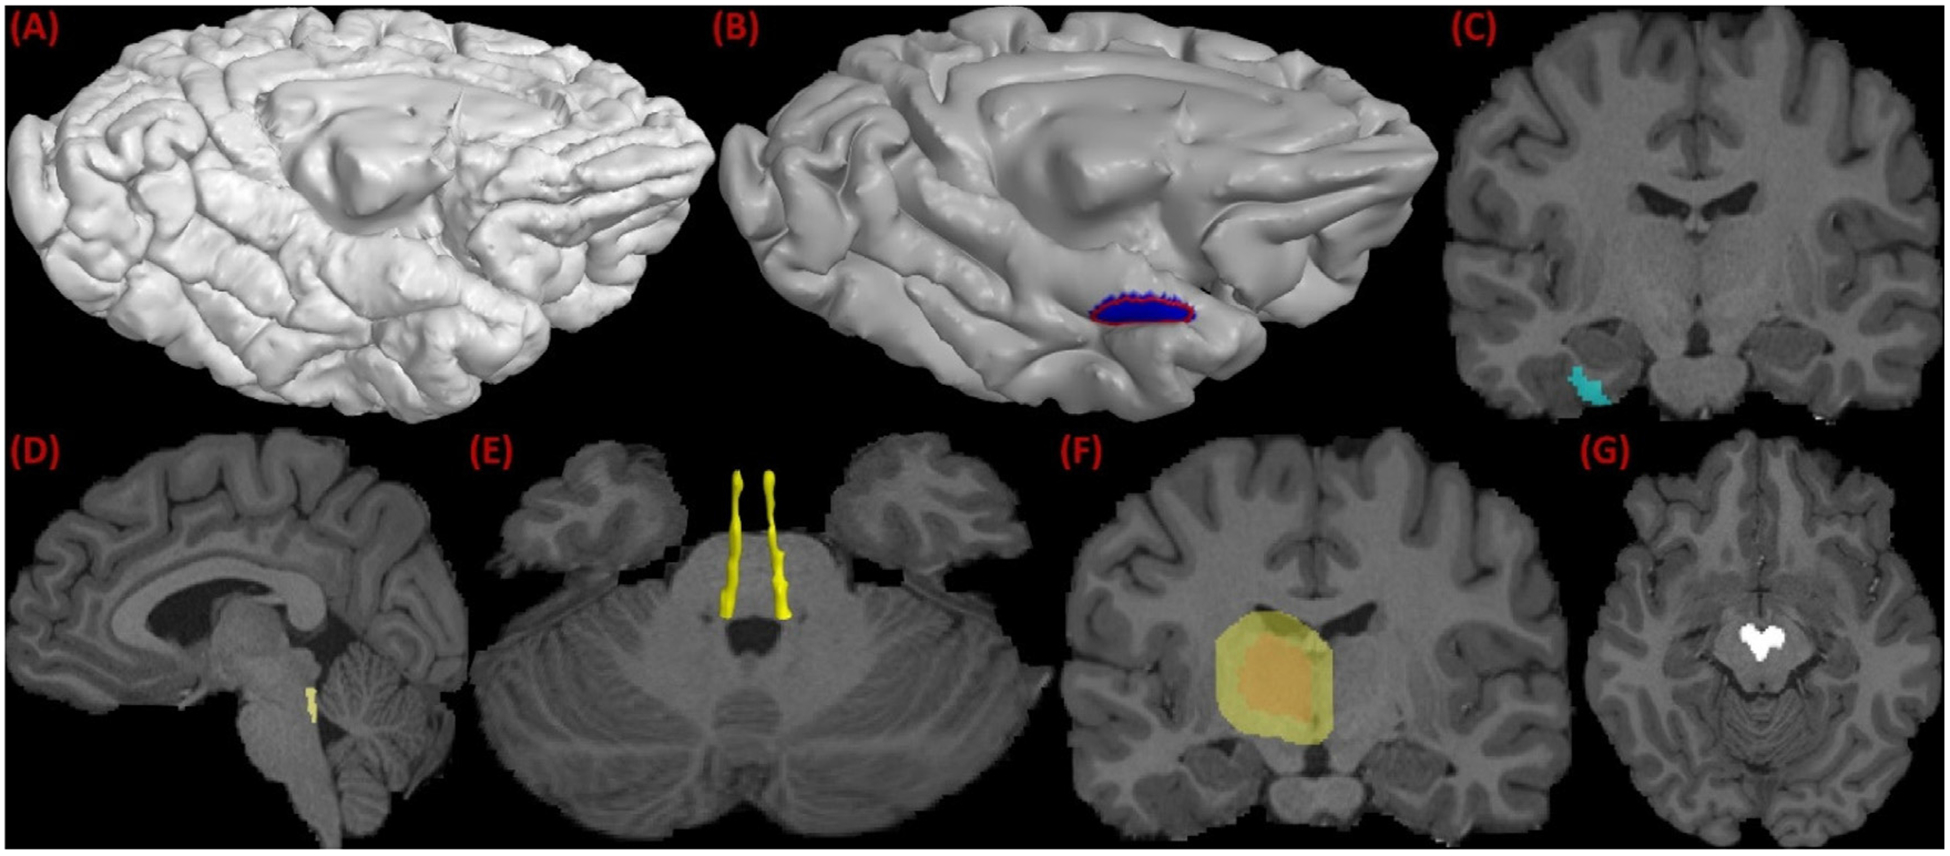
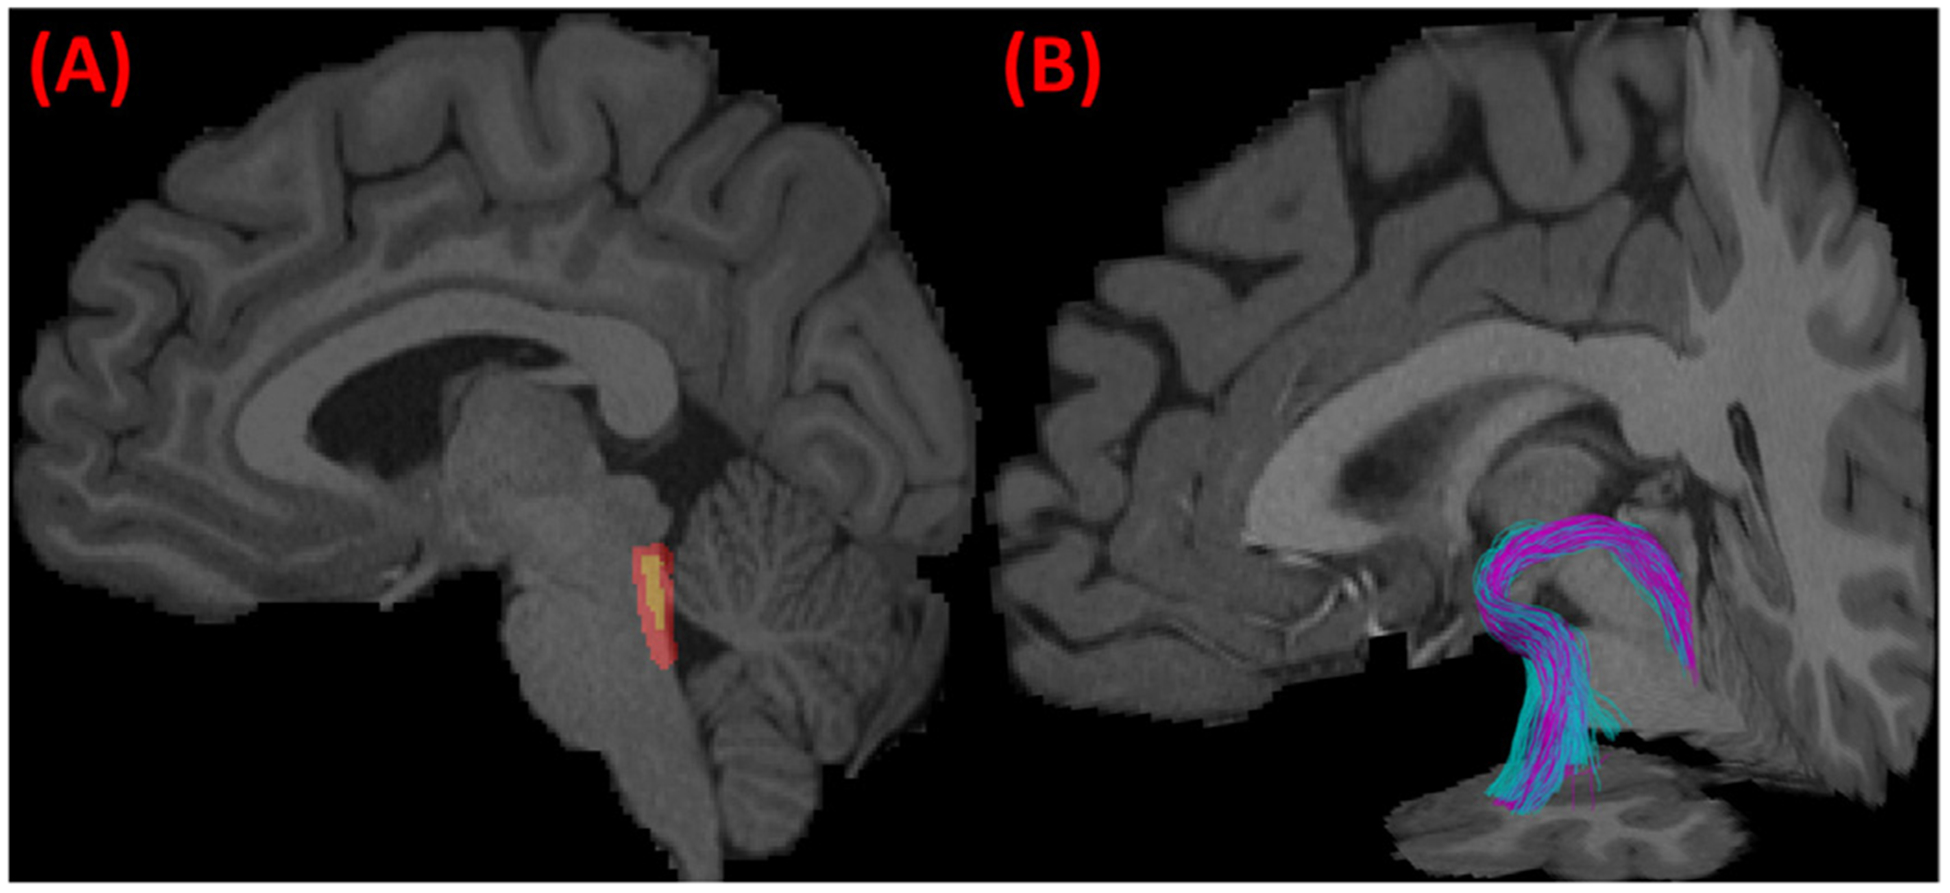
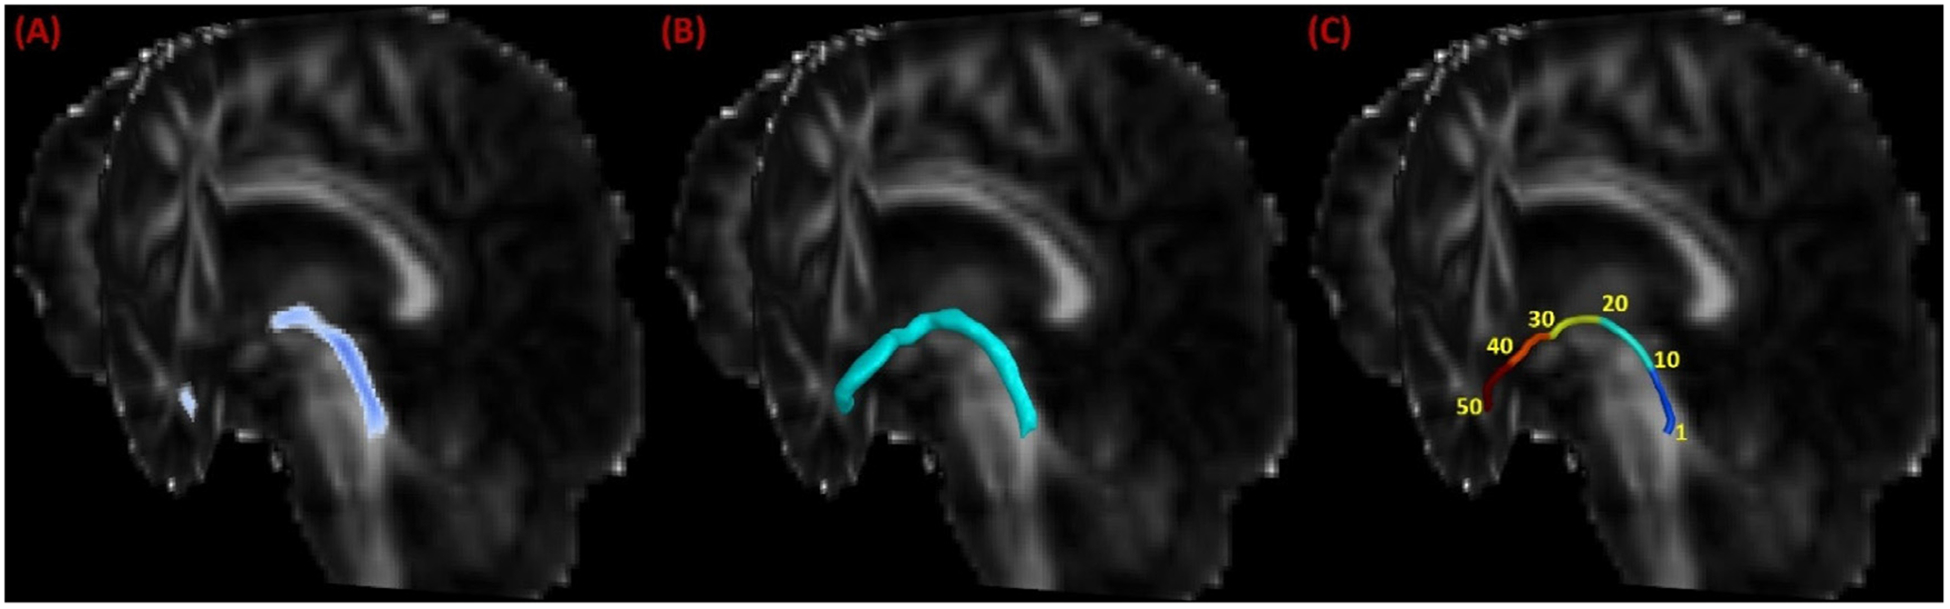
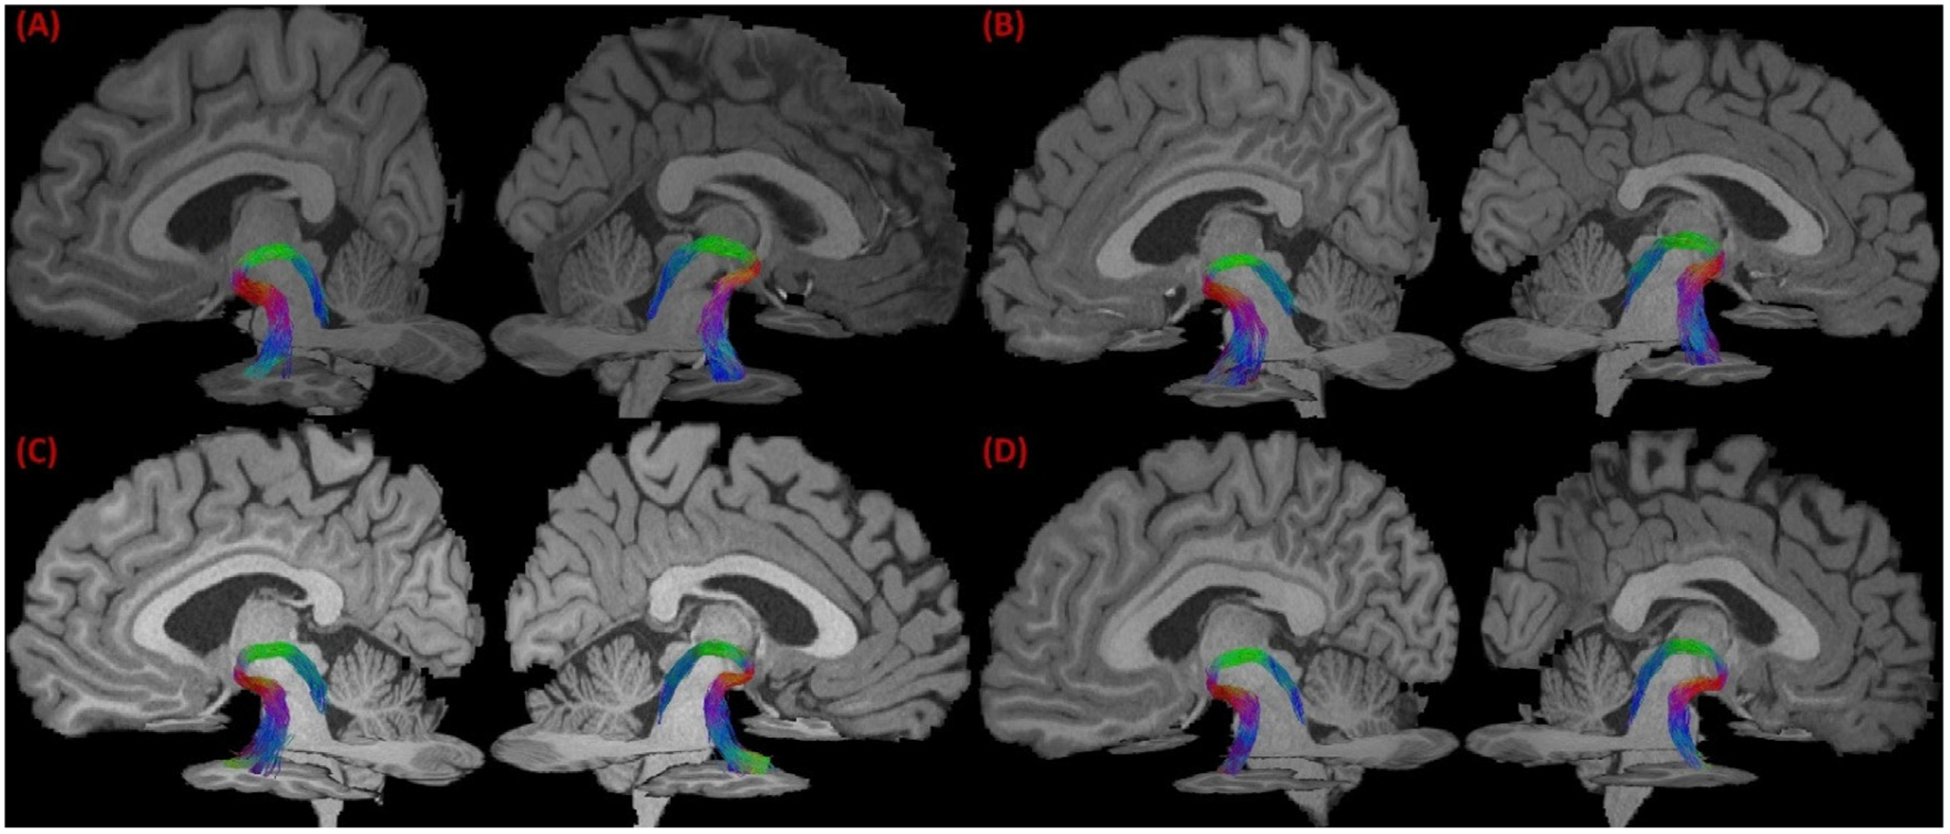
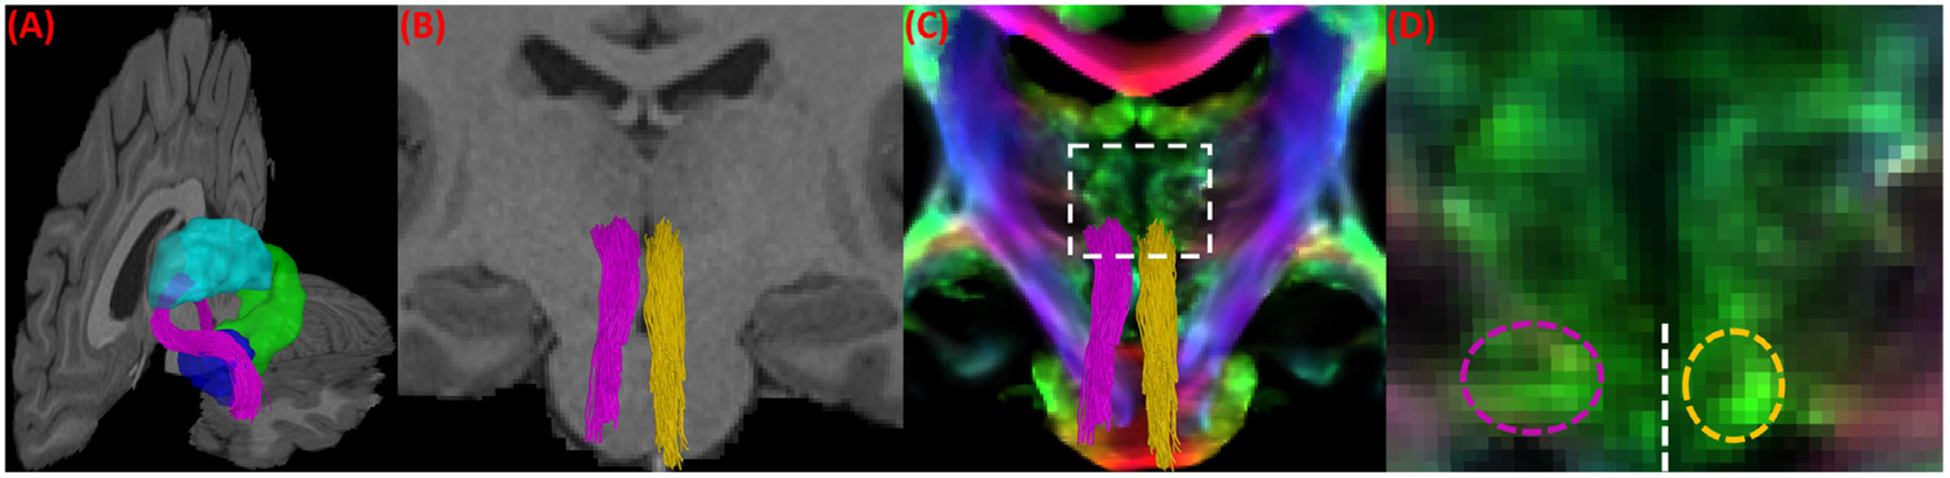
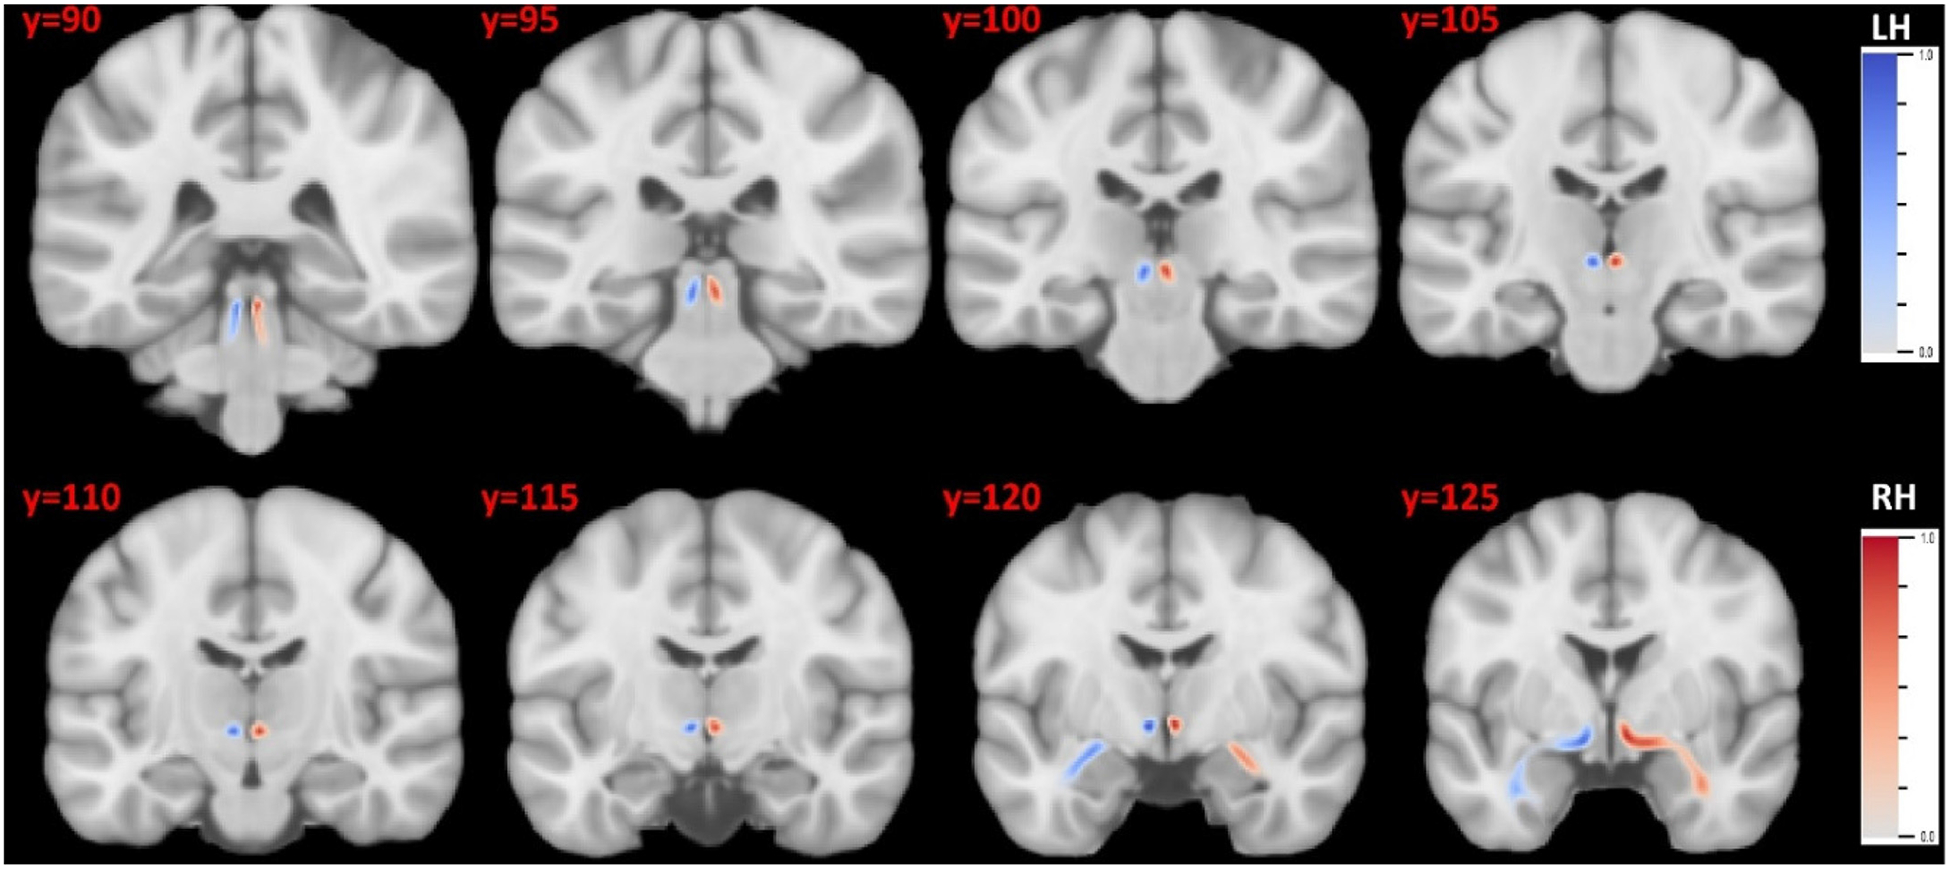
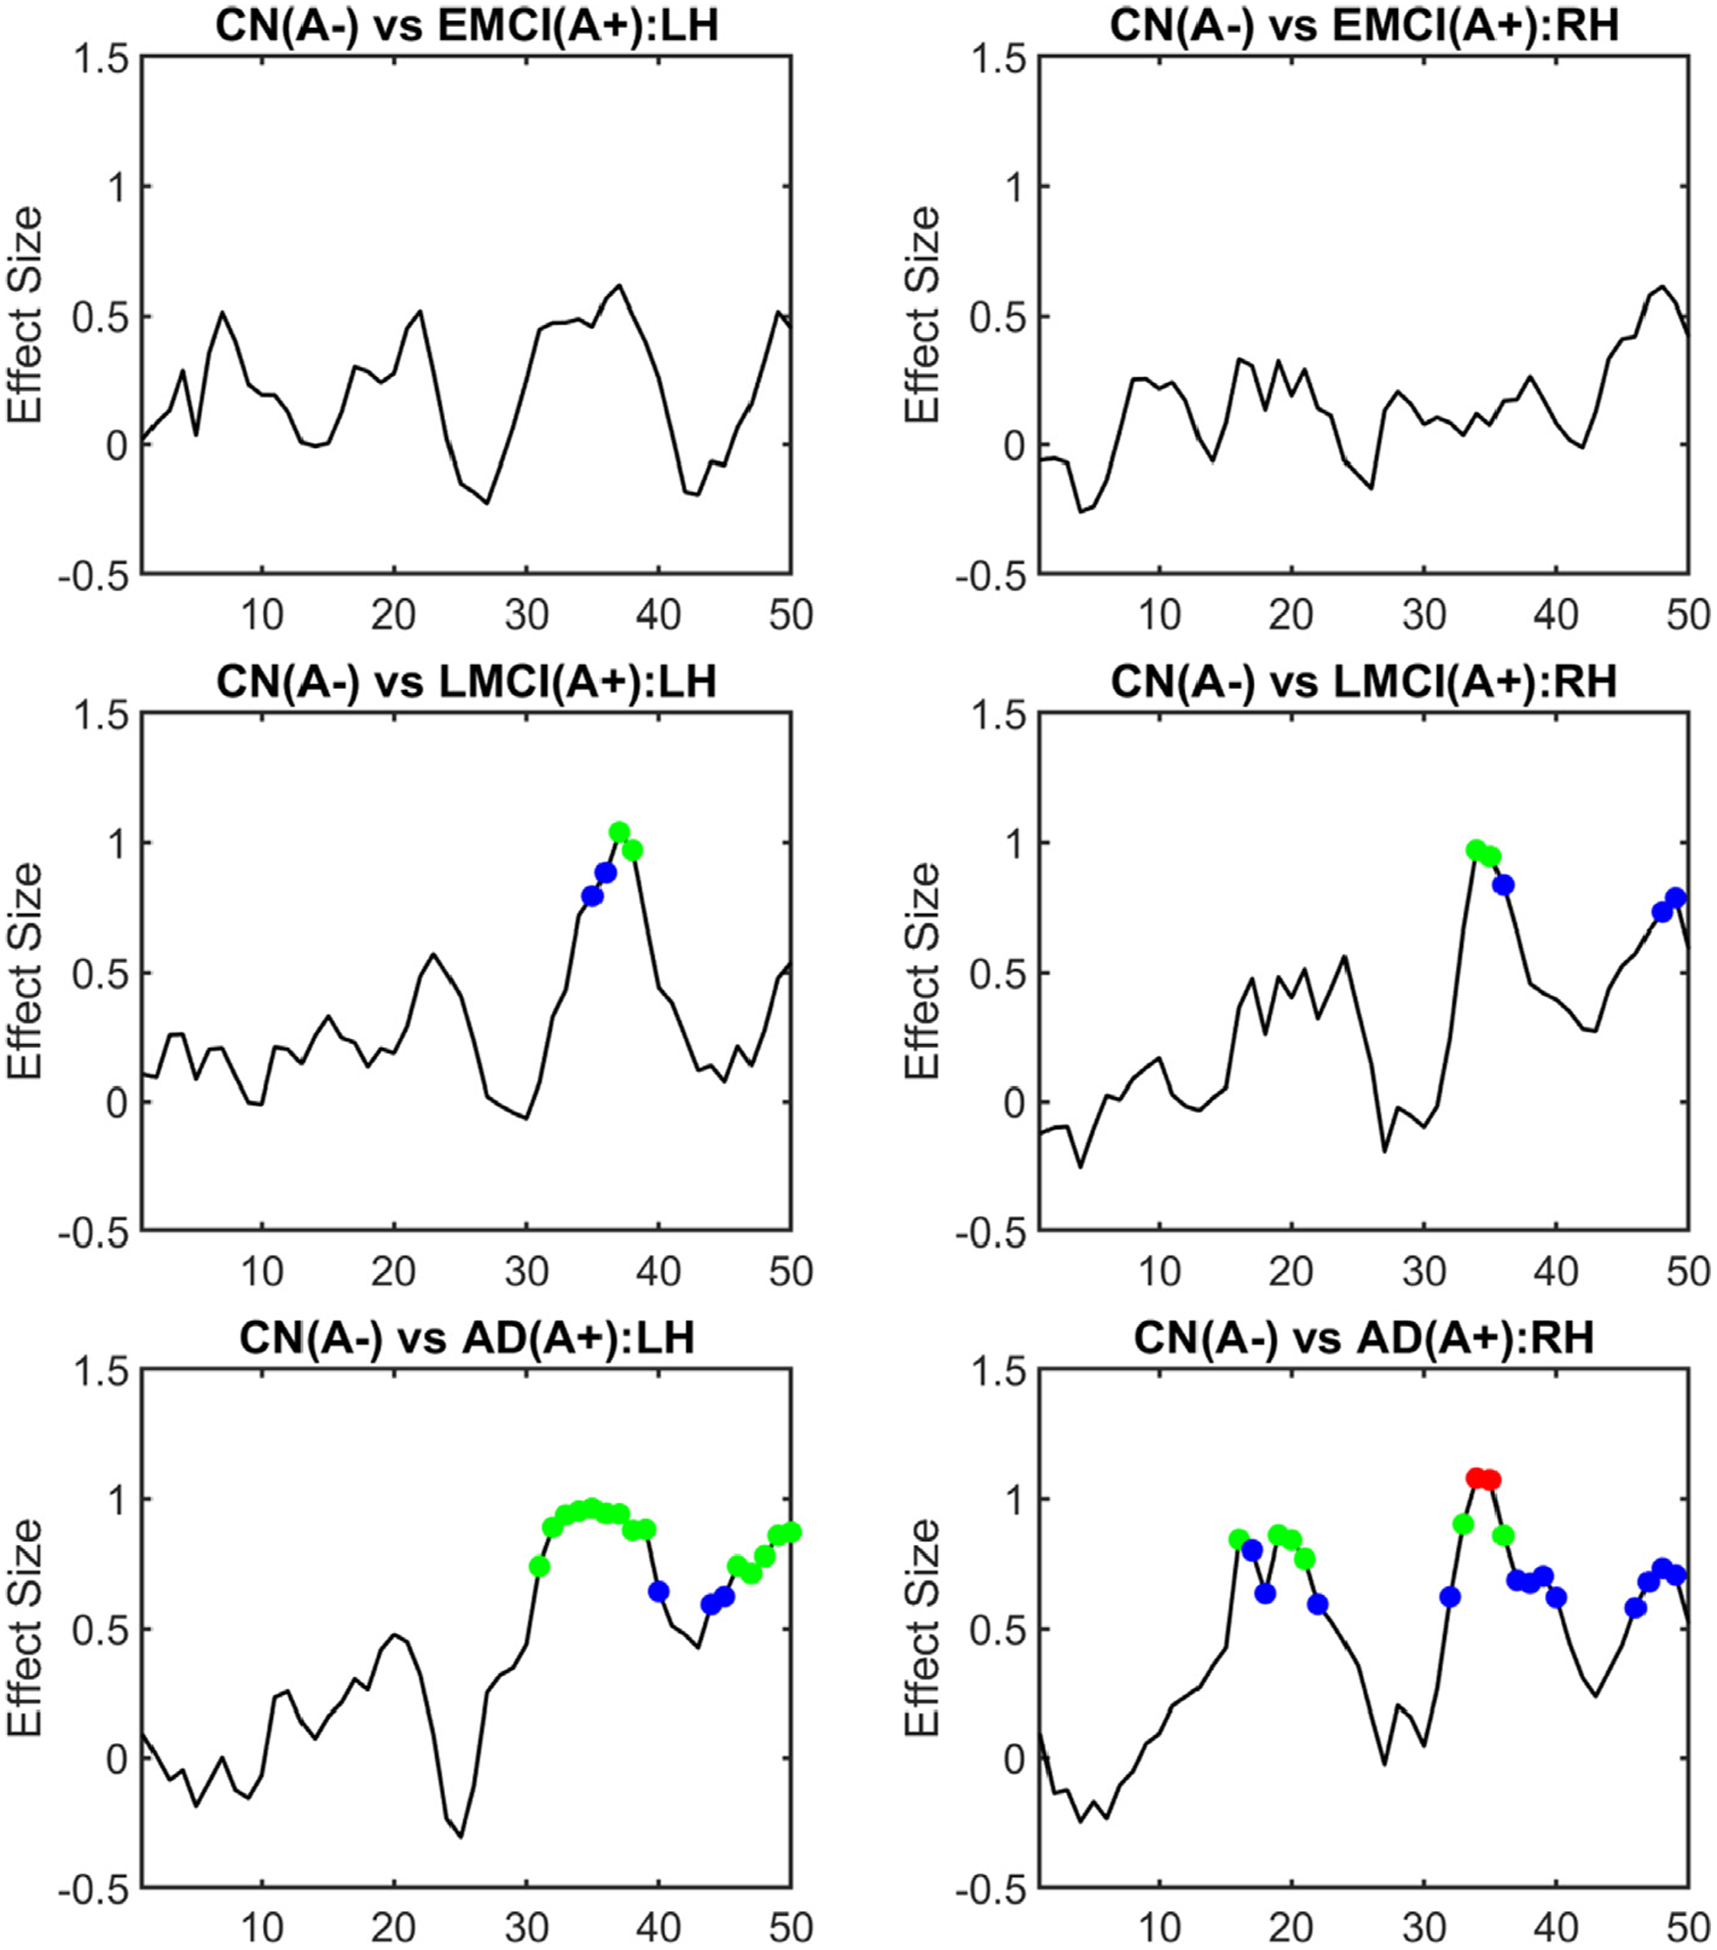
According to the latest Braak staging of Alzheimer's disease (AD), tau pathology occurs earliest in the brain in the locus coeruleus (LC) of the brainstem, then propagates to the transentorhinal cortex (TEC), and later to other neocortical regions. Recent animal and in vivo human brain imaging research also support the trans-axonal propagation of tau pathology. In addition, neurochemical studies link norepinephrine to behavioral symptoms in AD. It is thus critical to examine the integrity of the LC-TEC pathway in studying the early development of the disease, but there has been limited work in this direction. By leveraging the high-resolution and multi-shell diffusion MRI data from the Human Connectome Project (HCP), in this work we develop a novel method for the reconstruction of the LC-TEC pathway in a cohort of 40 HCP subjects carefully selected based on rigorous quality control of the residual distortion artifacts in the brainstem. A probabilistic atlas of the LC-TEC pathway of both hemispheres is then developed in the MNI152 space and distributed publicly on the NITRC website. To apply our atlas on clinical imaging data, we develop an automated approach to calculate the medial core of the LC-TEC pathway for localized analysis of connectivity changes. In a cohort of 138 subjects from the Alzheimer's Disease Neuroimaging Initiative (ADNI), we demonstrate the detection of the decreased fiber integrity in the LC-TEC pathways with increasing disease severity.


Figures

Fig. 1.
Fig. 1.
An illustration of LC pathways as represented by connectome imaging data. (A) Anatomy of the LC (see A6 in the diagram) projection to cortex via the dorsal noradrenergic ascending bundle (dashed red ellipse) that branch off to the amygdala and hippocampus (Marien et al., 2004) (reprinted with permission from Elsevier). Abbreviations: amyg – amygdala; cb – cerebellum; cc – corpus callosum; cp – caudate and putamen; hip – hippocampus; hth – hypothalamus; nb – nucleus basalis; ob – olfactory bulb; sep – septum; sc – spinal cord; th – thalamus; (A1, A5, A7) – lateral tegmental noradrenergic cell groups, A2 - medullary noradrenergic cell groups; A6 – locus coeruleus. (B) The LC ROI on a sagittal slice of the T1-weighted MRI of an HCP subject. For the ROI highlighted by the red box, the fiber orientation distributions (FODs) were plotted in (C), which show the dorsal noradrenergic ascending bundle is well represented by the FODs.
Fig. 2.
Fig. 2.
ROIs used in LC pathway reconstruction using FOD-based tractography. (A) The pial cortical surface reconstructed by FreeSurfer. (B) The TEC boundary (red) delineated on the smoothed pial surface and its enclosed ROI on surface (blue). (C) The extension of the surface ROI to volumetric ROI (cyan) of the TEC. (D) The LC ROI obtained from nonlinear registration. (E) 3D rending of the LC ROIs on both hemispheres. (F) the expanded thalamic ROI. (G) Midbrain mask used as an exclusion ROI in tractography.
Fig. 3.
Fig. 3.
Robustness of the fiber bundle reconstruction method with respect to the ROIs. We dilated all the ROIs (inclusion/exclusion and seeding ROIs) by a spherical kernel with a 2mm radius. The original (yellow) and dilated (red) LC ROI is plotted on a sagittal slice in (A). The reconstructed LC-TEC pathway before (purple) and after (cyan) the dilation of the ROIs were overlaid and plotted in (B), which shows the consistent trajectories of the two bundles.
Fig. 4.
Fig. 4.
Application of the LC-TEC bundle atlas to clinical imaging data from the ADNI. (A) The warped LC-TEC bundle atlas on the FA image of an ADNI subject. (B) The reconstructed surface representation of the LC-TEC bundle mask. (C) Digitization of the medial core of the LC-TEC bundle into 50 points.
Fig. 5.
Fig. 5.
The reconstructed LC-TEC bundle from 4 representative HCP subjects. In (A)-(D), the LC-TEC bundle of the left and right hemisphere of each subject were overlaid with MRI slices to visualize their spatial trajectory.
Fig. 6.
Fig. 6.
A more detailed illustration of the spatial trajectory of the LC-TEC fiber bundles for the HCP subject shown in Fig. 5 (A). (A) The left LC-TEC bundle from Fig. 5 (A) is plotted in purple together with neighboring anatomical structures: thalamus (cyan), hippocampus (green), and amygdala (blue) on the left hemisphere. (B) The intersection of both the left (purple) and right (yellow) LC-TEC bundle in Fig. 5 (A) with a coronal slice of the T1-weighted MRI of the HCP subject at the position of posterior thalamus. (C) The intersection of the left (purple) and right (yellow) LC-TEC bundle with a coronal slice of the TDI image from the same HCP subject at the same position as in (B). For the region within the dashed rectangle, a zoomed-in view of the TDI image is provided in (D) to illustrate the asymmetry of the white matter structures in this area and hence the resulting asymmetry of the reconstructed LC-TEC fiber pathways, where the dashed purple and yellow ellipse show the intersection of the left and right LC-TEC bundles with the TDI image, respectively. The dashed white line marks the separation of the left and right hemisphere.
Fig. 7.
Fig. 7.
The probabilistic atlas of the LC-TEC bundles in the MNI152 space. The atlas for the left and right bundle was displayed in blue and red, respectively. LH: left hemisphere; RH: right hemisphere.
Fig. 8.
Fig. 8.
Localized group differences of LC-TEC bundle connectivity using ADNI2 data. The effect size (Cohen’s D) of the group difference of RD at each point along the medial core of the LC-TEC bundle was computed for each group comparison: CN(A−) vs EMCI(A+), CN(A−) vs LMCI(A+), and CN(A−) vs AD(A+). Results from both the left hemisphere (LH) and right hemisphere (RH) were plotted. A two-tailed t-test was also applied at each point of the medial core of the LC-TEC bundle to examine the statistical significance of the group difference. After FDR correction, points were highlighted as colored circles in each plot if their adjusted p-values reach significance (blue: p < 0.05; green: p < 0.01; red: p < 0.001).
Fig. 9.
Fig. 9.
The data of ADNI3 subjects from the same site (site id = 003) were used to illustrate susceptibility induced distortions on the medial core of the LC-TEC pathway. Besides the dMRI data, one phase difference image and two magnitude images were acquired from these subjects to compute a field map using the fsl_prepare_fieldmap tool from FSL, which was then used for distortion correction with a publicly available tool called dti_Preprocess (Jenkinson, 2003). After that, the LC pathway atlas was deformed to the B0 image of each subject to obtain the distortion on each point of the medial core of the LC-TEC pathway. In (A)-(C), results from an ADNI3 subject (003_S_6264) with mild distortions and another ADNI3 subject (003_S_6833) with more severe distortions at brain stem were shown on the top and bottom row, respectively. (A) B0 image. (B) An overlay of the medial core of the left LC-TEC pathway over the 3-slice view of the distortion map along the anterior-posterior direction. (C) The medial core of the LC-TEC pathways on both hemispheres are colored by the magnitude of the distortion from susceptibility. Note that the magnitude is below 1mm for point 1–40 on the digitized medial core of both subjects, which is less than half of the voxel resolution (2mm). (D) For all ADNI3 subjects from the same site, we split them into CN (n = 16) and MCI/AD (n = 13) groups, and displayed the mean value of the distortion on the LC pathway medical core of a representative subject from each group. Top: CN group; Bottom: MCI/AD group. A two-tailed t-test was applied to each point of the medial core to examine group differences and no statistical difference was detected on any point with the minimal p-value > 0.45.

References

    1. Acosta-Cabronero J, Nestor PJ, 2014. Diffusion tensor imaging in Alzheimer’s disease: insights into the limbic-diencephalic network and methodological considerations. Front. Aging Neurosci 6. - PMC - PubMed
    1. Avants BB, Epstein CL, Grossman M, Gee JC, 2008. Symmetric diffeomorphic image registration with cross-correlation: evaluating automated labeling of elderly and neurodegenerative brain. Med. Image Anal 12, 26–41. - PMC - PubMed
    1. Benarroch EE, 2009. The locus ceruleus norepinephrine system: functional organization and potential clinical significance. Neurology 73, 1699–1704. - PubMed
    1. Benjamini Y, Hochberg Y, 1995. Controlling the false discovery rate: a practical and powerful approach to multiple testing. J. R. Stat. Soc 57, 289–300.
    1. Betts MJ, Cardenas-Blanco A, Kanowski M, Jessen F, Düzel E, 2017. In vivo MRI assessment of the human locus coeruleus along its rostrocaudal extent in young and older adults. Neuroimage 163, 150–159. - PubMed

Publication types