

Comparison of Approaches for Determining Bioactivity Hits from High-Dimensional Profiling Data
- PMID: 32862757
- PMCID: PMC8673120
- DOI: 10.1177/2472555220950245
Comparison of Approaches for Determining Bioactivity Hits from High-Dimensional Profiling Data
Abstract
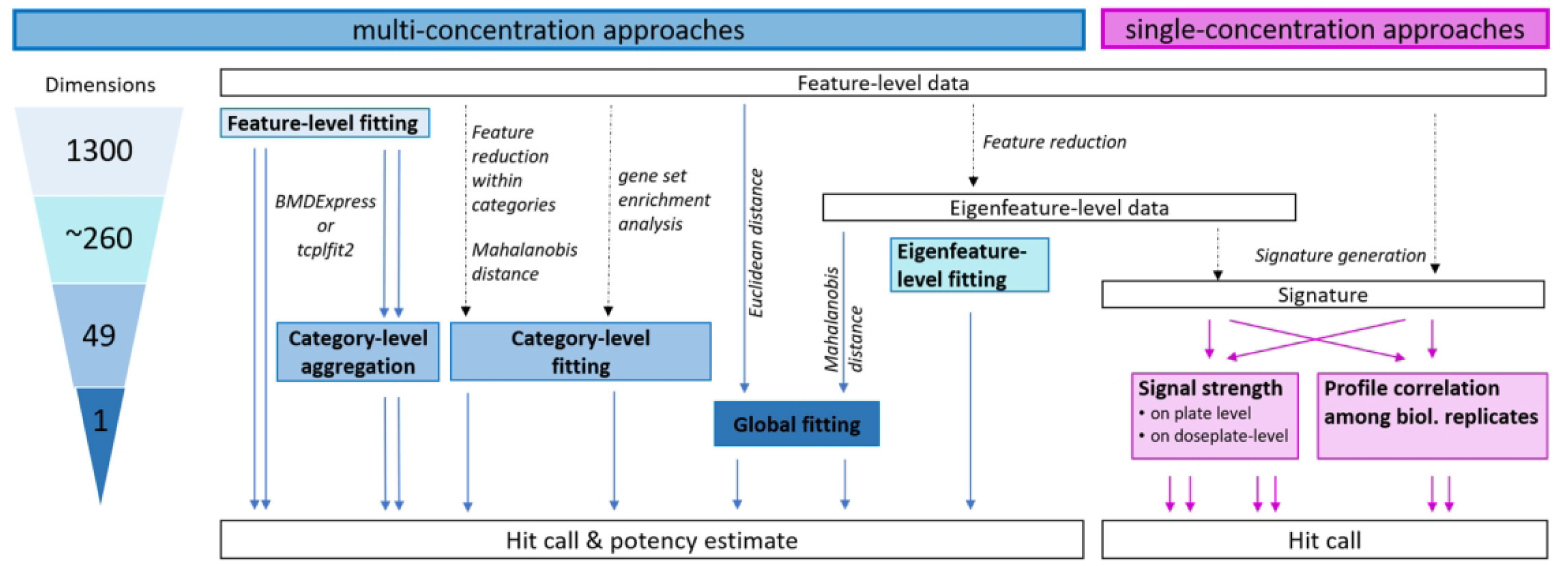
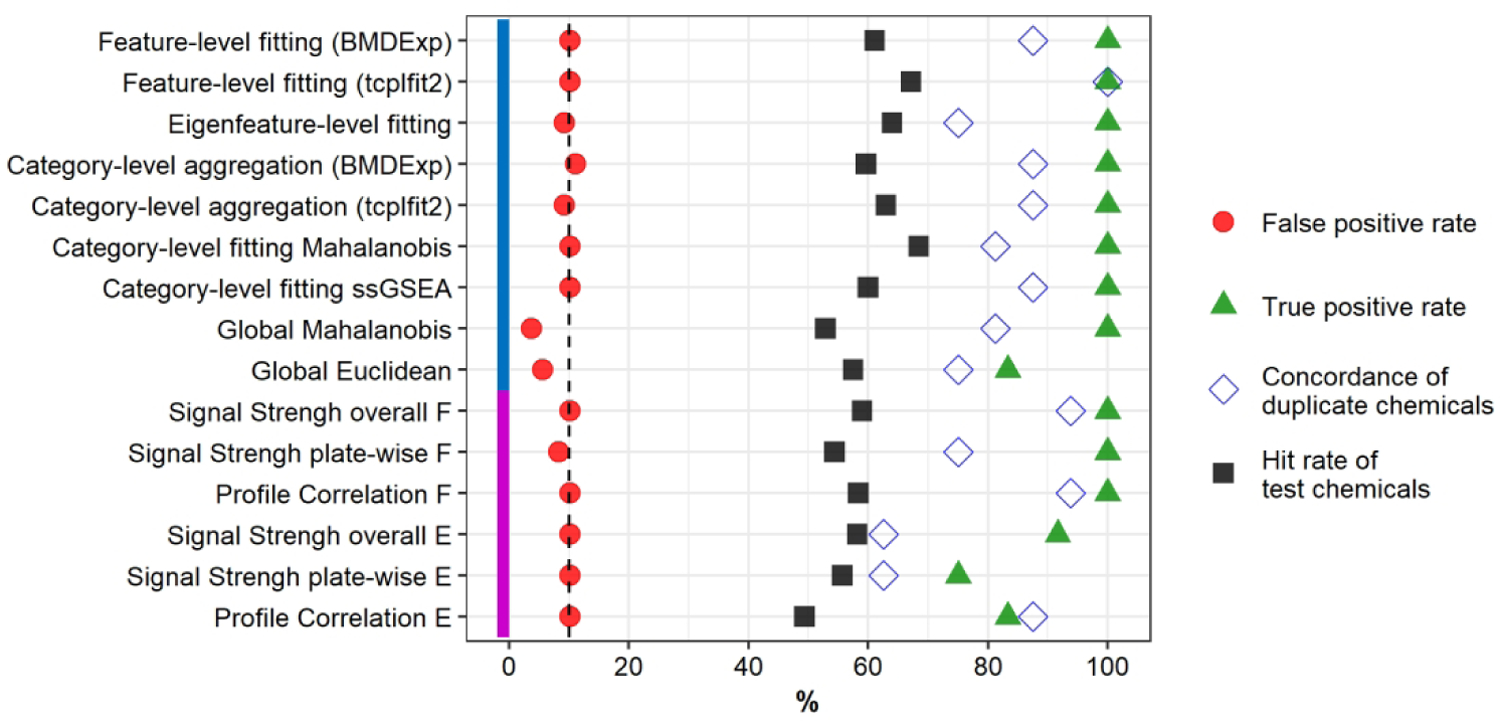
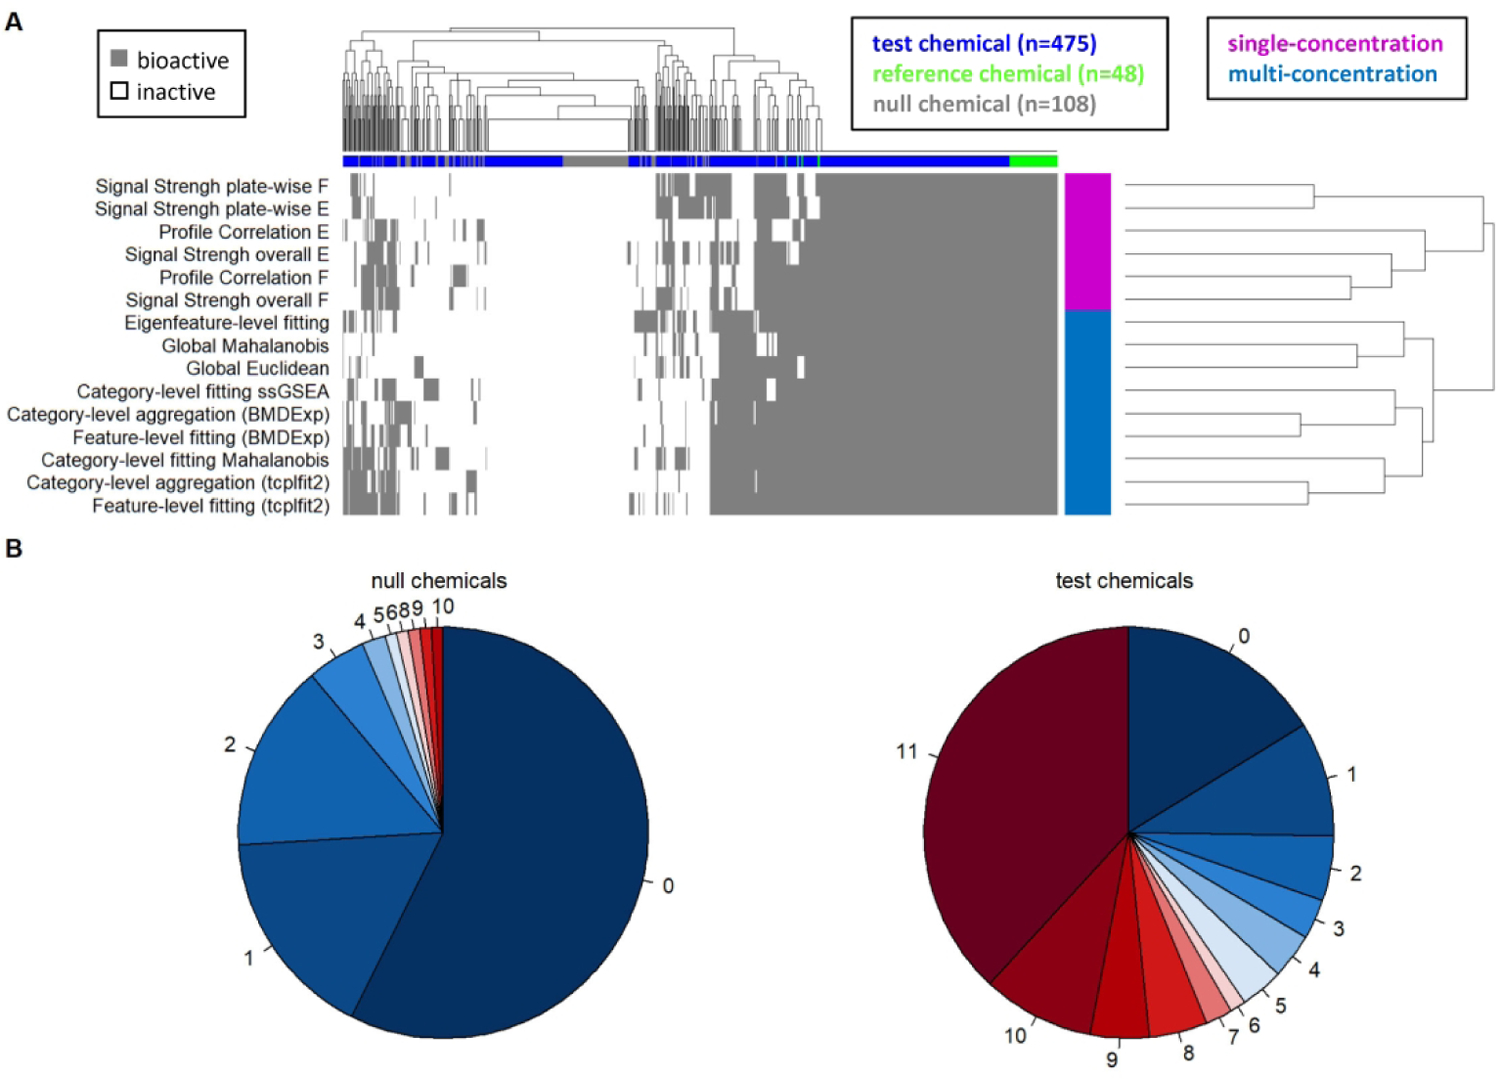
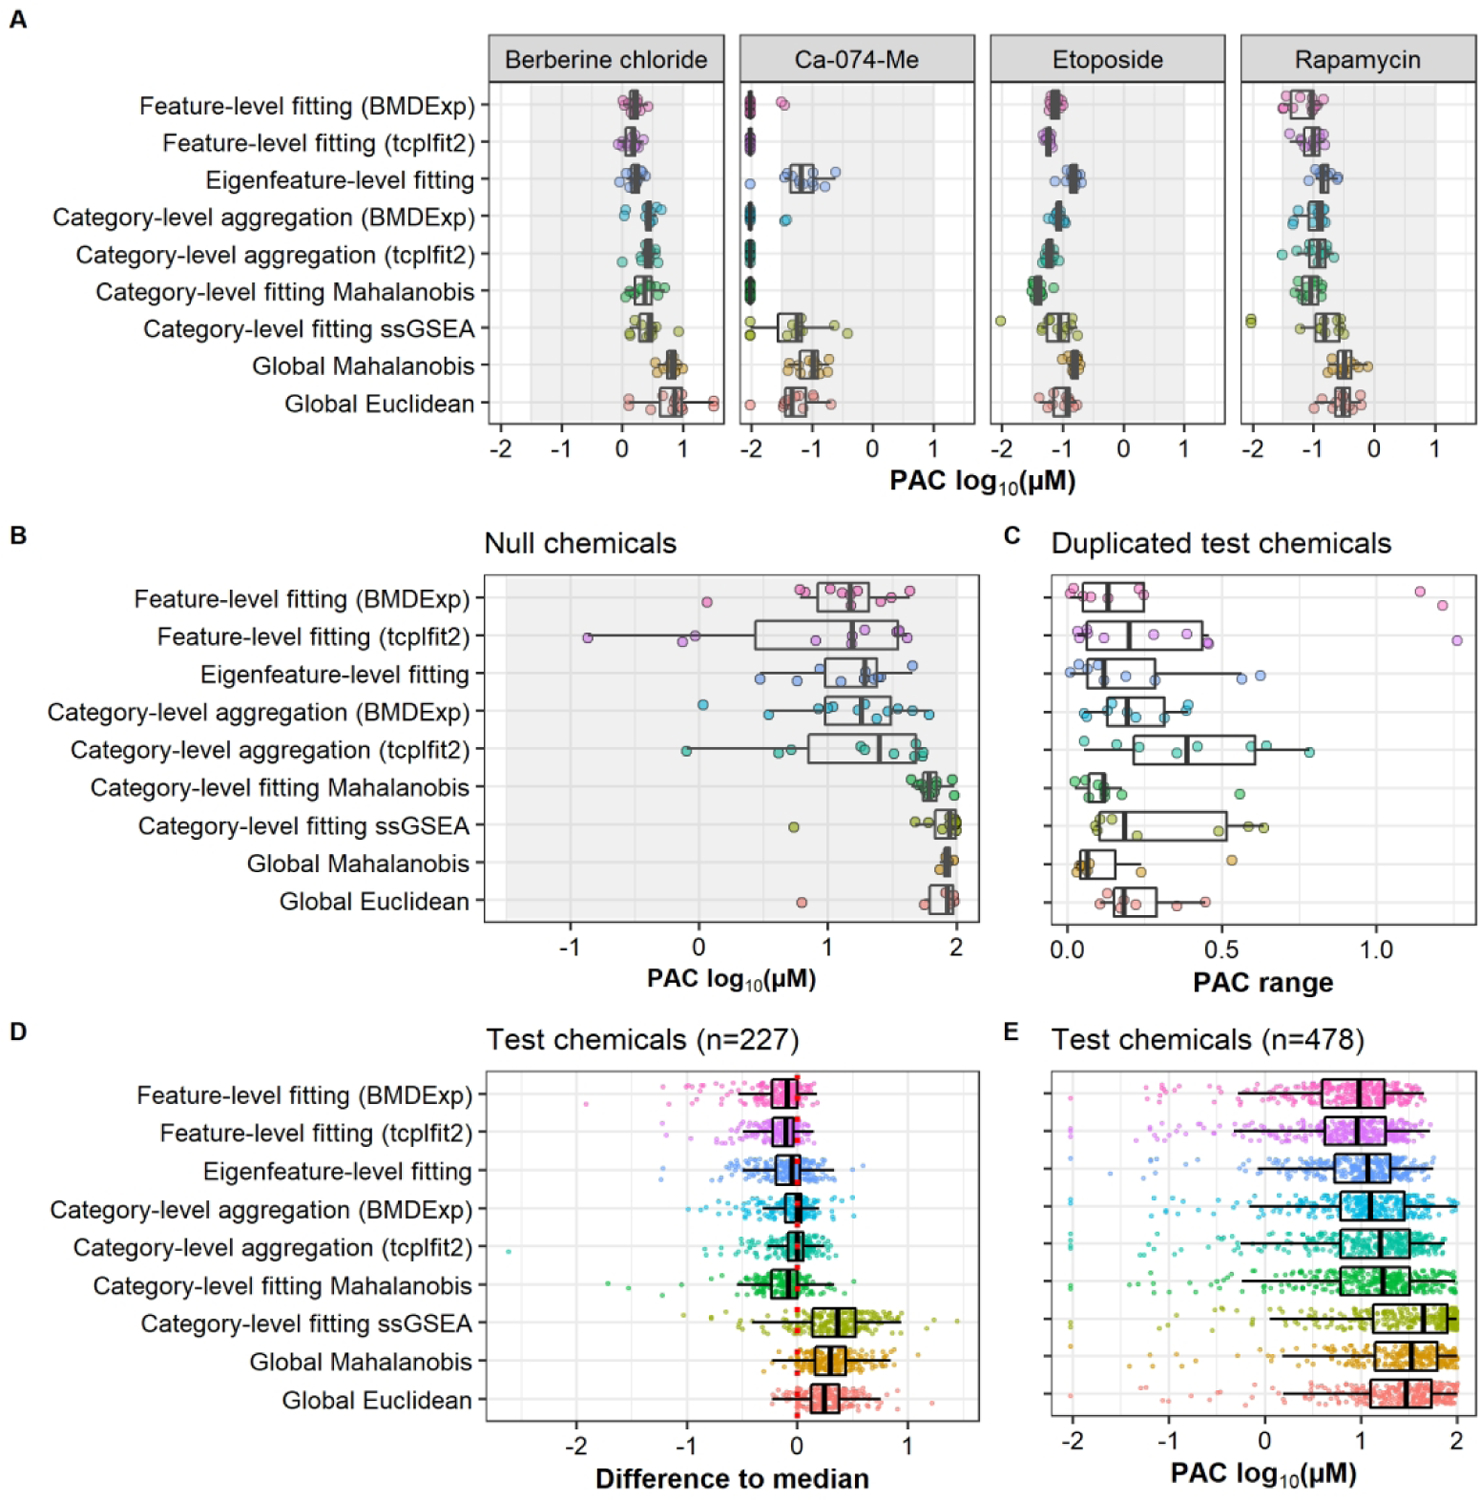
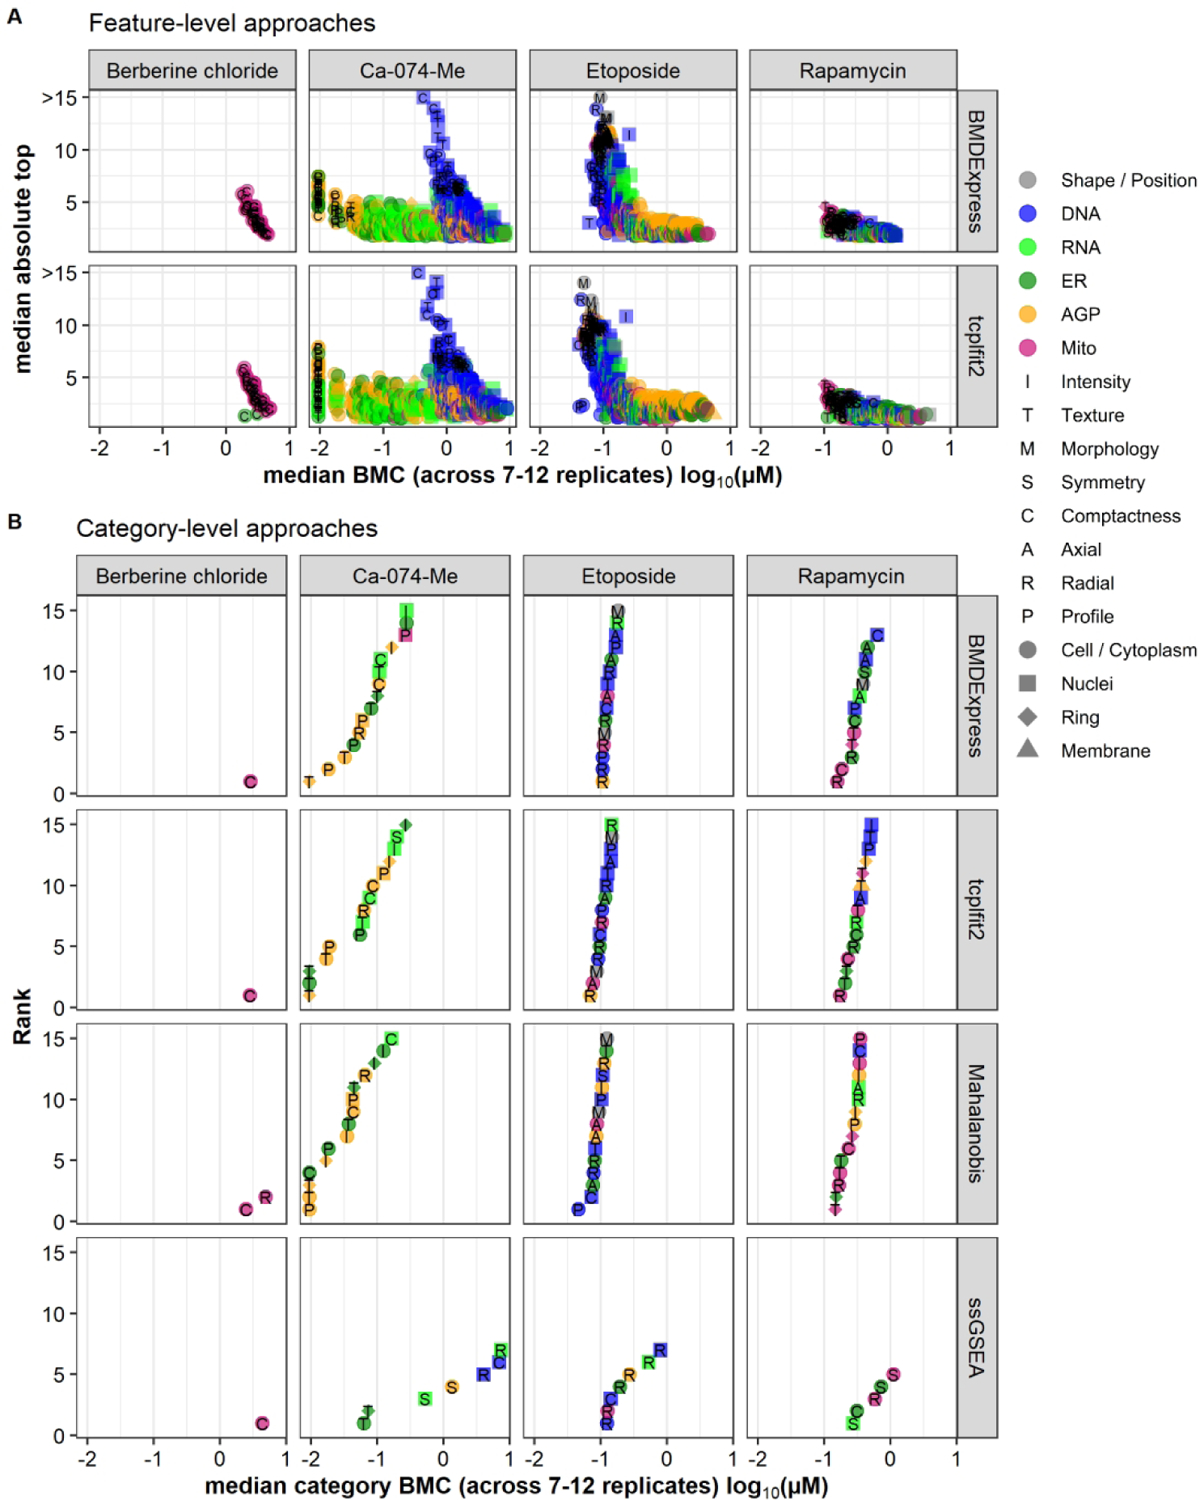
Phenotypic profiling assays are untargeted screening assays that measure a large number (hundreds to thousands) of cellular features in response to a stimulus and often yield diverse and unanticipated profiles of phenotypic effects, leading to challenges in distinguishing active from inactive treatments. Here, we compare a variety of different strategies for hit identification in imaging-based phenotypic profiling assays using a previously published Cell Painting data set. Hit identification strategies based on multiconcentration analysis involve curve fitting at several levels of data aggregation (e.g., individual feature level, aggregation of similarly derived features into categories, and global modeling of all features) and on computed metrics (e.g., Euclidean and Mahalanobis distance metrics and eigenfeatures). Hit identification strategies based on single-concentration analysis included measurement of signal strength (e.g., total effect magnitude) and correlation of profiles among biological replicates. Modeling parameters for each approach were optimized to retain the ability to detect a reference chemical with subtle phenotypic effects while limiting the false-positive rate to 10%. The percentage of test chemicals identified as hits was highest for feature-level and category-based approaches, followed by global fitting, whereas signal strength and profile correlation approaches detected the fewest number of active hits at the fixed false-positive rate. Approaches involving fitting of distance metrics had the lowest likelihood for identifying high-potency false-positive hits that may be associated with assay noise. Most of the methods achieved a 100% hit rate for the reference chemical and high concordance for 82% of test chemicals, indicating that hit calls are robust across different analysis approaches.
Keywords: Cell Painting; computational toxicology; concentration response; high-throughput phenotypic profiling.
Conflict of interest statement
Conflict of Interest
The authors declare no conflict of interest. This manuscript has been reviewed by the Center for Computational Toxicology and Exposure, Office of Research and Development, U.S. Environmental Protection Agency, and approved for publication. Approval does not signify that the contents reflect the views of the Agency, nor does mention of trade names or commercial products constitute endorsement or recommendation for use.
Figures
Similar articles
-
Bioactivity screening of environmental chemicals using imaging-based high-throughput phenotypic profiling.Toxicol Appl Pharmacol. 2020 Jan 15;389:114876. doi: 10.1016/j.taap.2019.114876. Epub 2019 Dec 30. Toxicol Appl Pharmacol. 2020. PMID: 31899216 Free PMC article.
-
Brief Guide: Experimental Strategies for High-Quality Hit Selection from Small-Molecule Screening Campaigns.SLAS Discov. 2021 Aug;26(7):851-854. doi: 10.1177/24725552211008862. Epub 2021 Apr 21. SLAS Discov. 2021. PMID: 33882754 Free PMC article.
-
The Cell Painting Assay as a Screening Tool for the Discovery of Bioactivities in New Chemical Matter.Methods Mol Biol. 2019;1888:115-126. doi: 10.1007/978-1-4939-8891-4_6. Methods Mol Biol. 2019. PMID: 30519943
-
Data-driven approaches used for compound library design, hit triage and bioactivity modeling in high-throughput screening.Brief Bioinform. 2018 Mar 1;19(2):277-285. doi: 10.1093/bib/bbw105. Brief Bioinform. 2018. PMID: 27789427 Free PMC article. Review.
-
GPCR profiling: from hits to leads and from genotype to phenotype.Drug Discov Today Technol. 2015 Nov;18:30-7. doi: 10.1016/j.ddtec.2015.10.005. Epub 2015 Nov 6. Drug Discov Today Technol. 2015. PMID: 26723890 Review.
Cited by
-
A Decade in a Systematic Review: The Evolution and Impact of Cell Painting.bioRxiv [Preprint]. 2024 May 7:2024.05.04.592531. doi: 10.1101/2024.05.04.592531. bioRxiv. 2024. PMID: 38766203 Free PMC article. Preprint.
-
Reference compounds for characterizing cellular injury in high-content cellular morphology assays.Nat Commun. 2023 Mar 13;14(1):1364. doi: 10.1038/s41467-023-36829-x. Nat Commun. 2023. PMID: 36914634 Free PMC article.
-
Optimization of Human Neural Progenitor Cells for an Imaging-Based High-Throughput Phenotypic Profiling Assay for Developmental Neurotoxicity Screening.Front Toxicol. 2022 Feb 16;3:803987. doi: 10.3389/ftox.2021.803987. eCollection 2021. Front Toxicol. 2022. PMID: 35295155 Free PMC article.
-
A Comparison of In Vitro Points of Departure with Human Blood Levels for Per- and Polyfluoroalkyl Substances (PFAS).Toxics. 2024 Apr 5;12(4):271. doi: 10.3390/toxics12040271. Toxics. 2024. PMID: 38668494 Free PMC article.
-
Modeling omics dose-response at the pathway level with DoseRider.Comput Struct Biotechnol J. 2025 Apr 3;27:1440-1448. doi: 10.1016/j.csbj.2025.04.004. eCollection 2025. Comput Struct Biotechnol J. 2025. PMID: 40242291 Free PMC article.
References
-
- Caicedo JC; Singh S; Carpenter AE Applications in image-based profiling of perturbations. Curr Opin Biotechnol 2016, 39, 134–42. - PubMed
-
- Lamb J; Crawford ED; Peck D; et al. The Connectivity Map: using gene-expression signatures to connect small molecules, genes, and disease. Science 2006, 313, 1929–35. - PubMed
-
- De Abrew KN; Shan YK; Wang X; et al. Use of connectivity mapping to support read across: A deeper dive using data from 186 chemicals, 19 cell lines and 2 case studies. Toxicology 2019, 423, 84–94. - PubMed
Publication types
MeSH terms
Grants and funding
LinkOut - more resources
Full Text Sources
