. 2020 Sep:36:101639.
doi: 10.1016/j.redox.2020.101639. Epub 2020 Jul 11.

Fyn specifically Regulates the activity of red cell glucose-6-phosphate-dehydrogenase

Affiliations

Fyn specifically Regulates the activity of red cell glucose-6-phosphate-dehydrogenase

Alessandro Mattè et al. Redox Biol. 2020 Sep.

Abstract

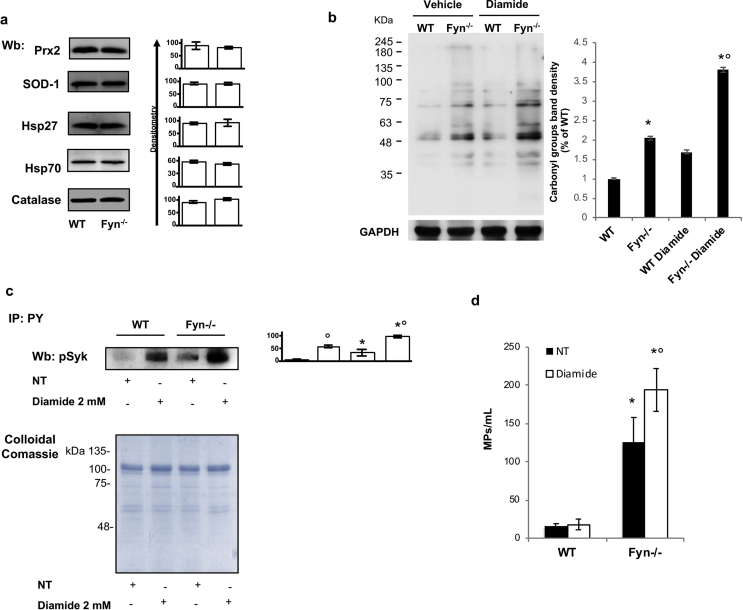
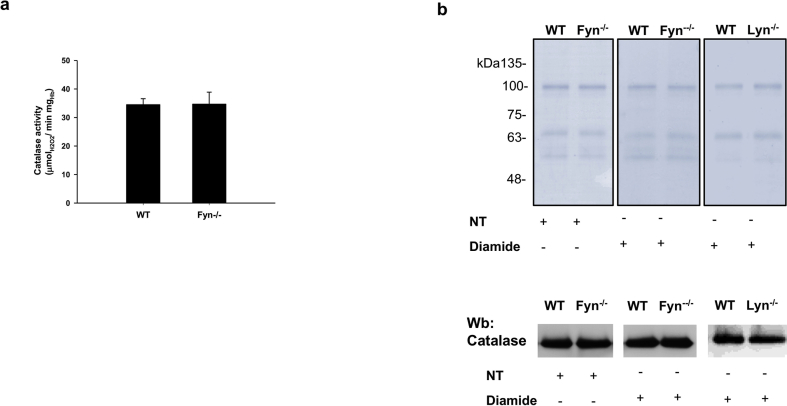
Fyn is a tyrosine kinase belonging to the Src family (Src-Family-Kinase, SFK), ubiquitously expressed. Previously, we report that Fyn is important in stress erythropoiesis. Here, we show that in red cells Fyn specifically stimulates G6PD activity, resulting in a 3-fold increase enzyme catalytic activity (kcat) by phosphorylating tyrosine (Tyr)-401. We found Tyr-401 on G6PD as functional target of Fyn in normal human red blood cells (RBC), being undetectable in G6PD deficient RBCs (G6PD-Mediterranean and G6PD-Genova). Indeed, Tyr-401 is located to a region of the G6PD molecule critical for the formation of the enzymatically active dimer. Amino acid replacements in this region are mostly associated with a chronic hemolysis phenotype. Using mutagenesis approach, we demonstrated that the phosphorylation status of Tyr401 modulates the interaction of G6PD with G6P and stabilizes G6PD in a catalytically more efficient conformation. RBCs from Fyn-/-mice are defective in G6PD activity, resulting in increased susceptibility to primaquine-induced intravascular hemolysis. This negatively affected the recycling of reduced Prx2 in response to oxidative stress, indicating that defective G6PD phosphorylation impairs defense against oxidation. In human RBCs, we confirm the involvement of the thioredoxin/Prx2 system in the increase vulnerability of G6PD deficient RBCs to oxidation. In conclusion, our data suggest that Fyn is an oxidative radical sensor, and that Fyn-mediated Tyr-401 phosphorylation, by increasing G6PD activity, plays an important role in the physiology of RBCs. Failure of G6PD activation by this mechanism may be a major limiting factor in the ability of G6PD deficient RBCs to withstand oxidative stress.

Keywords: G6PD; Oxidation; Primaquine; Red cells; Signaling.


Figures

Image 1
Graphical abstract
Fig. 1
Fig. 1
In human red cells exposed to oxidation, G6PD is Tyrosin-phosphorylated by Fyn, which target Tyr401 residue on G6PD. (a) Cytosol fraction from red cells of healthy and G6PD-Mediterranean subjects treated with or without (NT: non-treated) diamide underwent immunoprecipitation with specific anti-phospho-Tyrosine antibodies (IP: PY) and then used for Western-blot (Wb) analysis with either anti-G6PD or anti-Fyn antibodies. Twin colloidal Commassie stained gels as well as catalase in IP supernatant were used as loading controls run (see 1Sa). One representative gel from other 4 with similar results is presented. Lower panel. Relative quantification of immunoreactivity for Fyn or PY catalase (densitometric intensity was relative to catalase). Data are presented as mean ± SD (n = 4; *p< 0.05 compared to WT; ° p<0.05 compared to non-treated red cells). (b) Cytosol fraction from red cells of healthy and G6PD-Mediterranean subjects treated with or without (NT: non-treated) diamide underwent Western-blot (Wb) analysis with either anti-G6PD or anti-Fyn antibodies. Catalase in IP supernatant was used as protein loading control (see 1Sb). One representative gel from other 4 with similar results is presented. Lower panel. Relative quantification of immunoreactivity for Fyn or PY (densitometric intensity was relative to catalase). Data are presented as mean ± SD (n = 4; *p< 0.05 compared to healthy red cells; ° p<0.05 compared to non-treated red cells). (c) Cytosol fraction from red cells of healthy and G6PD-Genova subjects exposed to diamide underwent immunoprecipitation respectively with specific anti-phospho-Tyrosine antibodies (IP: PY) or anti-Fyn and then used for Western-blot (Wb) analysis with anti-phospho-Tyr-416 Src antibody to detect active form of Fyn (PY420) and anti-Fyn. One representative gel from other 4 with similar results is presented. Catalase in IP supernatant was used as loading control (Fig. 1Sc). Right panel. Relative quantification of immunoreactivity for active and total Fyn (densitometric intensity was relative to catalase). Data are presented as mean ± SD (n = 4; *p< 0.05 compared to healthy red cells; ° p<0.05 compared to non-treated red cells). (d) Cytosol fraction from red cells of healthy and G6PD Genova subjects treated with or without (NT: non-treated) diamide underwent immunoprecipitation with specific anti-phospho-Tyrosine antibodies (IP: PY) and then used for Western-blot (Wb) analysis with either anti-G6PD or anti-Fyn antibodies. Catalase in IP supernatant was used as loading control (Fig. 1Sd). One representative gel from other 4 with similar results is presented. Right panel. Relative quantification of immunoreactivity for Fyn or PY (densitometric intensity was relative to catalase). Data are presented as mean ± SD (n = 4; *p< 0.05 compared to healthy red cells; ° p<0.05 compared to non-treated red cells). a-d Data are presented as mean ± SD; *p< 0.05 compared to healthy red cells; ° p<0.05 compared to non-treated red cells by two-way ANOVA with Bonferroni correction for multiple comparisons. (e) Fragmentation spectrum of the G6PD peptide 395–403 from the LC-MS/MS analysis of an immuno-enriched sample of phospho-G6PD from diamide treated healthy red cells red cells following tryptic hydrolysis. The figure shows the occurrence of pTyr at position 401. (f) Upper left panel. Time course of wild type G6PD phosphorylation by Fyn. Values are the mean ± SEM of four determinations performed at each time point. Upper right panel. G6PD activity (reported as % of fold change, y-axis) of equivalent amounts of G6PD previously phosphorylated by Fyn at different time points (reported as G6PD-P/G6PDTOT ratio). Each value is the mean ± SEM of four determinations. Lower panel. One representative gel from 4 with similar results is presented and it refers to the time course of phosphorylation of wild type G6PD by Fyn (upper left panel). (For interpretation of the references to colour in this figure legend, the reader is referred to the Web version of this article.)
Fig. 2
Fig. 2
Tyr 401 on G6PD is important for G6PD conformation and activity. (a) Molecular dynamics simulations of G6PD dimer (wt, Y401F, pTyr401) NADP is represented as sticks, Tyr 401 and Trp 509 as spheres. For clarity, only one monomer is represented. (bc) Determination of kinetic parameters of wt, phosphorylated and Phe mutant G6PD. Linewaver-Burk plots of enzyme activity of G6PD WT (●), phosphorylated-G6DP (G6PD-pTyr) (○) and G6DP-Phe (□) for the determination of the steady-state kinetic parameters versus the two substrates: G6P in (b) (fixed and saturating [NADP+] = 86uM) and NADP+ (in c) (saturating [G6P] = 0.54 mM with wt-enzyme and 4.3 mM with Phe-mutant enzyme); human recombinant [G6PD] = 2 nM. Right panel. Kinetic parameters calculated from the Lineweaver-Burk plots (b,c).
Fig. 3
Fig. 3
Fyn-/-mouse red cells display increased ROS levels, hemichromes bound to the membrane and band 3 clusterization promoting the release of erythroid microparticles. (a) Morphology of red cells in May-Grunwald-Giemsa blood smears from wild-type (WT) and Fyn-/- mice. Red cells were imaged under oil at 100X magnification using a Panfluor objective with 1.30 numeric aperture on a Nikon Eclipse DS-5M camera and processed with Digital Slide (DS-L1) Nikon. One representative image from 8 taken for each mouse strains with similar results is presented. (b) Reactive oxygen species (ROS) levels in red cells from wild-type (WT) and Fyn-/- mice. Data are presented as means ± SD (n = 6 from each strain); *p<0.05 compared to WT. (c) Upper panel. wild-type (WT) and Fyn-/−mouse red cell membrane carbonylated proteins (1ug) were detected by treating with DNPH and blotted with anti-DNP antibody. GAPDH was used as protein loading control. Lower panel. Quantification of band area was performed by densitometry and expressed as % of wild-type. Data are expressed as means ± SD (n = 3 from each strains); *p<0.05 compared to WT.(d) Upper panel. Hemichromes (HMCs) bound to the membrane of red blood cells (RBCs) from wild-type (WT) and Fyn-/- mice. Data are presented as means ± SD (n = 6); *p<0.05 compared to WT. Lower panel. Percentage of band 3 clusters in erythrocytes from wild-type (WT) and Fyn-/- mice. Data are presented as means ± SD (n = 6); *p<0.05 compared to WT. (e) Western-blot (Wb) analysis with specific antibodies against heat shock proteins (HSP) 27 and 70, peroxiredoxin-2 (Prx2) of red cells membrane from wild-type (WT) and Fyn-/- mice. One representative gel out of 6 with similar results is presented. Actin was used as protein loading control. Densitometric analysis of immunoblots is shown in bar graph (right panel). Data are presented as means ± SD (n = 6 from each strains); *p<0.05 compared to WT. (f) Red cell ghosts from wild-type (WT) and Fyn-/- underwent immunoprecipitation with specific anti-phospho-Tyrosine antibodies (IP: PY) and then used for Western-blot (Wb) analysis with specific anti-phospho-Syk (pSyk) antibody. IgG and actin were used as loading controls. One representative gel out of 4 with similar results is presented. Lower panel. Relative quantification of immunoreactivity for pSyk, IgG and actin. Data are presented as mean ± SD (n = 4; *p< 0.05 compared to WT). (g) Quantification of microparticles (MPs) from red cells of wild-type (WT) from wild-type (WT) and Fyn-/- mice. Data are presented as means ± SD (n = 6); *p<0.05 compared to WT. a-f. Data are presented as means ± SD (n = 6); *p<0.05 compared to WT by Student’s t-test.
Fig. 4
Fig. 4
In Fyn-/-mouse red cells, diamide induces hemoglobin oxidation and severe red cell membrane damage, related to impaired G6PD activity. (a) Morphology of diamide (mM) treated red cells in May-Grunwald-Giemsa blood smears from wild-type (WT) and Fyn-/- mice. The black arrows indicate clusters of oxidized hemoglobin in Fyn-/- mouse red cells. Red cells were imaged under oil at 100X magnification using a Panfluor objective with 1.30 numeric aperture on a Nikon Eclipse DS-5M camera and processed with Digital Slide (DS-L1) Nikon. One representative image out of 4 taken for each mouse strains with similar results is presented. (b) Reactive oxygen species (ROS) levels in wild-type (WT) and Fyn-/- mouse red blood cells (RBCs) with (2 mM) or without diamide (non-treated: NT). Data are presented as means ± SD (n = 6 from each strain); *p<0.05 compared to WT; °p<0.05 compared to NT. (c) Upper panel. Hemichromes (HMCs) bound to the membrane of wild-type (WT) and Fyn-/- mouse red blood cells (RBCs) with (2 mM) or without diamide (non-treated: NT). Data are presented as means ± SD (n = 6); *p<0.05 compared to WT. Lower panel. Percentage of band 3 clusters in wild-type (WT) and Fyn-/- mouse red blood cells (RBCs) with (2 mM) or without diamide (non-treated: NT). Data are presented as means ± SD (n = 6); *p<0.05 compared to WT. (d) upper panel. Western-blot (Wb) analysis with specific antibodies against glucose 6 phosphate dehydrogenase (G6PD) or thioredoxin reductase (TrxR) of red cells from wild-type (WT) and Fyn-/- mice. Catalase was used as loading control. One representative gel out of 6 with similar results is presented. Lower panel. Densitometric analysis of immunoblots is shown in bar graph. Data are presented as means ± SD (n = 6 from each strains); *p<0.05 compared to WT. (e) Activity of glucose 6 phosphate dehydrogenase (G6PD) and thioredoxin reductase (TrxR) in red cell lysates from wild-type (WT) and Fyn-/−mice. Data are presented as means ± SD (n = 6 from each strains); *p<0.05 compared to WT. (f) NADPH/NADPtotal ratio in wild-type (WT) and Fyn-/- mice. Data are presented as means ± SD (n = 6 from each strains); *p<0.05 compared to WT. [NADPtotal]/[Hb] ratios were not significantly different when WT was compared to Fyn-/- ([NADPtotal]/[Hb]: (1.51 ± 0.31) x 10-3 and (1.80 ± 0.46) x 10-3, for WT and Fyn-/- mice, respectively). (g) Activity of G6PD in red cell lysates from wild-type (WT) and Fyn-/- mice with (2 mM) or without diamide treatment (non-treated: NT). Data are presented as means ± SD (n = 6 from each strain); *p<0.05 compared to WT; °p<0.05 compared to NT. (h) Wild-type (WT), Fyn-/- and Lyn-/- mouse cytosol fraction from red cells with or without diamide (non-treated: NT) underwent immunoprecipitation with specific anti-phospho-Tyrosine antibodies (IP: PY) and then used for either Western-blot (Wb) analysis with specific glucose 6 phosphate dehydrogenase (G6PD) antibody or colloidal Commassie staining for protein loading control. Catalase in IP supernatant was used as addition protein loading control (see 4Sb). One representative gel out of 4 with similar results is presented. Lower panel. Relative quantification of immunoreactivity for G6PD. Data are presented as mean ± SD (n = 4; *p< 0.05 compared to WT; ° p<0.05 compared to non-treated red cells). b-c-f *p<0.05 compared to WT; °p<0.05 compared to NT by two-way ANOVA with Bonferroni correction. d, e, f. *p<0.05 compared to WT by student’s t-test. (i) GSH levels in wild-type (WT), Fyn-/- and Lyn-/- mouse red cells with and without diamide treatment. Data are presented as mean ± SD (n = 4); °p<0.02 compared to baseline by one-way ANOVA with Dunnet’s test for longitudinal comparison; p<0.05 compared to diamide treated wild-type red cells by two-way ANOVA test with Bonferroni correction for multiple comparisons. (For interpretation of the references to colour in this figure legend, the reader is referred to the Web version of this article.)
Fig. 5
Fig. 5
Primaquine treatment induces acute intravascular hemolytic crisis with severe red cell damage and accumulation of reduced Prx2, a NADPH dependent anti-oxidant system. (a) Morphology of red cells in May-Grunwald-Giemsa blood smears from wild-type (WT) and Fyn-/- mice in vivo treated with either vehicle or primaquine. The black arrows indicate red cell ghost and bitted erythrocytes. Red cells were imaged under oil at 100X magnification using a Panfluor objective with 1.30 numeric aperture on a Nikon Eclipse DS-5M camera and processed with Digital Slide (DS-L1) Nikon. One representative image out of 5 for each mouse strains with similar results is presented. (b) Hemoglobin, plasma hemoglobin and serum lactate dehydrogenase (LDH) in wild-type (WT) and Fyn-/- mice in vivo treated with either vehicle or primaquine. Data are shown as means ± SD (n = 5); *p< 0.05 compared to WT; °p<0.05 compared to vehicle treated animals. (c) Reactive oxygen species (ROS) levels in red cells from wild-type (WT) and Fyn-/- mice in vivo treated with either vehicle or primaquine. Data are presented as means ± SD (n = 5 from each strain); *p< 0.05 compared to WT; ° p<0.05 compared to vehicle treated animals. (d) Upper panel. Hemichromes (HMCs) bound to the membrane of red blood cells (RBCs) from wild-type (WT) and Fyn-/- mice in vivo treated with either vehicle or primaquine. Data are presented as means ± SD (n = 5 from each strain); *p< 0.05 compared to WT; ° p<0.05 compared to vehicle treated animals. Lower panel. Percentage of band 3 clusters in erythrocytes from wild-type (WT) and Fyn-/- mice in vivo treated with either vehicle or primaquine. Data are presented as means ± SD (n = 5 from each strain); *p< 0.05 compared to WT; ° p<0.05 compared to vehicle treated animals. (e) Quantification of microparticles (MPs) from wild-type (WT) and Fyn-/- mice in vivo treated with either vehicle or primaquine. Data are presented as means ± SD (n = 5 from each strain); *p< 0.05 compared to WT; ° p<0.05 compared to vehicle treated animals. (f) Western-blot (Wb) analysis under non-reducing condition (-βM: β-mercaptoethanol) with specific antibodies against peroxiredoxin-2 (Prx2) of red cell cytosol fractions from wild-type (WT) and Fyn-/- mice in vivo treated with either vehicle or primaquine. Prx2 monomers (M) and dimers (D) were detected. Catalase was used as loading control. * indicate non-specific signal due to Prx2 binding to hemoglobin chain. One representative gel out of 3 with similar results is presented. Densitometric analysis of immunoblots is shown in bar graph in Supplemental Fig. 5Sa. b-e. *p< 0.05 compared to WT; ° p<0.05 compared to vehicle treated animals by two-way ANOVA with Bonferroni correction for multiple comparisons. (For interpretation of the references to colour in this figure legend, the reader is referred to the Web version of this article.)
Fig. 6
Fig. 6
Fyn-/-mouse red cells exposed to oxidation display accumulation of reduced Prx2 as dimers and polymers. (a) In red cells, we propose that Fyn acts as redox sensor, modulating intracellular response to oxidation by phosphorylation of G6PD, which contributes through NADP-NADPH to thioredoxin reductase activity and Prx2 recycling. This reduces hemoglobin oxidation and the generation of reactive oxygen species (ROS), preventing the generation and translocation to the membrane of hemichromes (HMCs) that promotes band 3 (B3) clusterization and hemolysis. (b) Western-blot (Wb) analysis under non-reducing condition (-βM: β-mercaptoethanol) with specific antibodies against peroxiredoxin-2 (Prx2) of red cell cytosol fractions from wild-type (WT) and Fyn-/- mice with or without diamide (NT: not-treated). Prx2 monomers (M), dimers (D) and polymers (P) were detected. Catalase was used as loading control. One representative gel from 4 with similar results is presented. Densitometric analysis of immunoblots is shown in bar graph on the right. Data are expressed as Dimers/monomers or Polymers/monomers ratio. Results are presented as means ± SD (n = 4 from each strains); *p<0.05 compared to non-treated cells; °p<0.02 compared to WT red cells. (c) Western-blot (Wb) analysis under non-reducing condition (-βM: β-mercaptoethanol) with specific antibody against peroxiredoxin-2 (Prx2) of wild-type (WT) and Fyn-/−mouse red cell cytosol fractions exposed to diamide and treated with DTT either before (Pre-DTT) or during (DTT) oxidation. Prx2 monomers (M), dimers (D) and polymers (P) were detected. Twin gels stained with colloidal Commassie were used as protein loading control One representative gel from 4 with similar results is presented (see Fig. 5Sb). Densitometric analysis of immunoblots is shown in bar graph on the right. Data are expressed as Dimers/monomers or Polymers/monomers ratio. Results are presented as means ± SD (n = 4 from each strains); *p<0.05 compared to WT; °p<0.02 compared to diamide treated red cells. b-c. *p<0.05 compared to WT; °p<0.02 compared to diamide treated red cells by two-way ANOVA with Bonferroni correction for multiple comparisons. (d) Recycling of Prx2 dimers and polymers in cytosol fraction from red cells of wild-type (WT) and Fyn-/−mice exposed to diamide and analyzed at baseline (0) and at 15, 30, 60 min after diamide incubation. Prx2 monomers (M), dimers (D) and polymers (P) were detected on immunoblots and Densitometric analysis was carried out to determine Dimers/monomers or Polymers/monomers ratio. Results are presented as means ± SD (n = 4 from each strains); *p<0.05 compared to WT by two-way ANOVA test with Bonferroni correction for multiple comparisons; °p<0.02 compared to baseline by one-way ANOVA with Dunnet’s test for longitudinal comparison. (For interpretation of the references to colour in this figure legend, the reader is referred to the Web version of this article.)
Fig. 7
Fig. 7
Reduced Prx2 recycling in response to oxidation characterized red cells from G6PD Mediterranean and Genova patients. (a) Western-blot (Wb) analysis with specific antibody against peroxiredoxin SO3 of cytosol fractions from diamide treated red cells of healthy and G6PD-Mediterranean and G6PD-Genova subjects. Catalase was used as loading control. One representative gel from 5 with similar results is presented. Lower panel. Densitometric analysis of immunoblots is shown in bar graph. Data are presented as means ± SD (n = 5 from each strains); *p<0.05 compared to healthy red blood cells by Student’s t-test. (b) Western-blot (Wb) analysis under non-reducing condition (-βM: β-mercaptoethanol) with specific antibody against peroxiredoxin-2 (Prx2) of red cell cytosol fractions from healthy and G6PD deficient subjects treated with or without diamide (NT: not-treated). Prx2 monomers (M), dimers (D) and polymers (P) were detected. Catalase was used as loading control. One representative gel from 6 with similar results is presented. Densitometric analysis of immunoblots is reported on the right. Dimers/monomers or Polymers/monomers ratio. Results are presented as means ± SD (n = 5); *p<0.05 compared to healthy red blood cells; °p<0.02 compared to NT by two-way ANOVA test with Bonferroni correction for multiple comparisons. (c) Western-blot (Wb) analysis under non-reducing condition (-βM: β-mercaptoethanol) with specific antibody against peroxiredoxin-2 (Prx2) of red cell cytosol fractions from healthy and G6PD deficient subjects treated with or without diamide (NT: not-treated). Prx2 monomers (M), dimers (D) and polymers (P) were detected. Catalase was used as loading control. One representative gel from 3 with similar results is presented. Densitometric analysis of immunoblots is reported on the right. Dimers/monomers or Polymers/monomers ratio. Results are presented as means ± SD (n = 3); *p<0.05 compared to healthy red blood cells; °p<0.02 compared to NT by two-way ANOVA test with Bonferroni correction for multiple comparisons. (d) Schematic diagram on the role of Fyn as redox sensor in red cells exposed to oxidative stress. The activation of Fyn phosphorylates G6PD on Tyr 401, resulting in more efficient catalytic conformation, supporting the generation of NADP-NADPH. This is required for both GSH and Prx2 recycling to scavenge peroxides, preventing red cell lysis. (For interpretation of the references to colour in this figure legend, the reader is referred to the Web version of this article.)
Fig. S1
Fig. S1
Fig. S2
Fig. S2
Fig. S3
Fig. S3
Fig. S4
Fig. S4
Fig. S5
Fig. S5
Fig. S6
Fig. S6
Fig. S7
Fig. S7

References

    1. Cappellini M.D., Fiorelli G. Glucose-6-phosphate dehydrogenase deficiency. Lancet. 2008;371:64–74. - PubMed
    1. Luzzatto L., Arese P. Favism and glucose-6-phosphate dehydrogenase deficiency. N. Engl. J. Med. 2018;378:1068–1069. - PubMed
    1. Naylor C.E., Rowland P., Basak A.K., Gover S., Mason P.J., Bautista J.M., Vulliamy T.J., Luzzatto L., Adams M.J. Glucose 6-phosphate dehydrogenase mutations causing enzyme deficiency in a model of the tertiary structure of the human enzyme. Blood. 1996;87:2974–2982. - PubMed
    1. Notaro R., Afolayan A., Luzzatto L. Human mutations in glucose 6-phosphate dehydrogenase reflect evolutionary history. Faseb. J. 2000;14:485–494. - PubMed
    1. Scott M.D., Wagner T.C., Chiu D.T. Decreased catalase activity is the underlying mechanism of oxidant susceptibility in glucose-6-phosphate dehydrogenase-deficient erythrocytes. Biochim. Biophys. Acta. 1993;1181:163–168. - PubMed

Publication types

Substances