. 2020 Sep:36:101633.
doi: 10.1016/j.redox.2020.101633. Epub 2020 Jul 9.

Low-protein/high-carbohydrate diet induces AMPK-dependent canonical and non-canonical thermogenesis in subcutaneous adipose tissue

Affiliations

Low-protein/high-carbohydrate diet induces AMPK-dependent canonical and non-canonical thermogenesis in subcutaneous adipose tissue

Katia Aquilano et al. Redox Biol. 2020 Sep.

Abstract

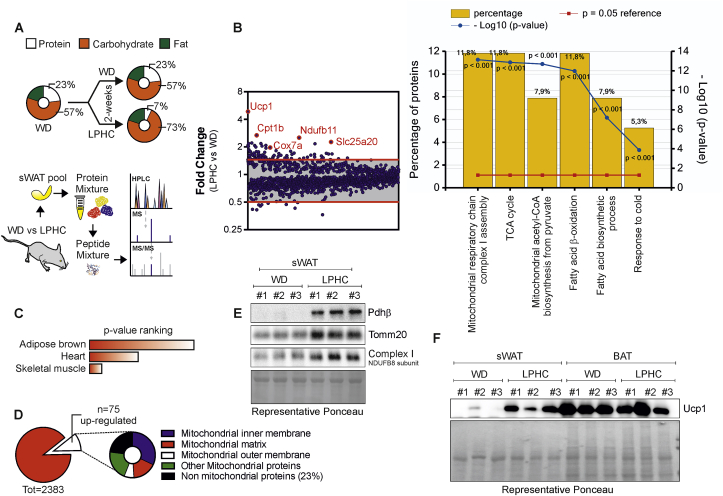
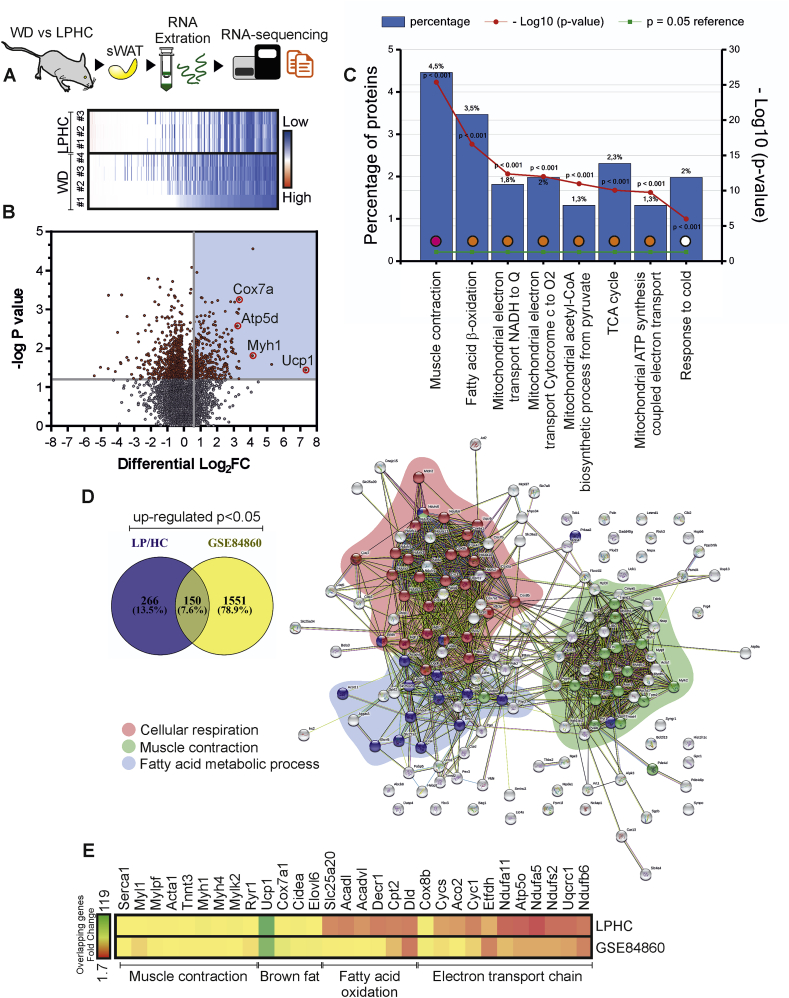
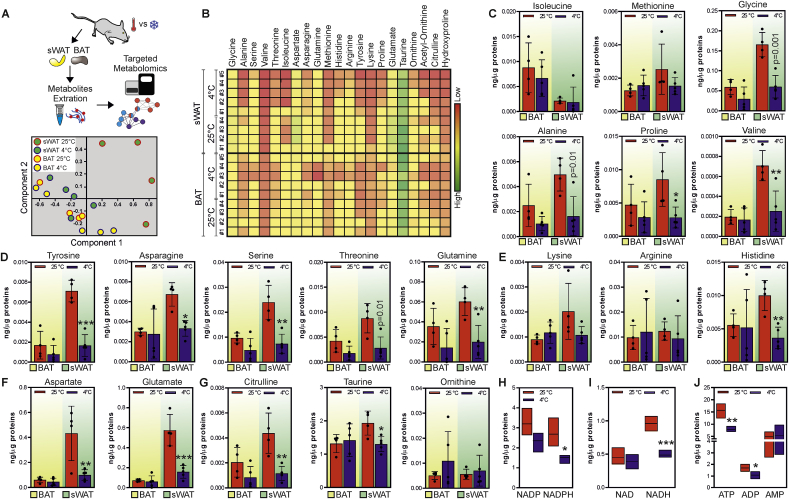
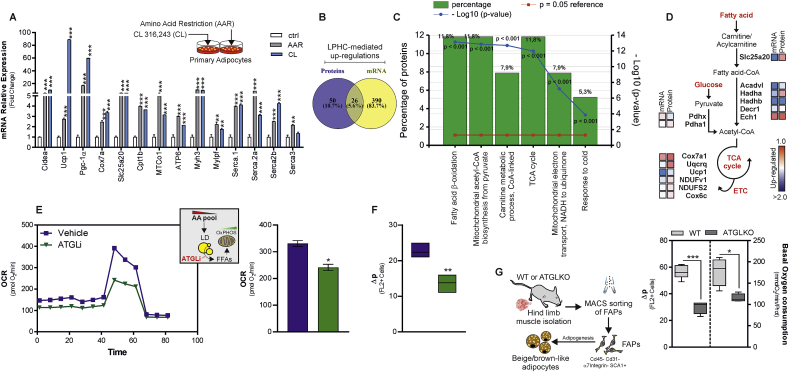
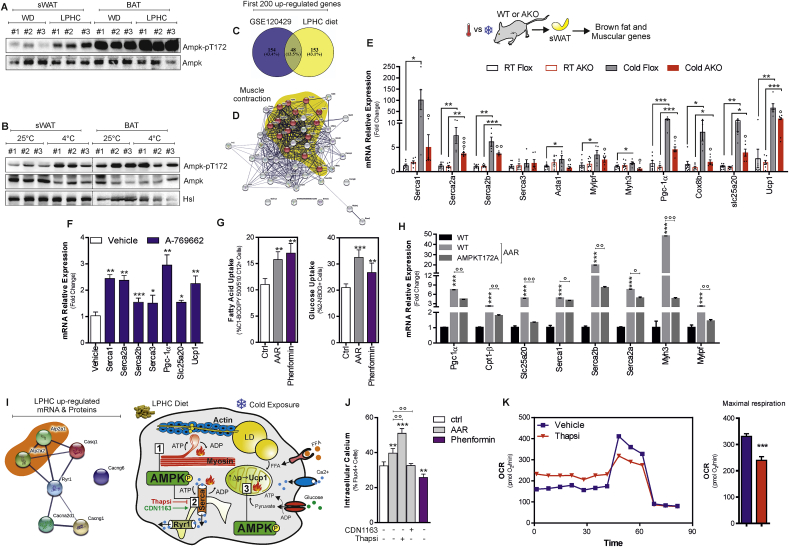
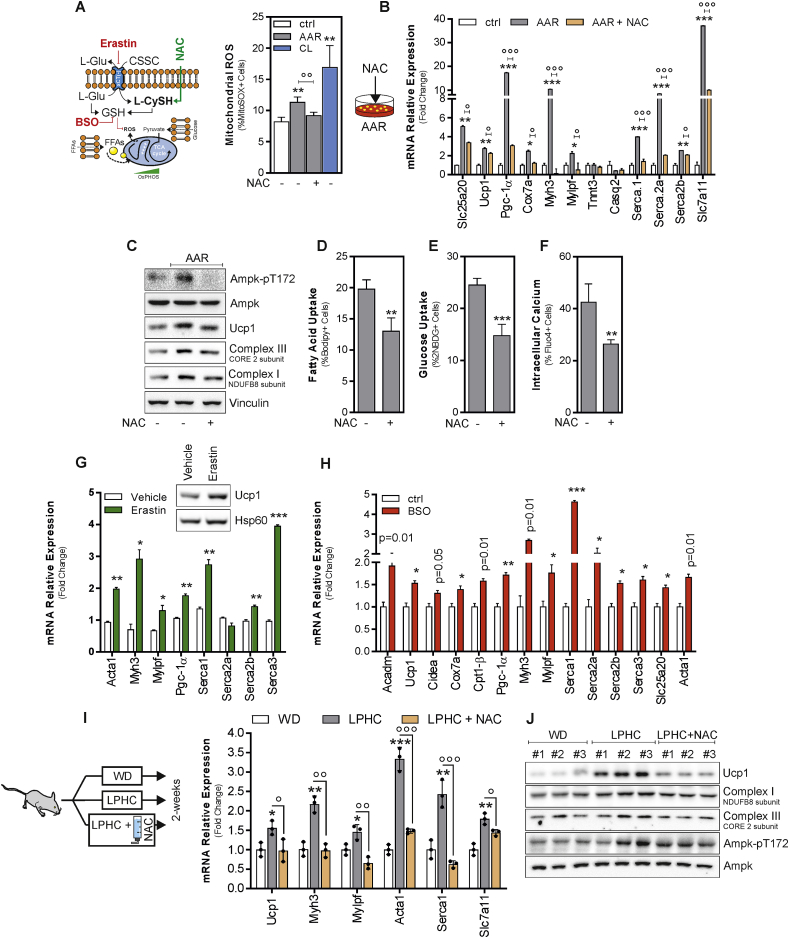
Low-protein/high-carbohydrate (LPHC) diet has been suggested to promote metabolic health and longevity in adult humans and animal models. However, the complex molecular underpinnings of how LPHC diet leads to metabolic benefits remain elusive. Through a multi-layered approach, here we observed that LPHC diet promotes an energy-dissipating response consisting in the parallel recruitment of canonical and non-canonical (muscular) thermogenic systems in subcutaneous white adipose tissue (sWAT). In particular, we measured Ucp1 induction in association with up-regulation of actomyosin components and several Serca (Serca1, Serca2a, Serca2b) ATPases. In beige adipocytes, we observed that AMPK activation is responsible for transducing the amino acid lowering in an enhanced fat catabolism, which sustains both Ucp1-and Serca-dependent energy dissipation. Limiting AMPK activation counteracts the expression of brown fat and muscular genes, including Ucp1 and Serca, as well as mitochondrial oxidative genes. We observed that mitochondrial reactive oxygen species are the upstream molecules controlling AMPK-mediated metabolic rewiring in amino acid-restricted beige adipocytes. Our findings delineate a novel metabolic phenotype of responses to amino acid shortage, which recapitulates some of the benefits of cool temperature in sWAT. In conclusion, this highlights LPHC diet as a valuable and practicable strategy to prevent metabolic diseases through the enhancement of mitochondrial oxidative metabolism and the recruitment of different energy dissipating routes in beige adipocytes.

Keywords: Metabolism; Mitochondria; Serca; Systems physiology; Ucp1.


Conflict of interest statement

The authors of this article just submitted to your journal, deny any financial or other relationships with drug manufacturers that could lead to a conflict of interest.

Figures

Fig. 1
Fig. 1
LPHC diet promotes brown fat-like features in sWAT. A. Schematic representation of the experimental plan and differentially expressed proteins (FC > 1.5) from whole proteome profiling in a pool of sWAT isolated from adult male mice fed with WD (n = 8 mice) or LPHC (n = 6 mice) for 2 weeks. Orange circles were used to mark the most over-represented proteins. B. Functional enrichment analysis of over-represented proteins in LPHC fed mice. GO terms for biological processes are reported. C. Over-represented proteins in LPHC fed mice were analyzed using Tissue Atlas through the web-based Enrichr bioinformatics tool and sorted by rank based ranking. D. Functional enrichment analysis of over-represented proteins in LPHC fed mice. GO terms for cellular components are reported. E. Representative immunoblots of mitochondrial proteins in sWAT of mice fed with WD or LPHC diet for 2 weeks. Ponceau staining was used as loading control. F. Representative immunoblots of Ucp1 protein in sWAT and BAT of mice fed with WD or LPHC diet for 2 weeks. Ponceau staining was used as loading control. (For interpretation of the references to colour in this figure legend, the reader is referred to the Web version of this article).
Fig. 2
Fig. 2
Muscular gene induction accompanies sWAT browning. A. Schematic representation of the experimental plan and RNA-sequencing of sWAT isolated from adult male mice fed with a WD (n = 4 mice) or LPHC diet (n = 3 mice) for 2 weeks. Raw RPKM expression values are represented as a heatmap. B. Volcano plot representing differentially expressed genes in sWAT isolated from adult male mice fed with LPHC diet (n = 3 mice) for 2 weeks versus WD (n = 4 mice). Up-regulated genes (Log2FC > 0.58, p < 0.05; n = 416, blue area) were reported. C. Functional enrichment analysis of up-regulated gene transcripts in LPHC fed mice. GO terms for biological processes are reported. D, E. Venn diagram of up-regulated gene transcripts in sWAT following cold exposure (GSE84860) or LPHC diet. Protein-protein interaction network of overlapped genes (150 genes) was evidenced by STRING (https://string-db.org) setting an interaction score of 0.400. Genes clustered for the main biological processes were reported in the coloured areas (D). Representative common gene transcripts were reported as raw data in a heatmap (E). (For interpretation of the references to colour in this figure legend, the reader is referred to the Web version of this article).
Fig. 3
Fig. 3
Cool temperature induces amino acid loss in sWAT. A. Schematic representation of the experimental plan and Principal Component Analysis (PCA) of the metabolites measured in sWAT and BAT of mice exposed to room temperature (25 °C, n = 4 mice) or cool temperature (4 °C, n = 5 mice) for 24 h. Coloured dots represent individual samples. B. Heatmap of biologically major amino acids measured in sWAT and BAT of mice exposed to room temperature (25 °C, n = 4 mice) or cool temperature (4 °C, n = 5 mice) for 24 h. C-G. Single amino acid abundance measured in sWAT (green area) and BAT (yellow area) of mice exposed to room temperature (25 °C, n = 4 mice) or cool temperature (4 °C, n = 5 mice) for 24 h. Data are presented as mean ± S.D. *p < 0.05; **p < 0.01; ***p < 0.001 25 °C vs 4 °C. H-J. Metabolites targeting energy metabolism were measured in sWAT (green area) and BAT (yellow area) of mice exposed to room temperature (25 °C, n = 4 mice) or cool temperature (4 °C, n = 5 mice) for 24 h. Data are presented as mean ± S.D. *p < 0.05; **p < 0.01; ***p < 0.001 25 °C vs 4 °C. (For interpretation of the references to colour in this figure legend, the reader is referred to the Web version of this article).
Fig. 4
Fig. 4
Limiting amino acids enhances Atgl-mediated fatty acid oxidation in beige adipocytes. A. Single gene expression analysis in primary beige adipocytes cultured in a medium poor in amino acids (AAR) or adrenergically stimulated by CL316,243 (CL). Data shown are the result of 3 separate experiments. Data are presented as mean ± S.D. ***p < 0.001 AAR or CL vs Ctr. B-D. Venn diagram of up-regulated gene transcripts and proteins in sWAT isolated from adult male mice fed with LPHC diet (n = 3 mice) for 2 weeks (B). Functional enrichment analysis of overlapped genes (n = 61) and the relative GO terms for biological processes are reported (C). Schematic representation of key metabolic enzymes over-represented in sWAT (n = 61) related to fatty acid oxidation, TCA cycle, ETC and glycolysis pathways. For each enzyme, the corresponding LPHC-induced changes in either mRNA or protein concentration were reported as a heatmap (D). E. Seahorse analysis of X9 beige adipocytes cultured in a medium poor in amino acids (AAR) supplemented with Atgl inhibitor Atglistatin (ATGLi) or vehicle. The oxygen consumption rate (OCR) (pmol/min) was monitored and maximal respiration is reported in the bar graphs. Reported data are the result of 3 separate experiments. Data are presented as mean ± S.D. **p < 0.01 ATGLi vs vehicle. F. Mitochondrial proton gradient (Δp) was measured by cytofluorimetry after staining with MitoTracker Red CMXRos in X9 beige adipocytes cultured in a medium poor in amino acids (AAR) supplemented with Atgl inhibitor Atglistatin (ATGLi) or vehicle. Reported data are the result of 3 separate experiments. Data are presented as mean ± S.D. **p < 0.01 ATGLi vs vehicle. G. Schematic representation of FAPs isolated from WT or AtglKO mice. Mitochondrial proton gradient (Δp) and basal oxygen consumption were measured. Reported data are the result of 3 separate experiments. Data are presented as mean ± S.D. *p < 0.05; ***p < 0.001 AtglKO vs WT (Student t-test). (For interpretation of the references to colour in this figure legend, the reader is referred to the Web version of this article).
Fig. 5
Fig. 5
AMPK controls brown fat and muscular genes in sWAT. A. Representative immunoblots of AMPK (basal and phosphorylated) in sWAT and BAT of mice fed with WD (n = 4 mice) or LPHC diet (n = 3 mice) for 2 weeks. B. Representative immunoblots of AMPK (basal and phosphorylated) in sWAT and BAT of mice at room temperature (25 °C, n = 4 mice) or exposed to cold (4 °C, n = 5 mice) for 24 h. Hsl was used as loading control. C, D. Venn diagram of the 200 up-regulated gene transcripts obtained from sWAT of mice fed LPHC diet or with constitutively activated AMPK in adipose tissue (GSE120429) (C). Protein-protein interaction network of overlapped genes (n = 48) was evidenced by STRING (https://string-db.org) setting an interaction score of 0.400. Yellow area reports the genes clustering muscle contraction GO (D). E. Single gene expression analysis in sWAT isolated from Flox or AKO mice exposed to room (22 °C) or cool temperature (4 °C) for 48 h. Data are presented as mean ± S.D. *p < 0.05, ***p < 0.001; ∘p < 0.05, ∘∘p < 0.01, ∘∘∘p < 0,001. F. Single gene expression analysis in primary beige adipocytes treated with AMPK agonist (10 μM A-769662). Reported data are the result of 3 separate experiments. Data are presented as mean ± S.D. ***p < 0.001, **p < 0.01, *p < 0.05 A-769662 vs vehicle). G. Glucose and fatty acid uptake were measured in primary beige adipocytes. Reported data are the result of 3 separate experiments. Data are presented as mean ± S.D. ***p < 0.001, **p < 0.01 AAR or Phenformin vs Ctrl. H. Single gene expression analysis in WT and AMPKT172A X9 beige adipocytes cultured in a medium poor in amino acids (AAR). Reported data are the result of 3 separate experiments. Data are presented as mean ± S.D. ***p < 0.001 WT AAR vs WT; ∘p < 0.05, ∘∘p < 0.01, ∘∘∘p < 0.001 AMPKT172A AAR vs WT AAR. I. Protein-protein interaction network of up-regulated genes controlling calcium cycle in sWAT following LPHC diet was evidenced. J. Intracellular calcium flux was measured in primary beige adipocytes by cytofluorimetry. Reported data are the result of 3 separate experiments. Data are presented as mean ± S.D. ***p < 0.001, **p < 0.01 AAR or Phenformin vs Ctrl; ∘∘p < 0.01 Thapsigargin (Thapsi) or CDN1163 vs AAR. K. Seahorse analysis of X9 beige adipocytes cultured in a medium poor in amino acids (AAR) treated with the SERCA inhibitor Thapsigargin (Thapsi) or vehicle. The oxygen consumption rate (OCR) (pmol/min) was monitored and maximal respiration is reported in the bar graphs. Reported data are the result of 3 separate experiments. Data are presented as mean ± S.D. ***p < 0.001 Thapsi vs vehicle. (For interpretation of the references to colour in this figure legend, the reader is referred to the Web version of this article).
Fig. 6
Fig. 6
Amino acid restriction perturbs redox homeostasis triggering brown and muscular gene induction in beige adipocytes. A. Schematic representation of the experimental plan; mitochondrial ROS in X9 beige adipocytes cultured in a medium poor in amino acid (AAR) with NAC or vehicle were measured by cytofluorimetry. Reported data are the result of 3 separate experiments. Data are presented as mean ± S.D. **p < 0.01 AAR or CL vs control; ∘∘p < 0.01 AAR with NAC vs AAR. B. Single gene expression analysis in X9 beige adipocytes cultured in a medium poor in amino acids (AAR) supplemented with NAC or vehicle. Reported data are the result of 3 separate experiments. Data are presented as mean ± SD. ***p < 0.001, **p < 0.01 AAR vs Ctrl; ∘p < 0.05, ∘∘∘p < 0.001 AAR with NAC vs AAR. C. Representative immunoblots of AMPK (basal and phosphorylated), Ucp1, mitochondrial complex III and I subunits in X9 beige adipocytes cultured in a medium poor in amino acids (AAR) supplemented with NAC or vehicle. Vinculin was used as loading control. D-F. Fatty acid (D), glucose (E) and calcium (F) uptake in X9 beige adipocytes cultured in a medium poor in amino acids (AAR) supplemented with NAC or vehicle were measured by cytofluorimetry. Reported data are the result of 3 separate experiments. Data are presented as mean ± S.D. ***p < 0.001, **p < 0.01 AAR NAC vs control. G, H. Representative immunoblots of Ucp1 and single gene expression analysis in X9 beige adipocytes treated with Erastin (G) or BSO (H). Hsp60 was used as loading control (G). Reported data are the result of 3 separate experiments. Data are presented as mean ± S.D. ***p < 0.001, **p < 0.01, *p < 0.05 Erastin or BSO vs vehicle. I, J. Single gene expression analysis (I) and representative immunoblots (J) of AMPK (basal and phosphorylated), Ucp1, mitochondrial complex III and I subunits in sWAT from mice fed WD (n = 3), LPHC diet (n = 3) or LPHC diet plus NAC. AMPK was used as loading control. Data are presented as mean ± S.D. ***p < 0.001, LPHC vs WD; ∘∘∘p < 0.001, ∘∘p < 0.01 LPHC plus NAC vs LPHC. (For interpretation of the references to colour in this figure legend, the reader is referred to the Web version of this article).

References

    1. Wu J., Bostrom P., Sparks L.M., Ye L., Choi J.H., Giang A.H., Khandekar M., Virtanen K.A., Nuutila P., Schaart G., Huang K., Tu H., van Marken Lichtenbelt W.D., Hoeks J., Enerback S., Schrauwen P., Spiegelman B.M. Beige adipocytes are a distinct type of thermogenic fat cell in mouse and human. Cell. 2012;150:366–376. - PMC - PubMed
    1. Petrovic N., Walden T.B., Shabalina I.G., Timmons J.A., Cannon B., Nedergaard J. Chronic peroxisome proliferator-activated receptor gamma (PPARgamma) activation of epididymally derived white adipocyte cultures reveals a population of thermogenically competent, UCP1-containing adipocytes molecularly distinct from classic brown adipocytes. J. Biol. Chem. 2010;285:7153–7164. - PMC - PubMed
    1. Aldiss P., Betts J., Sale C., Pope M., Budge H., Symonds M.E. Exercise-induced 'browning' of adipose tissues. Metabolism. 2018;81:63–70. - PMC - PubMed
    1. Wang W., Seale P. Control of brown and beige fat development. Nat. Rev. Mol. Cell Biol. 2016;17:691–702. - PMC - PubMed
    1. Lettieri-Barbato D. Redox control of non-shivering thermogenesis. Mol Metab. 2019;25:11–19. - PMC - PubMed

Publication types

Substances