. 2020 Sep:36:101634.
doi: 10.1016/j.redox.2020.101634. Epub 2020 Jul 8.

Annexin A5 regulates hepatic macrophage polarization via directly targeting PKM2 and ameliorates NASH

Affiliations

Annexin A5 regulates hepatic macrophage polarization via directly targeting PKM2 and ameliorates NASH

Fang Xu et al. Redox Biol. 2020 Sep.

Abstract

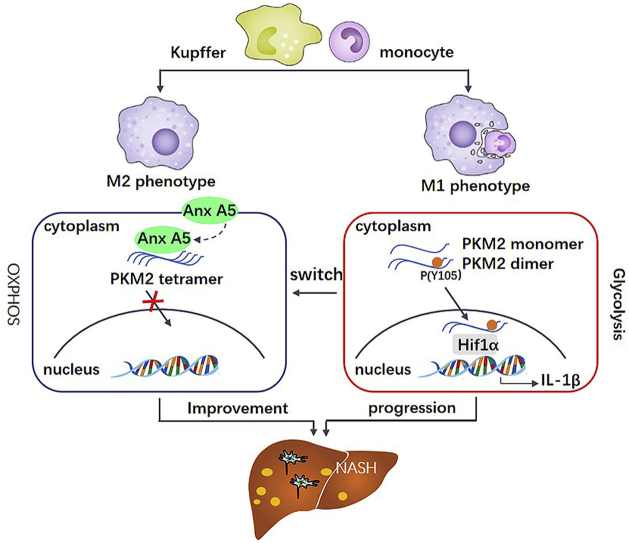
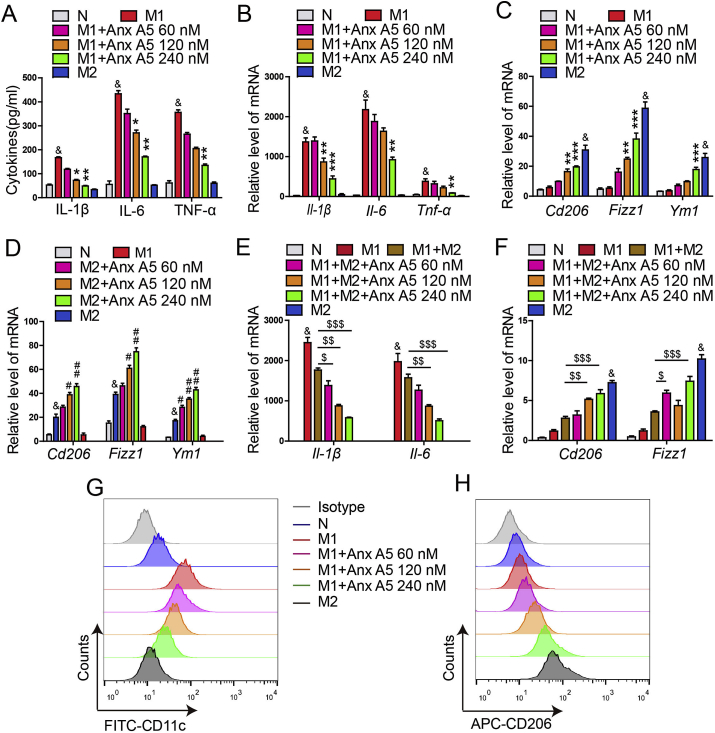
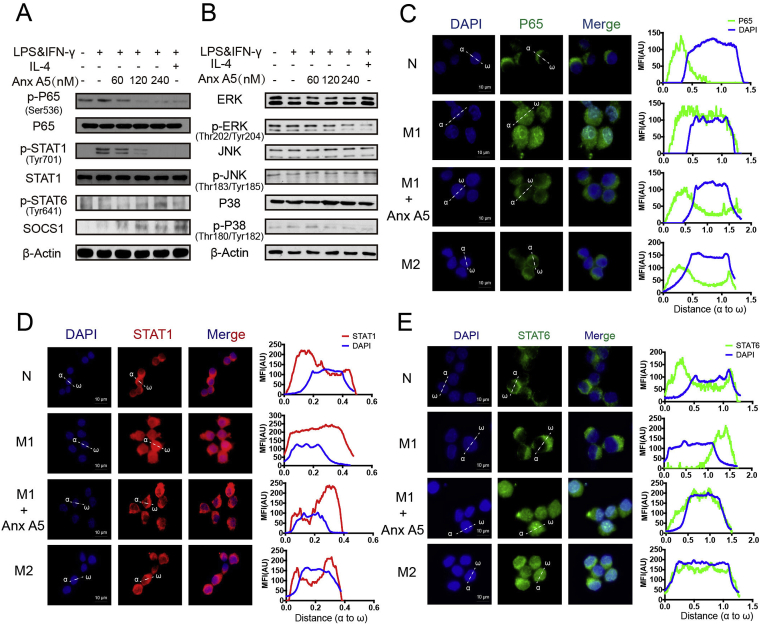
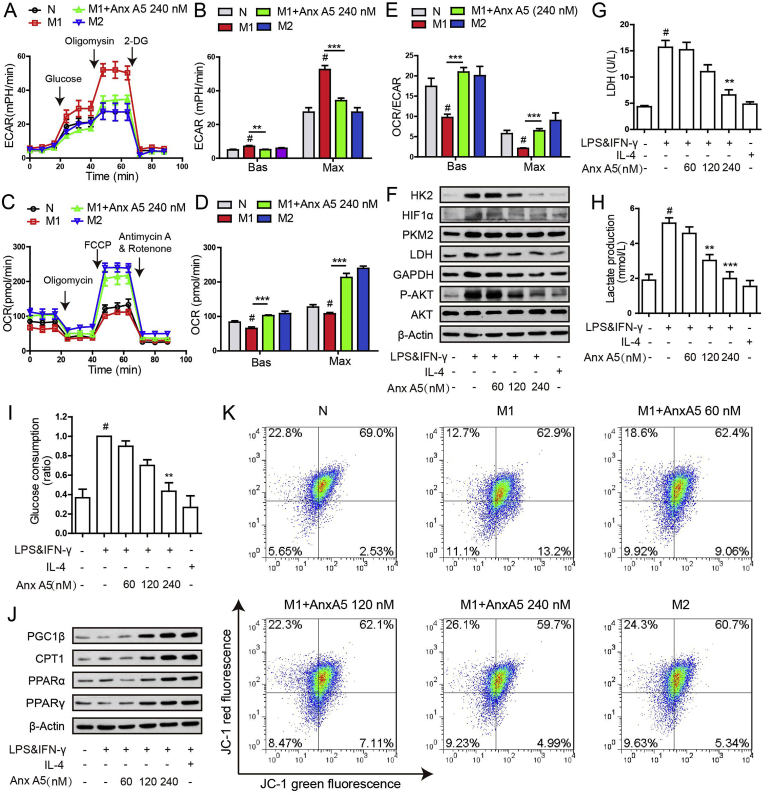
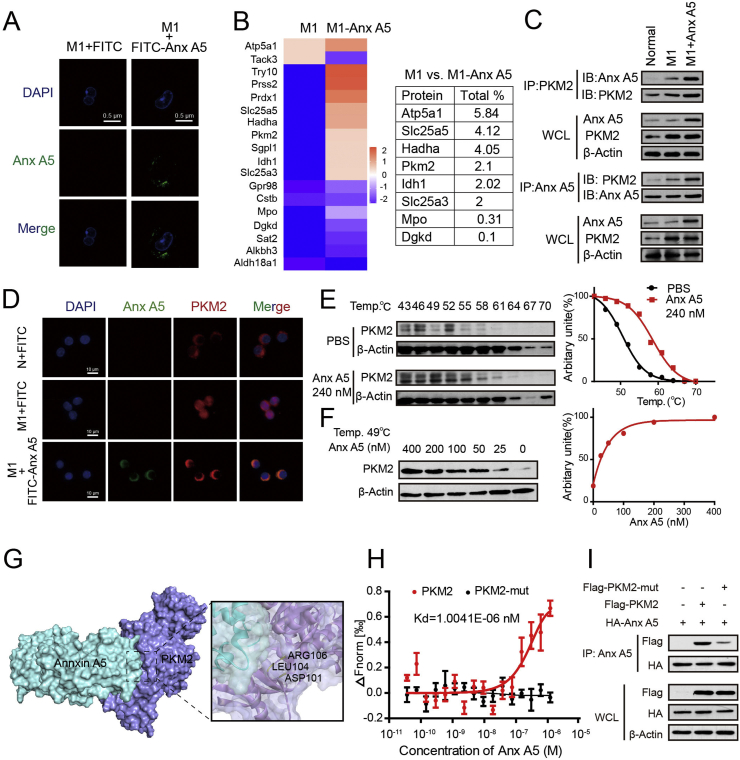
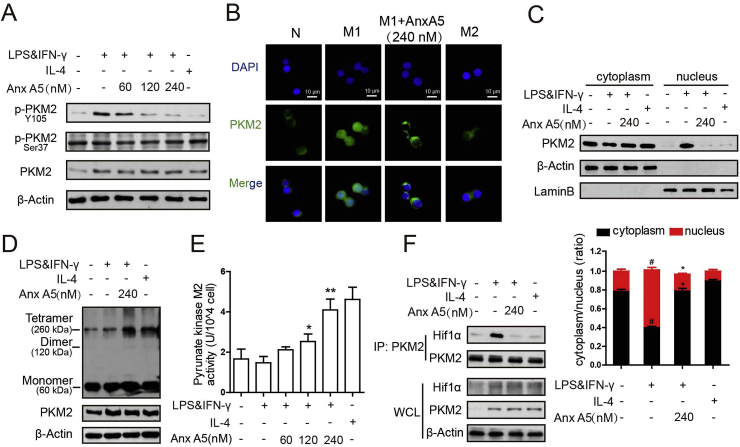
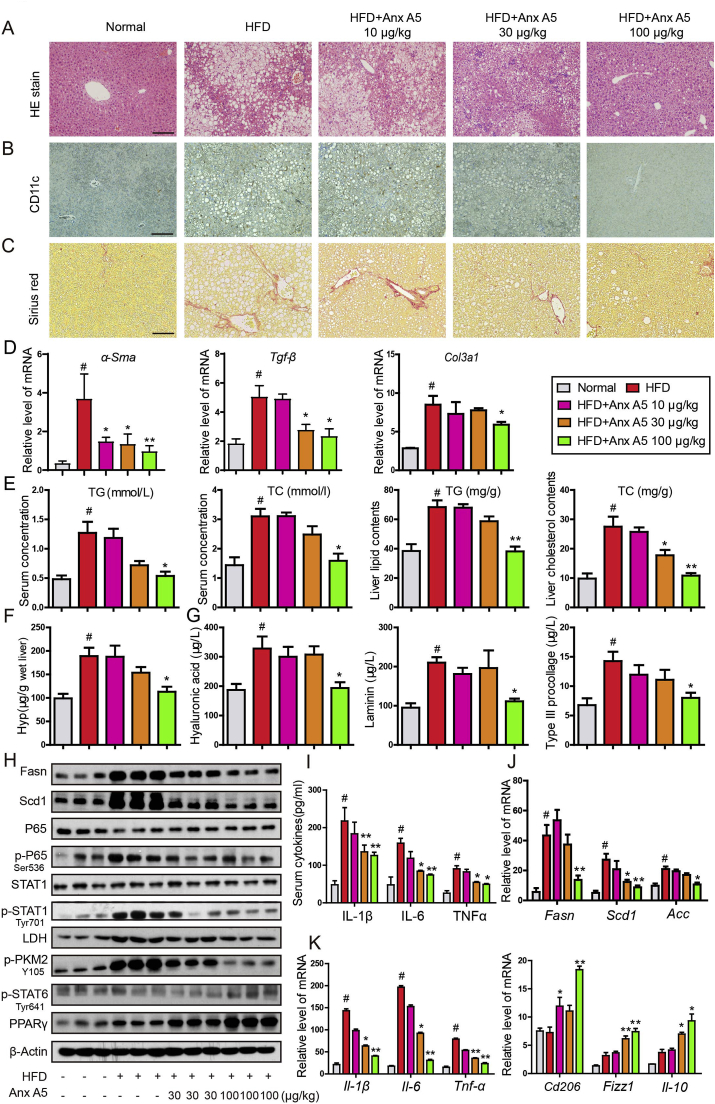
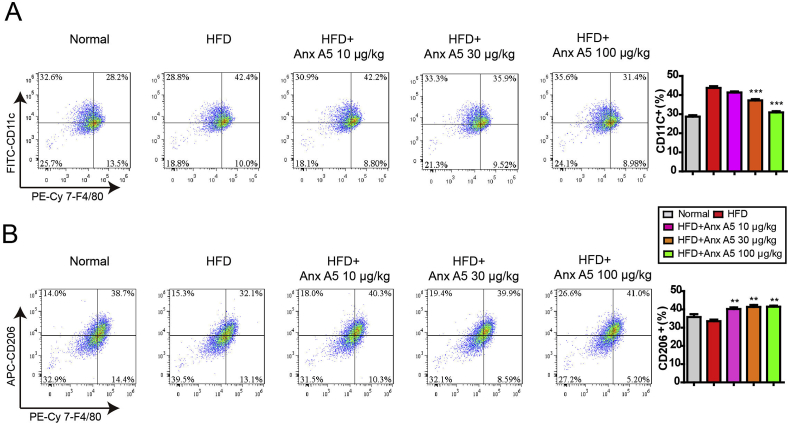
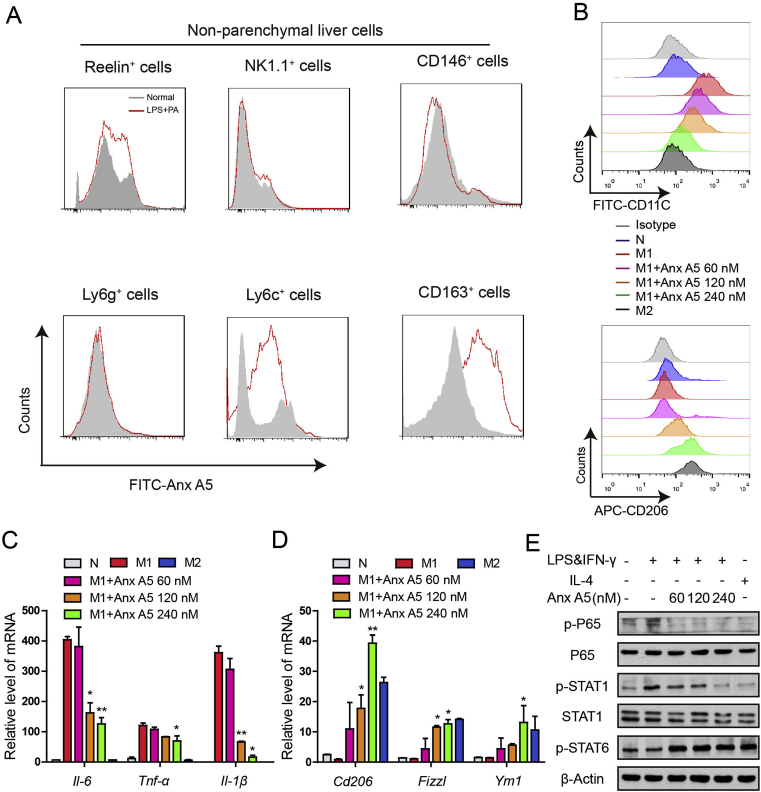
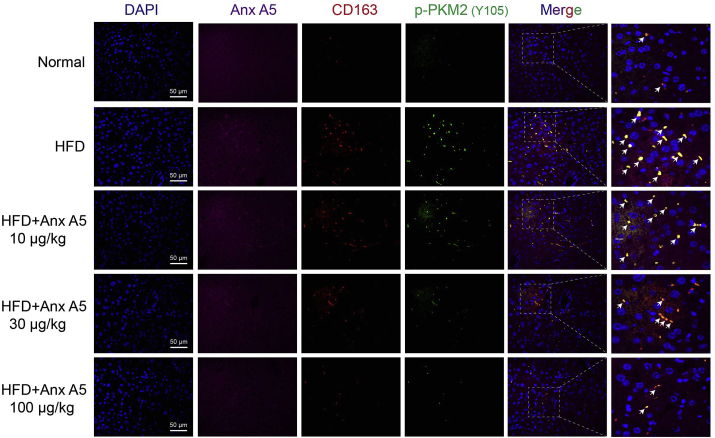
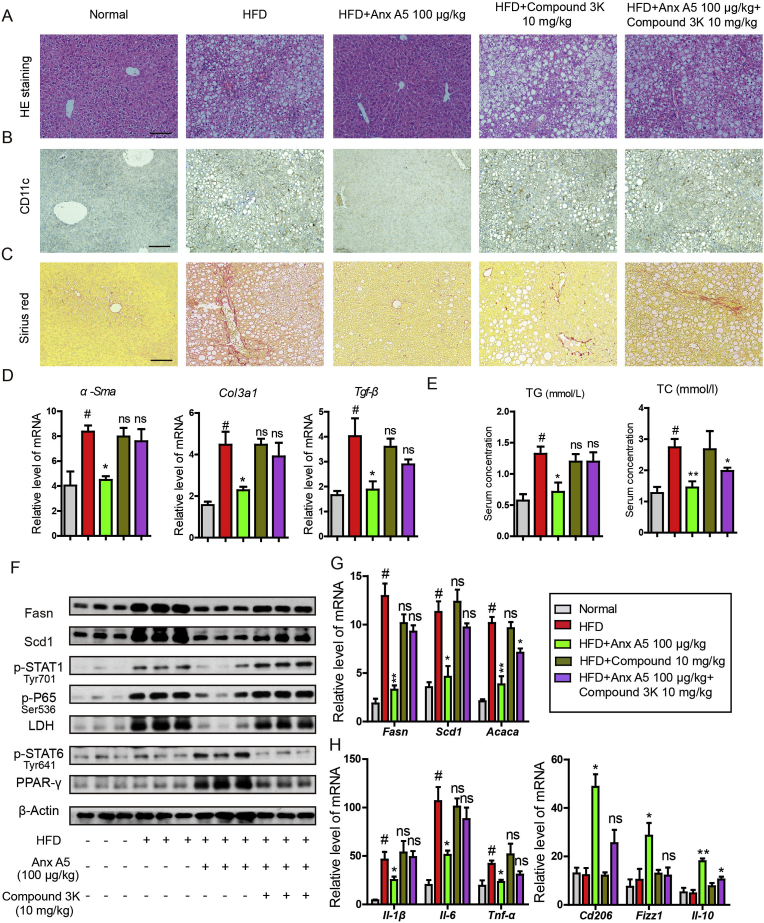
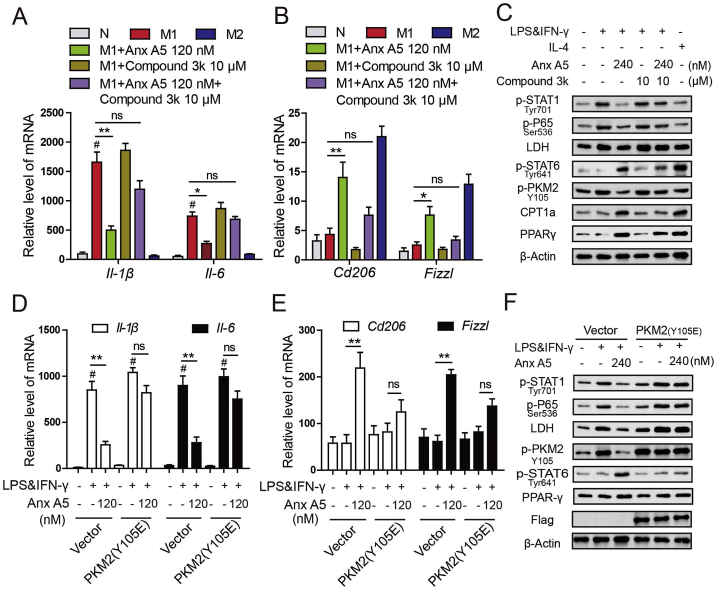
Nonalcoholic steatohepatitis (NASH), the progressive form of nonalcoholic fatty liver disease (NAFLD), is becoming a common chronic liver disease with the characteristics of steatosis, inflammation and fibrosis. Macrophage plays an important role in the development of NASH. In this study, Annexin A5 (Anx A5) is identified with the special effect on hepatic macrophage phenotype shift from M1 to M2. And it is further demonstrated that Anx A5 significantly switches metabolic reprogramming from glycolysis to oxidative phosphorylation in activated macrophages. Mechanistically, the main target of Anx A5 in energy metabolism is confirmed to be pyruvate kinase M2 (PKM2). And we following reveal that Anx A5 directly interacts with PKM2 at ASP101, LEU104 and ARG106, inhibits phosphorylation of Y105, and promotes PKM2 tetramer formation. In addition, based on the results of PKM2 inhibitor (compound 3k) and the phosphorylated mutation (PKM2 (Y105E)), it is proved that Anx A5 exhibits the function in macrophage polarization dependently on PKM2 activity. In vivo studies also show that Anx A5 improves steatosis, inflammation and fibrosis in NASH mice due to specially regulating hepatic macrophages via interaction with PKM2. Therefore, we have revealed a novel function of Anx A5 in hepatic macrophage polarization and HFD-induced NASH, providing important insights into the metabolic reprogramming, which is important for NASH therapy.

Keywords: Annexin A5 (Anx A5); Macrophage polarization; Metabolic reprogramming; NASH; PKM2.


Conflict of interest statement

The authors declare that they have no conflicts of interest concerning this article.

Figures

Image 1
Graphical abstract
Fig. 1
Fig. 1
Anx A5 promoted macrophage phenotype shift from M1 to M2. (A) BMDMs were treated with various doses of Anx A5 (60, 120, 240 nM) in the presence of 10 ng/ml LPS and 10 ng/ml IFN-γ, or 20 ng/ml IL-4 for 6 h, cytokines release of Il-1β, Il-6, Tnf-α in supernatant were measured by ELISA. (B–F). mRNA levels of Il-1β, Il-6, Tnf-α, Cd206, Fizzl, Ym1 were determined by quantitative PCR. (B–C) Anx A5 decreased M1-related gene expression, and simultaneously increased M2-related gene expression in M1 macrophages. (D) Anx A5 increased M2-related gene expression in M2 macrophages. (E–F) Anx A5 promoted the mixed macrophage to M2 phenotype, not M1 phenotype. (G–H) CD11c+ and CD206+ cells were measured by flow cytometry. Date are represented as mean ± SEM of three independent experiments. &P < 0.05 vs normal group; *P < 0.05, **P < 0.01, ***P < 0.001 vs. M1 group. #P < 0.05, ##P < 0.01 vs. M2 group; $P < 0.05, $$P < 0.01, $$$P < 0.001 vs. M1 and M2 mixed group.
Fig. 2
Fig. 2
Anx A5 blocked NF-kB and STAT1 signals, and activated STAT6 signals. BMDMs were incubated with various doses of Anx A5 (60, 120, 240 nM) in the presence of 10 ng/ml LPS and 10 ng/ml IFN-γ, or 20 ng/ml IL-4 for 6 h. (A–B) Expression of p-P65, P65, p-STAT1, STAT1, p-STAT6, SOCS1, ERK, p-ERK, JNK, p-JNK, P38, p-P38 and β-actin was determined by Western blot. β-actin was a loading control. (C–E) Cells were treated with 240 nM Anx A5 in the presence of 10 ng/ml LPS and 10 ng/ml IFN-γ or 20 ng/ml IL-4 for 6 h, and the localization of P65 (C), STAT1 (D), STAT6 (E) were analyzed by immunofluorescence staining. The nuclei were stained with DAPI (blue). The line charts represent fluorescence intensity (MFI), which is presented the distance from α to ω in the images. Scale bar, 10 μm. Date of western blot are the representatives of three independent experiments. Pictures of immunofluorescence are the representatives of five different visual fields. . (For interpretation of the references to colour in this figure legend, the reader is referred to the Web version of this article.)
Fig. 3
Fig. 3
Anx A5 attenuated M1 macrophage glycolysis and enhanced OXPHOS and fatty oxidation. BMDMs were seeded in a Seahorse XF96 analyzer culture plates and treated with Anx A5 (240 nM) in the presence of 10 ng/ml LPS and 10 ng/ml IFN-γ or 20 ng/ml IL-4 for 6 h. Real-time rate changes in extracellular acidification rate (ECAR) (A) and oxygen consumption (OCR) (C) were analyzed under basal conditions and then with sequential additions of various agonist and inhibitors at the indicated times. Basic and maximum capacity of ECAR (B) and OCR (D) were shown. (E) OCR/ECAR was analyzed. (F) Cells were incubated with various dose of Anx A5 in the presence of 10 ng/ml LPS and 10 ng/ml IFN-γ or 20 ng/ml IL-4 for 6 h. Expression of HK2, HIF1α, PKM2, LDH, GAPDH, p-AKT, AKT, β-Actin were determined by western blot. (G) Lactate dehydrogenase (LDH) enzymatic activity was assessed. (H) Lactic acid production was measured. (I) Glucose uptake was analyzed. (J) Protein expression of some transcriptional factors about lipid metabolism (PGC1β, CTP1, PPARα, PPARγ) were determined by western blot. (K) BMDMs were incubated with JC-1 at working stock and mitochondrial membrane potential was measured by flow cytometry. Data of western blot and flow cytometry are the representatives of three independent experiments. Date of histograms are represented as mean ± SEM of three independent experiments. #P < 0.05 vs. normal group; *P < 0.05, **P < 0.01, ***P < 0.001 vs. M1 group.
Fig. 4
Fig. 4
Anx A5 directly interacted with PKM2 at ASP101, LEU104 and ARG106 (A) BMDMs were incubated with FITV-Anx A5 (240 nM) or FITC (as negative control) in the presence of 10 ng/ml LPS&IFN-γ for 6 h, and washed with PBS for 3 times. Cellular location FITC-Anx A5 were observed by ultrahigh resolution laser confocal. (B) Anx A5-interacted proteins were explored by co-immunoprecipitation and mass spectrometry, and some target proteins with higher score were about glycolysis and OXPHOS, as shown. (C) Cells were treated with Anx A5 (240 nM) in the presence of 10 ng/ml LPS & IFN-γ, the interation of Anx A5 and PKM2 was determined by co-immunoprecipitation. (D) The cellular location of Anx A5 and PKM2 complex was observed by ultrahigh resolution laser confocal. (E–F) Cells were incubated with PBS or Anx A5 for 6 h, and CETSA analyzed the thermal stabilization of PKM2 protein at different temperatures and concentrations. (G) Molecular docking showed binding domain of Anx A5 and PKM2. (H) The interaction of Anx A5 with PKM2, or Anx A5 with PKM2-mutant (D101A, L104A, R106A) was measured by microscale thermophoresis. The Kd value of Anx A5 and PKM2 interaction was determined with MO. Affinity Analysis Software. The graphs displayed data are represented as mean ± SEM of three independent experiments. (I) HA-Anx A5, Flag-PKM2 or Flag-PKM2 mutant (D101A, L104A, R106A) plasmid was transfected into HET293T cells, and protein-protein interaction was determined by co-immunoprecipitation. Immunofluorescence pictures are the representatives of five different visual fields.
Fig. 5
Fig. 5
Anx A5 inhibited PKM2 tyrosine 105 (Y105) phosphorylation and enhanced its enzymatic pyruvate kinase activity (A) BMDMs were incubated with various concentrations of Anx A5 (60, 120 and 240 nM) in LPS&IFN-γ or IL-4 as described above, the expression of p-PKM (Y105), p-PKM2 (Ser37), PKM2 and β-Actin were determined by western blot. (B) Cellular localization of PKM2 was analyzed by immunofluorescence staining. The nuclei were stained with DAPI. Pictures are representative of five different visual fields. (C) Cells were incubated with Anx A5 (240 nM) with LPS&IFN-γ or IL-4, proteins of nuclear and cytoplasmic fractions were isolated respectively, and PKM2, Lamin B, β-Actin expression were determined by western blot and analyzed in histogram. (D) Cells were treated with Anx A5 (240 nM) with LPS&IFN-γ or IL-4, then collected and cross-linked with DSS. Tetramer, dimer and monomer form of PKM2 were analyzed by western blot. (E) Enzymatic pyrunate kinase activity was measured. (F) Association of PKM2 and Hif1α was detected by co-immunoprecipitation. Data of western blot are the representatives of three independent experiments. Date of histograms are represented as mean ± SEM of three independent experiments. #P < 0.05 vs. normal group; *P < 0.05, **P < 0.01 vs. M1 group.
Fig. 6
Fig. 6
Anx A5 ameliorated HFD-induced NASH in mice C57BL/6 mice were fed HFD for 16 weeks to induce NASH. After 8 weeks of HFD, mice were administrated with 10, 30, 100 μg/kg Anx A5 once every 3 days by tail intravenous injection for 8 weeks, and fasted for 12 h before harvest (n = 9 mice per group). (A) HE staining with liver paraffin sections, scale bar 20 μm. (B) Immunohistochemistry for CD11c expression. (C) Sirius red stain for fibrosis. (D) mRNA level of α-Sma, Tgf-β, Col3a1 in liver was measured by quantitative PCR. (E) TG, TC in serum and liver tissue was analyzed by commercial kit. (F) Liver Hyp concentration. (G) Liver fibrosis index analysis, including hyaluronic acid, laminin, Type III procollagen. (H) Protein level of Fasn, Scd1, p-STAT1/STAT1, p-P65/P65, LDH, p-PKM2 (Y105), p-STAT6, PPARγ and β-actin was determined by western blot. (I) Serum inflammatory cytokines of IL-1β, IL-6 and TNFα were determined by ELISA. (J–K) The mRNA level of Fasn, Scd1, Acc, Il-1β, Il-6, Tnf-α, Cd206, Fizzl, Il-10 was determined by quantitative PCR. Date are represented as mean ± SD, n = 9 mice for each experimental group. #P < 0.05 vs. normal group; *P < 0.05, **P < 0.01 vs. HFD group. Pictures (A–C) were the representative of five field for per mice in every group. . (For interpretation of the references to colour in this figure legend, the reader is referred to the Web version of this article.)
Fig. 7
Fig. 7
Anx A5 inhibited hepatic macrophage M1 polarization and promoted M2 polarization. C57B/L6 mice were treated as above described. Hepatic macrophages were isolated from liver by using liver perfusion collagenase system and gradient centrifugation. F4/80+CD11c+ (A) and F4/80+CD206+ (B) macrophage proportion were analyzed by flow cytometry with respective antibodies. The positive cells are shown as a histogram of mean ± SEM, n = 4 mice for each experimental group. #P < 0.05 vs. normal group; *P < 0.05, **P < 0.01 vs. HFD group.
Fig. 8
Fig. 8
Anx A5 selectively affected hepatic macrophages. (A) Non-parenchymal liver cells of C57BL/6 mouse were isolated as described in Methods and Materials, and treated with 100 ng/ml LPS and 100 mM PA for 18 h (LPS plus PA was used to mimic NASH model in vitro), then incubated with FITC-Anx A5 (240 nM) for 6 h. FITC-Anx A5 in the non-parenchymal liver cells was analyzed by flow cytometry. (B) Kupffer cells from C57BL/6 mouse were isolated and incubated with various concentrations of Anx A5 (60, 120 and 240 nM) in the presence of LPS &IFN-γ. And the surface marker CD11c and CD206 were determined by flow cytometry. (C–D) The mRNA level of Il-6, Tnf-α, Il-1β, Cd206, Fizzl, Ym1 was determined by quantitative PCR. (E) p-P65, p65/P65, p-STAT1/STAT1, p-STAT6 and β-Actin was determined by western blot. Data are represented as mean ± SEM of three independent experiments. *P < 0.05, **P < 0.01 vs. M1 group. Data of western blot are the representatives of three independent experiments.
Fig. 9
Fig. 9
Anx A5 inhibited p-PKM2(Y105) expression in hepatic macrophages. C57BL/6 mice were treated as described in the legend of Fig. 6. Anx A5, CD163 and p-PKM2(Y105) expression in liver sections was detected by immunofluorescence. Scale bar 50 μm. Pictures are the representatives of five different fields for per mouse in every experimental group.
Fig. 10
Fig. 10
PKM2 enzymatic inhibitor, compound 3k, abolished therapeutic effect of Anx A5 on NASH. C57BL/6 mice were fed with HFD for 16 weeks. After 8 weeks of HFD treatment, mice were administrated with Anx A5 (100 μg/kg) by tail intravenous injection and compound 3K by gavage (10 mg/kg) for 8 weeks, and both were once every 3 days (n = 9 mice per group). (A) HE staining with liver paraffin sections, scale bar 20 μm. (B) Immunohistochemistry for CD11c expression. (C) Sirius red stain for fibrosis. (D) mRNA level of α-Sma, Tgf-β, Col3a1 in liver was measured by quantitative PCR. (E) Serum TC and TG assay by commercial kits. (F) Hepatic Fasn, Scd1, p-STAT1, p-P65, LDH, p-STAT6, PPARγ, and β-actin expression was determined by western blot. (G–H) mRNA level of Fasn, Scd1, Acaca, Il-1β, Il-6, Tnf-α, Cd206, Fizzl, Il-10 was determined by quantitative PCR. Date are represented as mean ± SD. n = 9 mice for every experimental group.; #P < 0.05 vs. normal group; *P < 0.05, **P < 0.01 vs. HFD group; ns (non-significant), P > 0.05 vs HFD group. Pictures (A–C) were the representative of five different fields for per mouse in every group. . (For interpretation of the references to colour in this figure legend, the reader is referred to the Web version of this article.)
Fig. 11
Fig. 11
Regulation of Anx A5 in macrophage phenotype shift was dependent on PKM2(A–C) Raw 264.7 cells were incubated with Anx A5 (120 nM) and compound 3k (10 μM) under LPS&IFN-γ or IL-4 treatment. (A–B) mRNA level of Il-1β, Il-6, Tnf-α, Cd206 and Fizzl were determined by quantitative PCR. (C) Expression of p-STAT1, p-P65, LDH, p-STAT6, p-PKM2 (Y105), CPT1, PPARγ, and β-actin were determined by western blot. (D–F) Raw 264.7 cells were transfected with PKM2 (Y105E) plasmids and vector for 48 h, and then incubated with Anx A5 (240 nM) for 6 h in the presence of LPS&IFN-γ or not. (D–E) mRNA level of Il-1β, Il-6, Tnf-α, Cd206 and Fizzl were determined by quantitative PCR. (F) Expression of p-STAT1, p-P65, LDH, p-STAT6, p-PKM2 (Y105), CPT1, PPARγ, and β-actin were determined by western blot. Date are represented as mean ± SEM of three different experiments; #P < 0.05 vs. normal group; *P < 0.05, **P < 0.01 vs. M1 group; ns, P > 0.05 vs M1 group.

References

    1. Younossi Z. Global burden of NAFLD and NASH: trends, predictions, risk factors and prevention. Nat. Rev. Gastroenterol. Hepatol. 2018;15:11–20. - PubMed
    1. Chalasani N. The diagnosis and management of non-alcoholic fatty liver disease: practice guideline by the American association for the study of liver diseases, American college of gastroenterology, and the American gastroenterological association. Am. J. Gastroenterol. 2012;107:811–826. - PubMed
    1. Dulai P.S. Increased risk of mortality by fibrosis stage in nonalcoholic fatty liver disease: systematic review and meta-analysis. Hepatology. 2017;65:1557–1565. - PMC - PubMed
    1. Rotman Y., Sanyal A.J. Current and upcoming pharmacotherapy for non-alcoholic fatty liver disease. Gut. 2017;66:180–190. - PubMed
    1. Spengler E.K., Loomba R. Recommendations for diagnosis, referral for liver biopsy, and treatment of nonalcoholic fatty liver disease and nonalcoholic steatohepatitis. Mayo Clin. Proc. 2015;90:1233–1246. - PMC - PubMed

Publication types