. 2020 Sep:36:101632.
doi: 10.1016/j.redox.2020.101632. Epub 2020 Jul 2.

Melatonin sensitises shikonin-induced cancer cell death mediated by oxidative stress via inhibition of the SIRT3/SOD2-AKT pathway

Affiliations

Melatonin sensitises shikonin-induced cancer cell death mediated by oxidative stress via inhibition of the SIRT3/SOD2-AKT pathway

Mengling Li et al. Redox Biol. 2020 Sep.

Abstract

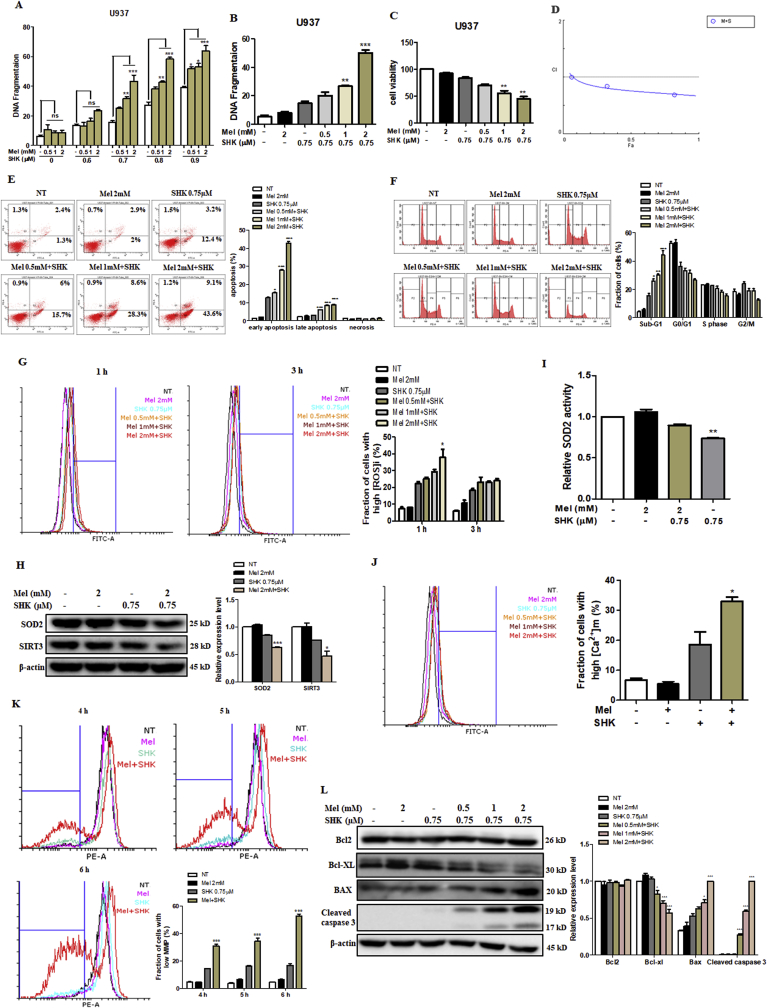
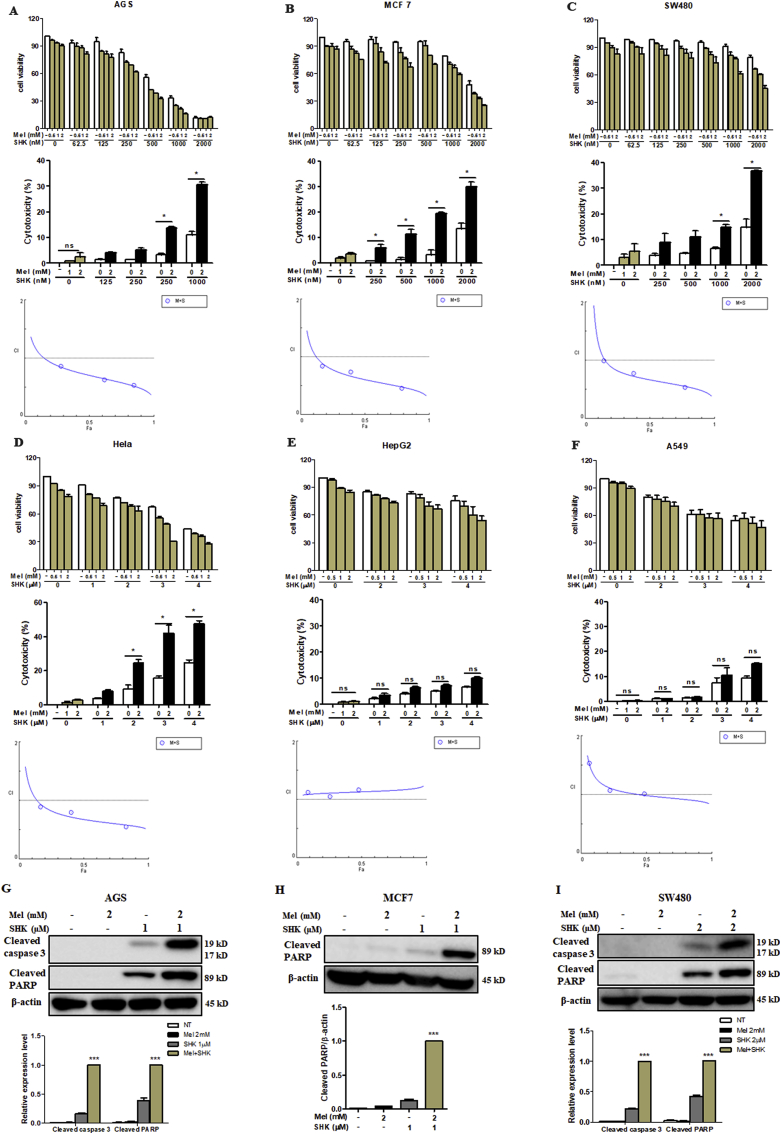
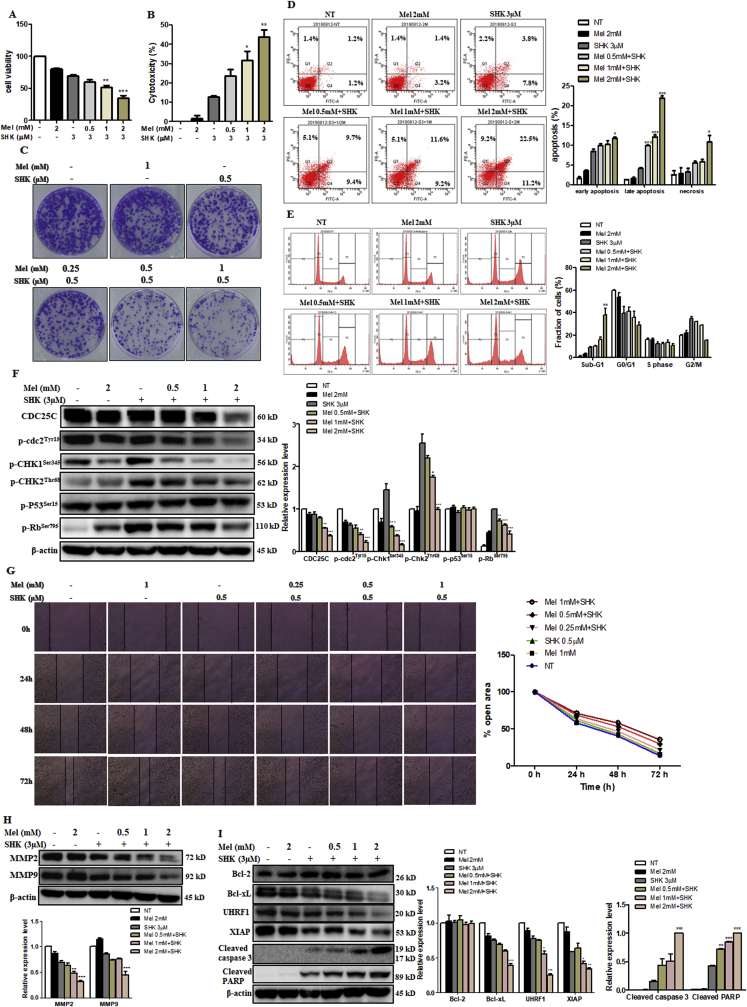
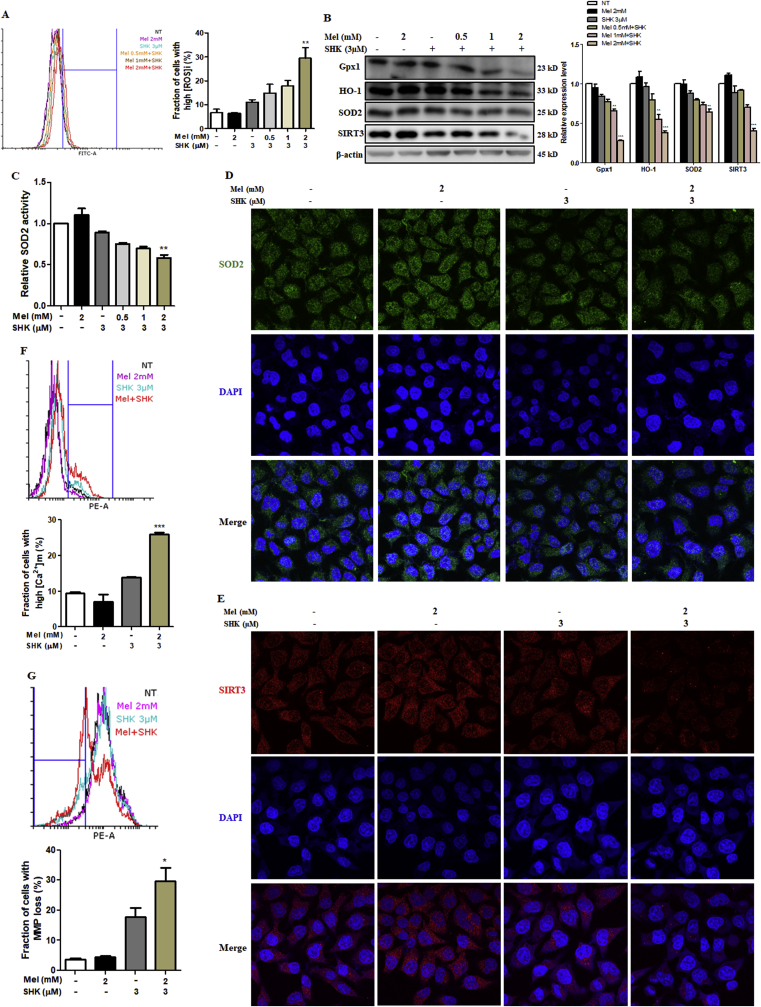
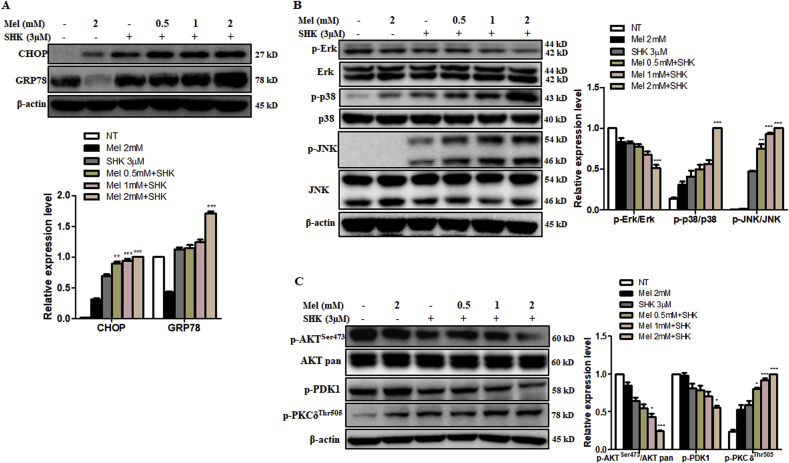
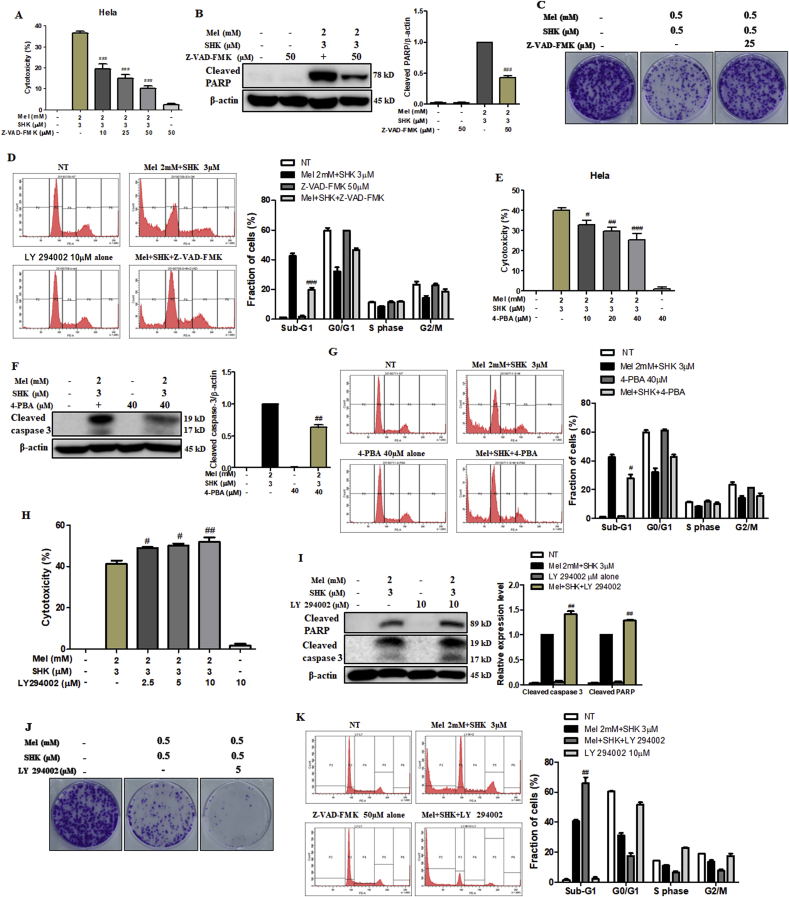
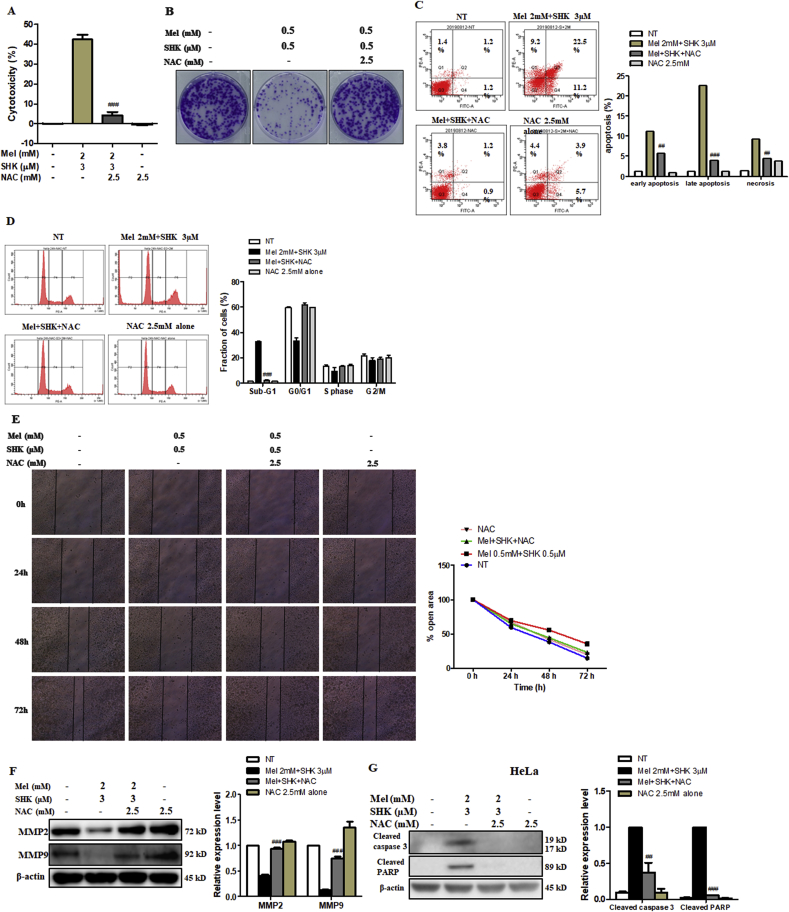
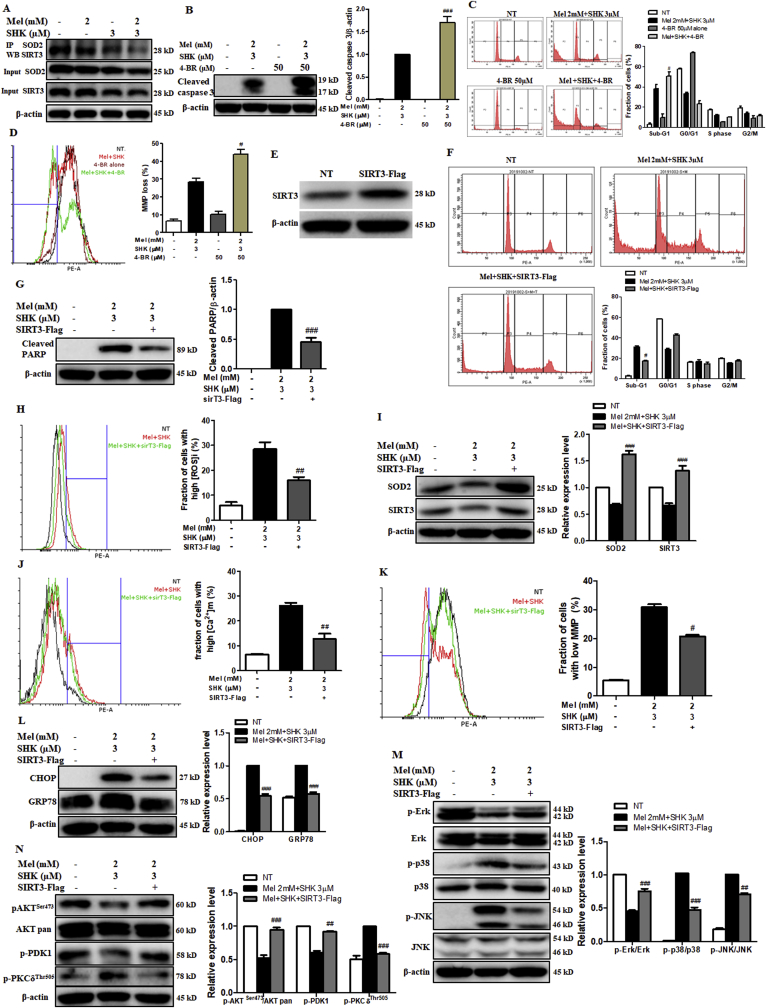
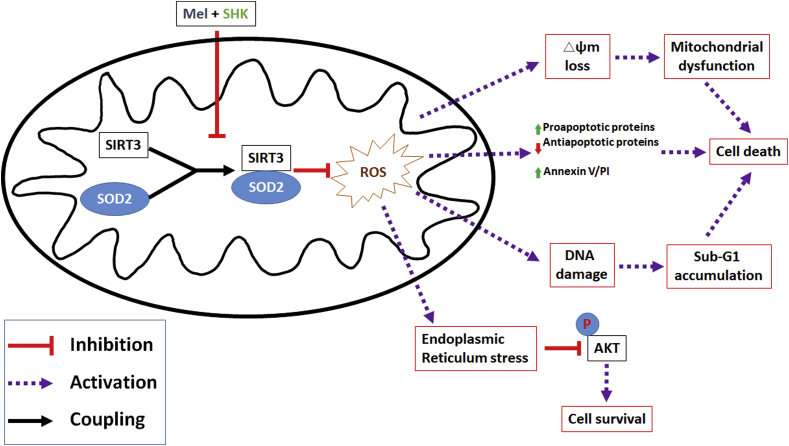
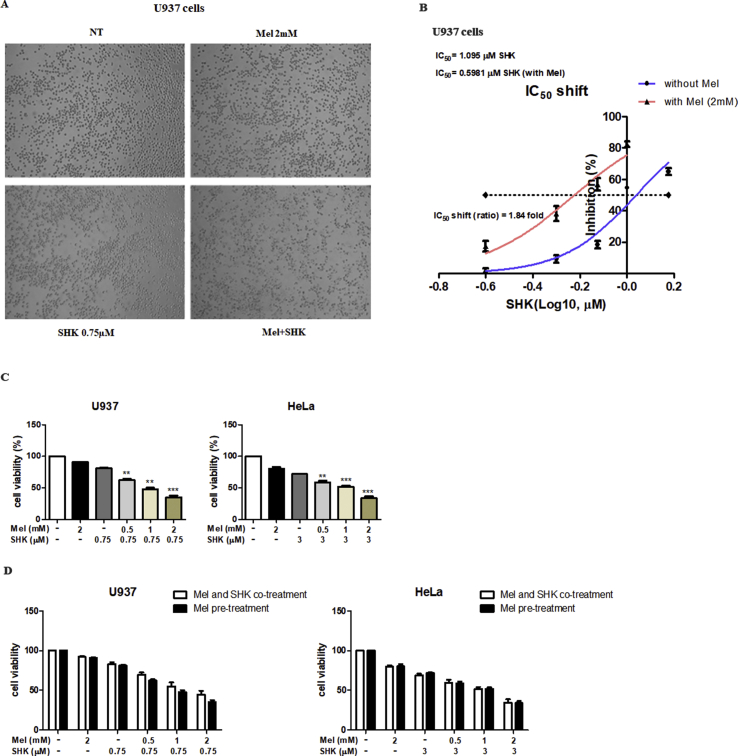
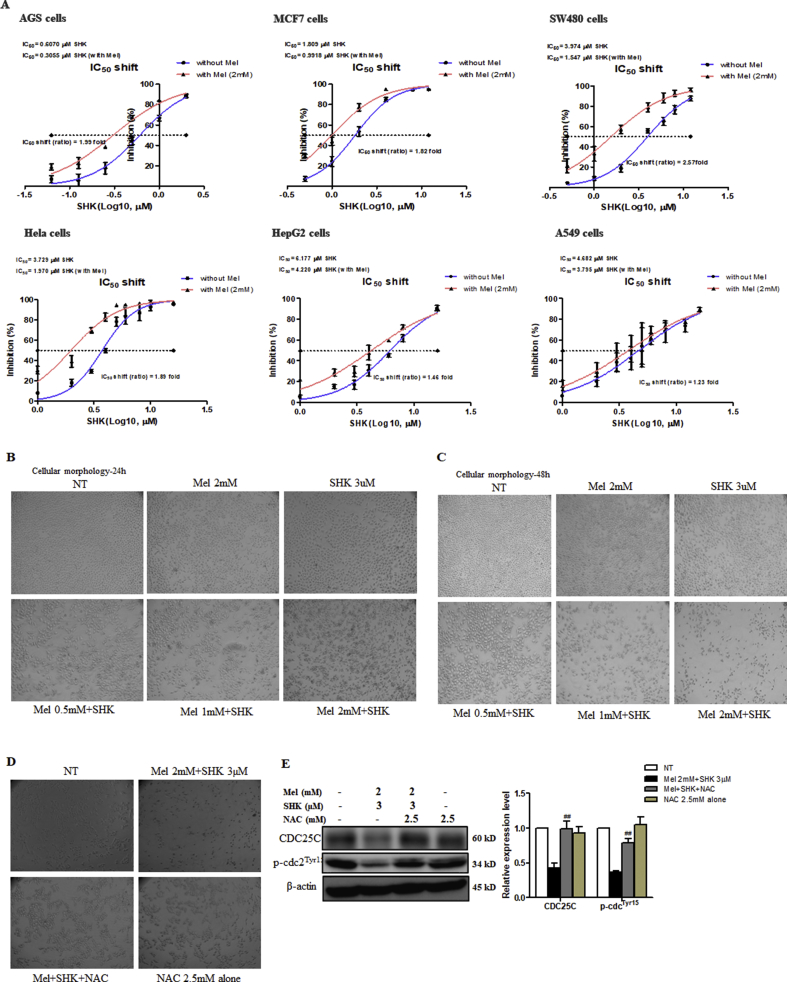
Recent research suggests that melatonin (Mel), an endogenous hormone and natural supplement, possesses anti-proliferative effects and can sensitise cells to anti-cancer therapies. Although shikonin (SHK) also possesses potential anti-cancer properties, the poor solubility and severe systemic toxicity of this compound hinders its clinical usage. In this study, we combined Mel and SHK, a potentially promising chemotherapeutic drug combination, with the aim of reducing the toxicity of SHK and enhancing the overall anti-cancer effects. We demonstrate for the first time that Mel potentiates the cytotoxic effects of SHK on cancer cells by inducing oxidative stress via inhibition of the SIRT3/SOD2-AKT pathway. Particularly, Mel-SHK treatment induced oxidative stress, increased mitochondrial calcium accumulation and reduced the mitochondrial membrane potential in various cancer cells, leading to apoptosis. This drug combination also promoted endoplasmic reticulum (ER) stress, leading to AKT dephosphorylation. In HeLa cells, Mel-SHK treatment reduced SIRT3/SOD2 expression and SOD2 activity, while SIRT3 overexpression dramatically reduced Mel-SHK-induced oxidative stress, ER stress, mitochondrial dysfunction and apoptosis. Hence, we propose the combination of Mel and SHK as a novel candidate chemotherapeutic regimen that targets the SIRT3/SOD2-AKT pathway in cancer.

Keywords: AKT; Apoptosis; Melatonin; Reactive oxygen species; SIRT3/SOD2; Shikonin.


Conflict of interest statement

The authors declare no conflict of interest.

Figures

Fig. 1
Fig. 1
The melatonin-shikonin (Mel-SHK) combination exerts strong anti-cancer activities and downregulates SIRT3/SOD2 in U937 cells. U937 cells were treated with melatonin (Mel, 0–2 mM) or shikonin (SHK, 0–0.9 μM) alone or in combination for 6 h unless otherwise indicated. (A) DNA fragmentation was assessed. The histogram depicts the percentage of DNA fragmentation in cells treated with SHK alone (white bars) or in combination with Mel at various concentrations. The effects of SHK (0.75 μM) and concomitant dose-dependent effect of Mel (0–2 mM) were investigated with respect to (B) DNA fragmentation, (C) cell viability, (D) Combination Index (CI), (E) apoptosis [Annexin V/propidium iodide (PI) double-staining] and (F) hypodiploid (sub-G1) DNA content. (G) Cells with high levels of reactive oxygen species (ROS) were evaluated at 1 h and 3 h post-treatment. (H) SOD2 and SIRT3 protein expression levels were analysed by western blotting 1 h after treatment with Mel and SHK alone or in combination. The bar graph depicts the relative expression levels compared to SHK treatment alone. (I) Relative analysis of SOD2 activity. (J) Mitochondrial calcium (Ca2+) levels at 1 h and (K) mitochondrial membrane potential (MMP) at 4 h, 5 h and 6 h post-treatment. (L) Western blotting analysis of pro-apoptotic and anti-apoptotic protein expression. Flow cytometry data are presented as histograms and bar graphs. Relative protein expression was calculated for all western blots, using actin for normalisation and as a loading control. One representative figure from at least three independent experiments is shown for each assay. The data in each bar graph are presented as the means ± standard errors of the means (SEM). *P < 0.05, **P < 0.01, and ***P < 0.001 relative to SHK treatment alone.
Fig. 2
Fig. 2
Treatment with melatonin-shikonin (Mel-SHK) enhances cytotoxicity and caspase activation in solid cancer cell lines. (A) AGS, (B) MCF7, (C) SW480, (D) HeLa, (E) HepG2, and (F) A549 cells were treated with Mel and/or SHK at various concentrations. Caspase 3 and/or PARP cleavage was investigated in (G) AGS, (H) MCF7 and (I) SW480 cells. In all experiments, the treatment duration was 24 h. The relative protein expression was calculated, and one representative figure from at least three independent experiments is shown. Actin was used for normalisation and as a loading control. The data in each bar graph are presented as the means ± SEM (n = 3). ns: not significant, *P < 0.05 and ***P < 0.001 relative to SHK treatment alone.
Fig. 3
Fig. 3
Melatonin-shikonin (Mel-SHK) treatment inhibits HeLa cell growth and facilitates apoptosis. (A) Cell viability and (B) cytotoxicity were assessed in HeLa cells treated with SHK (3 μM) with or without Mel (0–2 mM). The effects of combined Mel-SHK treatment at these concentrations on (C) clonogenicity, (D) apoptosis [Annexin V/PI double-staining] and (E) sub-G1 phase accumulation were then evaluated. (F) Western blotting was used to identify the levels of several proteins associated with cell division and cell cycle. (G) A wound-healing assay was performed to investigate the effects of treatment on cell migration. The bar graph depicts the percentage of the open area remaining after treatment. Western blotting was further performed to evaluate (H) the levels of matrix metalloproteinases (MMPs) and (I) pro- and anti-apoptotic proteins in response to Mel-SHK treatment. For all experiments, the treatment duration was 24 h. Flow cytometry data are presented as histograms and bar graphs. Relative protein expression was calculated for all western blots, using actin for normalisation and as a loading control. One representative figure from at least three independent experiments is shown for each assay. The data in each bar graph are presented as the means ± SEM. *P < 0.05, **P < 0.01, and ***P < 0.001 relative to SHK treatment alone.
Fig. 4
Fig. 4
Melatonin-shikonin (Mel-SHK) treatment enhances reactive oxygen species (ROS) generation and inhibits SIRT3/SOD2 pathway activation in HeLa cells. (A) The levels of ROS in HeLa cells treated with Mel-SHK for 6 h are presented as fractions of cells with high ROS. (B) The levels of key antioxidant proteins (Gpx1, HO-1, and SOD2) and SIRT3 and (C) relative SOD2 activity were measured at 12 h post-treatment. The protein expression of (D) SOD2 and (E) SIRT3 in these cells was confirmed using immunofluorescence by confocal microscopy. (F) The levels of mitochondrial free calcium (Ca2+) and (G) MMP were measured in these cells at 12 h and 24 h post-Mel-SHK treatment, respectively. All experiments used SHK at 3 μM and Mel at 0–2 mM. Flow cytometry data are presented as histograms and bar graphs. Relative protein expression was calculated for all proteins in the western blots and actin was used for normalisation and as a loading control. One representative figure from at least three independent experiments is shown for each assay. The data in each bar graph are presented as the means ± SEM. *P < 0.05, **P < 0.01, and ***P < 0.001 relative to SHK treatment alone.
Fig. 5
Fig. 5
Melatonin-shikonin (Mel-SHK) treatment enhances endoplasmic reticulum (ER) stress and MAPK and AKT pathway dysregulation in HeLa cells. (A) Western blot analysis of the specific ER stress-related proteins, CHOP and GRP78 and (B) the levels and activation (i.e., phosphorylation) of ERK, p38, and JNK. (C) Quantitative Western blot analysis to determine the activation of the AKT pathway components p-AKT, p-PDK1, and p-PKC, as well as total AKT. Relative protein expression was calculated for all proteins in the western blots. Actin was used for normalisation and as a loading control. One representative figure from at least three independent experiments is shown for each assay. The data in each bar graph are presented as the means ± SEM. *P < 0.05, **P < 0.01, and ***P < 0.001 relative to SHK treatment alone.
Fig. 6
Fig. 6
Effects of a pan-caspase inhibitor (Z-VAD-FMK), endoplasmic reticulum (ER) stress inhibitor (4-PBA) and PI3K inhibitor (LY294002) in melatonin-shikonin (Mel-SHK)-treated HeLa cells. (A) Cytotoxicity, (B) PARP cleavage, (C) clonogenicity, and (D) sub-G1 phase accumulation were determined after pre-treatment with Z-VAD-FMK. (E) Cytotoxicity, (F) caspase-3 cleavage, and (G) sub-G1 phase accumulation were also determined in cells pre-treated with 4-PBA. (H) Cytotoxicity, (I) PARP cleavage, (G) clonogenicity, and (K) sub-G1 phase accumulation were determined in cells pre-treated with LY 294002 to determine the involvement of the AKT pathway in Mel-SHK-induced cancer cells. Flow cytometry data are presented as histograms and bar graphs. Relative protein expression was calculated for all the proteins in western blots. Actin was used for normalisation and as a loading control. One representative figure from at least three independent experiments is shown for each assay. The data in each bar graph are presented as the means ± SEM. #P < 0.05, ##P < 0.01, and ###, P < 0.001 relative to Mel-SHK treated cells.
Fig. 7
Fig. 7
Effects of the reactive oxygen species (ROS) scavenger, NAC, on the anti-cancer effects of melatonin-shikonin (Mel-SHK) in HeLa, MCF7, AGS, and SW480 cells. HeLa cells were pre-treated with NAC followed by Mel-SHK. The effects on (A) cytotoxicity, (B) clonogenicity, (C) apoptosis [Annexin V/PI double-staining], (D) sub-G1 area, and (E) cell migration were evaluated to confirm the role of ROS. (F) Western blotting was performed to analyse the levels of specific proteins related to cell migration, such as matrix metalloproteinase-2 (MMP2) and MMP9. The protective effects of NAC against Mel-SHK-induced apoptosis including caspase-3 and/or PARP cleavage, were determined in (G) HeLa, (H) MCF7, (I) AGS and (J) SW480 cells. The ability of NAC to reverse Mel-SHK-mediated (K) ROS generation, (L) oxidative stress-related protein expression, (M) SOD2 activation, (N) mitochondrial calcium (Ca2+) accumulation, (O) MMP losses and (P) ER-stress related protein expression were also investigated. (Q, R) Western blot analysis of the effects of NAC on the expression of MAPK and AKT pathway-related proteins in Mel-SHK-treated cells. The Mel-SHK treatment duration was 24 h for all experiments except those described in B (10 days), K (6 h) and L, M, N, P, Q and R (12 h). Relative protein expression was calculated for all the proteins in western blots. Actin was used for normalisation and as a loading control. Flow cytometry data are presented as histograms and bar graphs. One representative figure from at least three independent experiments is shown for each assay. The data in each bar graph are presented as the means ± SEM. #P < 0.05, ##P < 0.01, and ###P < 0.001 relative to Mel-SHK treated cells.
Fig. 7
Fig. 7
Effects of the reactive oxygen species (ROS) scavenger, NAC, on the anti-cancer effects of melatonin-shikonin (Mel-SHK) in HeLa, MCF7, AGS, and SW480 cells. HeLa cells were pre-treated with NAC followed by Mel-SHK. The effects on (A) cytotoxicity, (B) clonogenicity, (C) apoptosis [Annexin V/PI double-staining], (D) sub-G1 area, and (E) cell migration were evaluated to confirm the role of ROS. (F) Western blotting was performed to analyse the levels of specific proteins related to cell migration, such as matrix metalloproteinase-2 (MMP2) and MMP9. The protective effects of NAC against Mel-SHK-induced apoptosis including caspase-3 and/or PARP cleavage, were determined in (G) HeLa, (H) MCF7, (I) AGS and (J) SW480 cells. The ability of NAC to reverse Mel-SHK-mediated (K) ROS generation, (L) oxidative stress-related protein expression, (M) SOD2 activation, (N) mitochondrial calcium (Ca2+) accumulation, (O) MMP losses and (P) ER-stress related protein expression were also investigated. (Q, R) Western blot analysis of the effects of NAC on the expression of MAPK and AKT pathway-related proteins in Mel-SHK-treated cells. The Mel-SHK treatment duration was 24 h for all experiments except those described in B (10 days), K (6 h) and L, M, N, P, Q and R (12 h). Relative protein expression was calculated for all the proteins in western blots. Actin was used for normalisation and as a loading control. Flow cytometry data are presented as histograms and bar graphs. One representative figure from at least three independent experiments is shown for each assay. The data in each bar graph are presented as the means ± SEM. #P < 0.05, ##P < 0.01, and ###P < 0.001 relative to Mel-SHK treated cells.
Fig. 8
Fig. 8
Effects of SIRT inhibition and SIRT3 overexpression on the melatonin-shikonin (Mel-SHK)-induced HeLa cell cytotoxicity. (A) Immunoprecipitation analysis to demonstrate the effects of Mel and/or SHK on the direct binding of SIRT3 with SOD2. (B) apoptosis via caspase activation, (C) sub-G1 phase accumulation and (D) MMP losses were investigated in HeLa cells pre-treated with the SIRT inhibitor 4-BR before combined treatment with Mel-SHK to examine the role of SIRT3/SOD2 in Mel-SHK-induced cancer cell death. (E) SIRT3 overexpression in HeLa cells transfected with sirT3-Flag plasmid was confirmed by western blotting. (F–L) SIRT3-overexpressing HeLa cells were treated with Mel-SHK, and all parameters previously shown to be affected by Mel-SHK were evaluated. (M, N) The effect of SIRT3 overexpression on the MAPK and AKT pathways was also evaluated. Relative protein expression was calculated for all the proteins in western blots. Actin was used for normalisation and as a loading control. All experiments used SHK at 3 μM and Mel at 0–2 mM. Flow cytometry data are presented as histograms and bar graphs. One representative figure from at least three independent experiments is shown for each assay. The data in each bar graph are presented as the means ± SEM. #P < 0.05, ##P < 0.01, and ###P < 0.001 relative to Mel-SHK treated cells.
Fig. 9
Fig. 9
Schematic illustration showing the mechanism of melatonin(Mel)sensitises shikonin(SHK)-induced cancer cell death.
Supplementary Fig. 1
Melatonin (Mel) and shikonin (SHK) treatment induce changes in morphology in U937 cells (A). (B) IC50 shift assay. (C) Cell viability was measured when Mel pre-treatment for 1 h before SHK treatment in U937 and HeLa cells. (D) Cell viability was compared between Mel pre-treatment and Mel-SHK simultaneous treatment in U937 and HeLa cells.
Supplementary Fig. 2
(A) IC50 shift assay. Effects of melatonin (Mel) and shikonin (SHK) on (B) cell morphology 24 h post-treatment and (C) 48 h post-treatment in HeLa cells. (D) Use of NAC pre-treatment to demonstrate the effect on the reversal in the morphological changes induced by Mel-SHK in these cells. (E) Effects of NAC on cell cycle regulators, CDC25C and p-cdc2 in Mel-SHK treated HeLa cells. The data in each bar graph are presented as the means ± standard errors of the means (SEM). ###P < 0.001 compared with Mel-SHK treated cells.
Supplementary Fig. 3
(A) BHK, (B) Vero, (C) NIH3T3, and (D) HaCaT cells were pre-treated with Mel for 12 h before H2O2 treatment, and cell viability was evaluated 12 h post-treatment in BHK (A) and Vero (B) cells or 24 h post-treatment in NIH3T3 (C) and HaCaT (D) cells (left panel). The levels of reactive oxygen species (ROS) were evaluated at 2 h post-treatment in BHK (A) and Vero (B) cells or 4 h post-treatment in NIH3T3 (C) and HaCaT (D) cells (right panel). The data in each bar graph are presented as the means ± SEM. *P < 0.05, **P < 0.01, and ***P < 0.001 relative to control. #P < 0.05, and ##P < 0.01 compared with H2O2 treated cells.
Supplementary Fig. 4
Effects on cytotoxicity and anti-clonogenicity evaluated with (A) JNK–IN–8, (B) SB203580, (C) U0126, (D) Nec-1, and (E) NSA in Melatonin (Mel)-shikonin (SHK) treated HeLa cells. The data in each bar graph are presented as the means ± SEM. #P < 0.05, and ##P < 0.01 compared with Mel-SHK treated cells.

References

    1. Bray F., Ferlay J., Soerjomataram I., Siegel R.L., Torre L.A., Jemal A. Global cancer statistics 2018: GLOBOCAN estimates of incidence and mortality worldwide for 36 cancers in 185 countries. Ca - Cancer J. Clin. 2018;68(6):394–424. - PubMed
    1. Zarour L.R., Anand S., Billingsley K.G., Bisson W.H., Cercek A., Clarke M.F., Coussens L.M., Gast C.E., Geltzeiler C.B., Hansen L., Kelley K.A., Lopez C.D., Rana S.R., Ruhl R., Tsikitis V.L., Vaccaro G.M., Wong M.H., Mayo S.C. Colorectal cancer liver metastasis: evolving paradigms and future directions. Cell Mol. Gastroenterol. Hepatol. 2017;3(2):163–173. - PMC - PubMed
    1. Reiter R.J., Tan D.X. Mitochondria: the birth place, battle ground and the site of melatonin metabolism in cells. Melatonin Res. 2019;2(1):44–66.
    1. Savvidis C., Koutsilieris M. Circadian rhythm disruption in cancer biology. Mol. Med. 2012;18:1249–1260. - PMC - PubMed
    1. Mortezaee K., Najafi M., Farhood B., Ahmadi A., Potes Y., Shabeeb D., Musa A.E. Modulation of apoptosis by melatonin for improving cancer treatment efficiency: an updated review. Life Sci. 2019;228:228–241. - PubMed

Publication types