

Forecasting incidences of COVID-19 using Box-Jenkins method for the period July 12-Septembert 11, 2020: A study on highly affected countries
- PMID: 32863619
- PMCID: PMC7444906
- DOI: 10.1016/j.chaos.2020.110248
Forecasting incidences of COVID-19 using Box-Jenkins method for the period July 12-Septembert 11, 2020: A study on highly affected countries
Abstract
Background: The devastating spread of the novel coronavirus, named COVID-19, starting its journey from Wuhan Province of China on January 21st, 2020, has now threatened lives of almost all the countries of the world in different magnitudes. Mostly the developed countries have been hit hard, besides the emerging countries like China, India and Brazil. The scientists and the policy makers are in dark with respect to its spread and claiming lives in coming days.
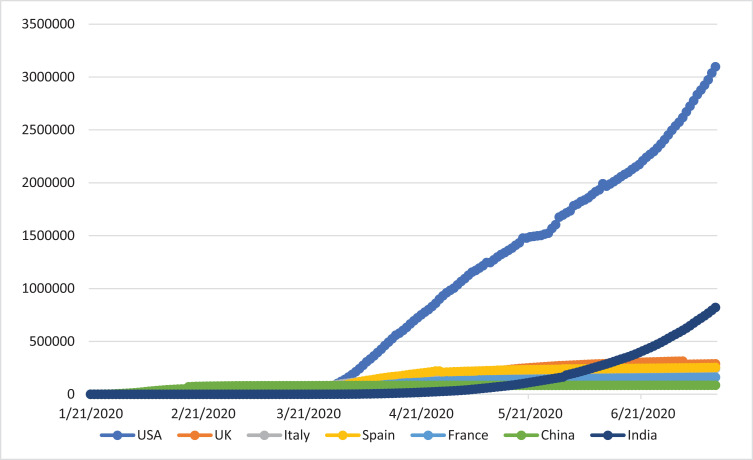
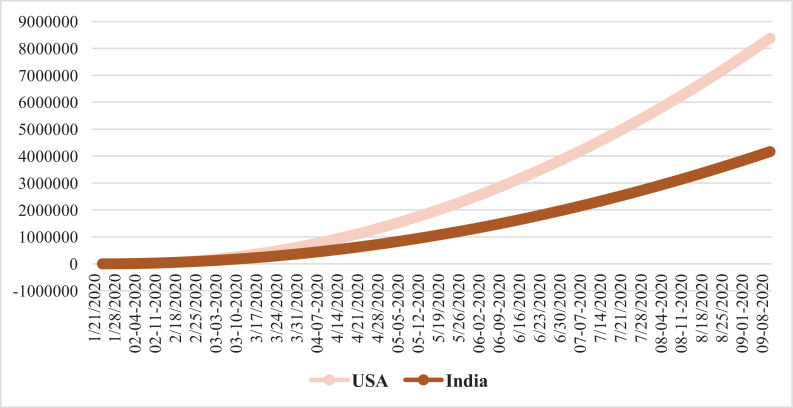
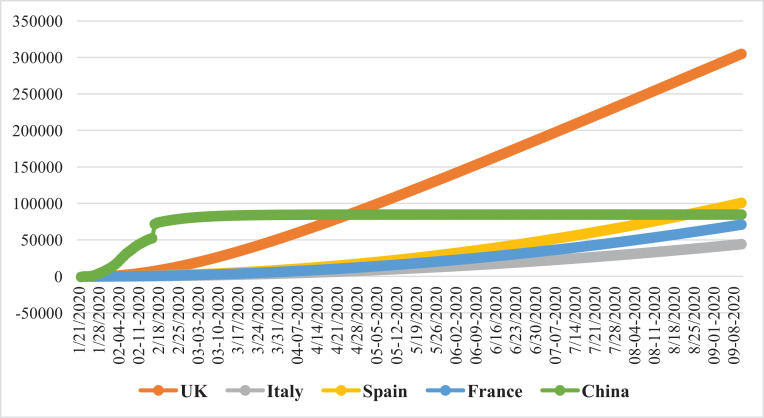
Objectives: The present study aims to forecast the number of incidences in severely affected seven countries, USA, UK, Italy, Spain, France, China and India, for the period July 12-Septmeber 11, 2020 and compares the forecasted values with the actual values to judge its depth of severity and growth.
Method: The study uses Box-Jenkins method of forecasting in an Autoregressive Integrated Moving Average (ARIMA) structure on the basis of the daily data published by World Health Organization from January 21st to July 11, 2020.
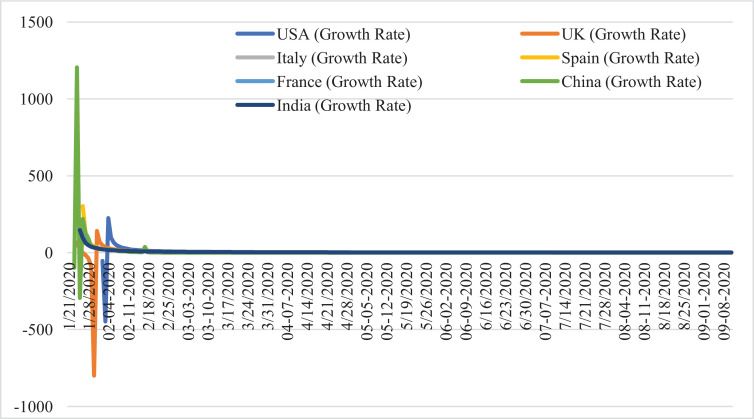
Results: It is observed that USA and India are the two countries whose increasing trends will continue in the forecasted period (July 12 to September 11), others except China will face lower number of incidences. China's incidence has come to halt around 80000 in numbers. The growth rates of the number of incidences for all the countries during the forecasted period will be diminishing. The mean difference test results between the forecasted and actual values in level and growth forms show that in the former case, USA, India, UK will face increasing forecast than the actual number but in the latter case, all of the countries will face significantly decreasing growth rates in the forecasted values compared to their actual growth values.
Keywords: ARIMA, Box-Jenkins, WHO; COVID-19; Forecasting; Growth; Mean difference.
© 2020 Published by Elsevier Ltd.
Conflict of interest statement
In preparing the manuscript the author did not face any conflict of interests and did not use any such materials of others where such conflict would at all arise.
Figures
References
-
- Banik A., Nag T., Chowdhury Roy, Chatterjee R. Why Do COVID-19 Fatality Rates Differ Across Countries? An Explorative Cross-country Study Based on Select Indicators. Global Busi Rev. 2020 doi: 10.1177/0972150920929897. - DOI
-
- Barreiro L. Immune system of African-Americans. Cell. 2016;167:657–669. October 20.
-
- Box G.E.P., Jenkins G.M. 2nd edition. Holden-Day; San Francisco: 1976. Time series analysis forecasting and control.
-
- Choudhury M.A., Zamil H., Banu S., Islam M.A. Dengue Bulletin; 2008. Forecasting dengue incidence in Dhaka, Bangladesh: A time series analysis. December.
-
- Kumar P., Kalita H., Patairiya S., Sharma Y.D., Nanda C., Rani M., Rahmani J., Bhagavathula A.S. ARIMA model with machine learning approach; 2020. Forecasting the dynamics of COVID-19 pandemic in top 15 countries in April 2020. - DOI
LinkOut - more resources
Full Text Sources
