

As the Wind Blows: The Effects of Long-Term Exposure to Air Pollution on Mortality
- PMID: 32863794
- PMCID: PMC7445412
- DOI: 10.1093/jeea/jvz051
As the Wind Blows: The Effects of Long-Term Exposure to Air Pollution on Mortality
Abstract
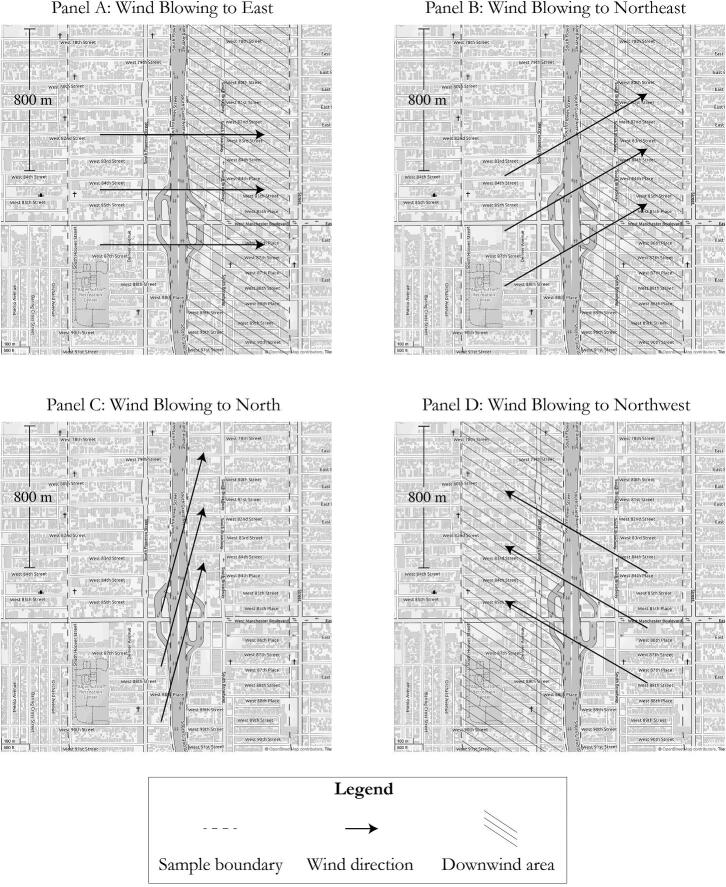
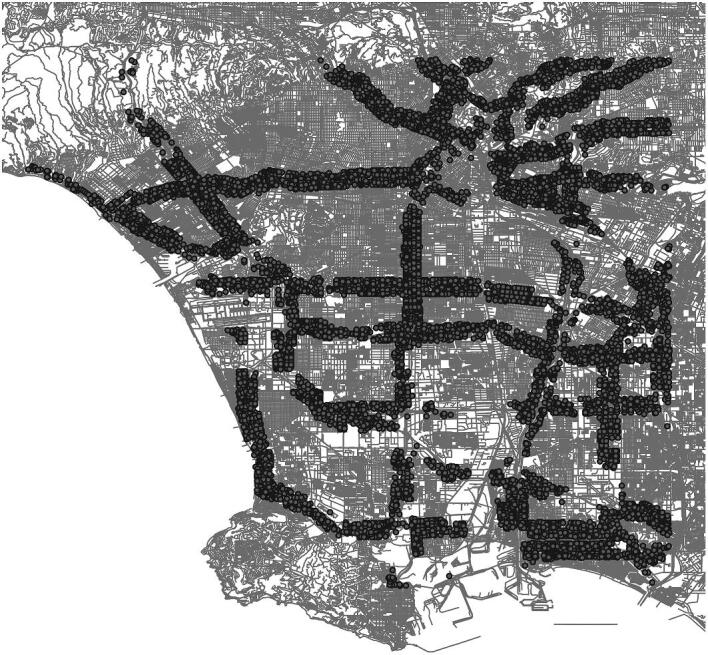
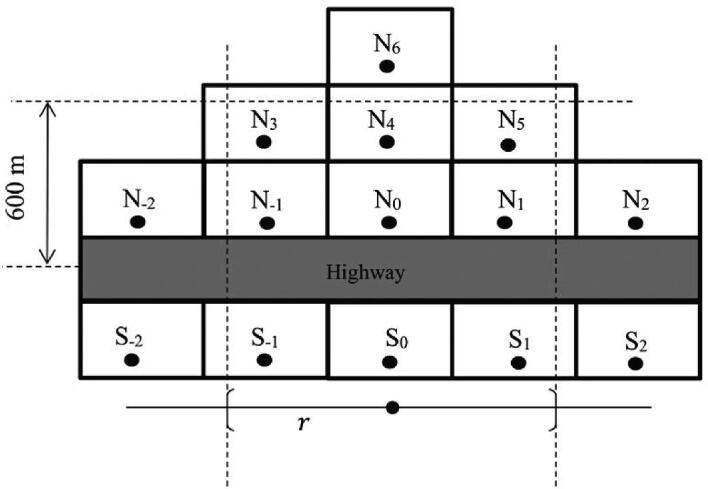
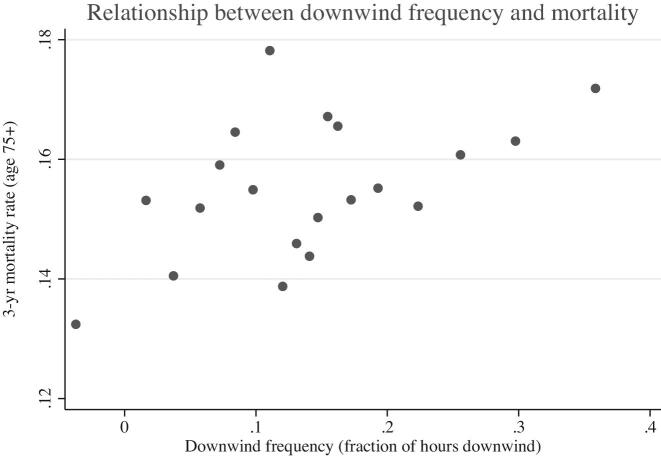
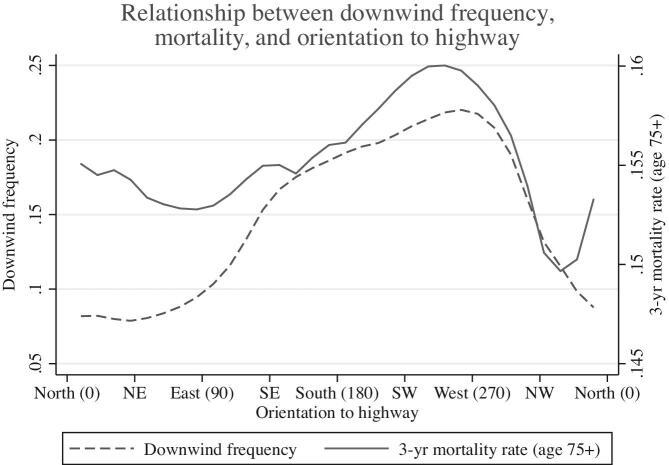
There is strong evidence that short-run fluctuations in air pollution negatively impact infant health and contemporaneous adult health, but there is less evidence on the causal link between long-term exposure to air pollution and increased adult mortality. This project estimates the impact of long-term exposure to air pollution on mortality by leveraging quasi-random variation in pollution levels generated by wind patterns near major highways. I combine geocoded data on the residence of every decedent in Los Angeles over three years, high-frequency wind data, and Census short form data. Using these data, I estimate the effect of downwind exposure to highway-generated pollutants on the age-specific mortality rate by using orientation to the nearest major highway as an instrument for pollution exposure. I find that doubling the percentage of time spent downwind of a highway increases mortality among individuals 75 or older by 3.8%-6.5%. These estimates are robust and imply significant loss of life years.
© The Author(s) 2019. Published by Oxford University Press on behalf of European Economic Association.
Figures
References
-
- Arceo-Gomez Eva O., Hanna Rema, Oliva Paulina (2016). “Does the Effect of Pollution on Infant Mortality Differ between Developing and Developed Countries? Evidence from Mexico City.” Economic Journal, 126(591), 257–280.
-
- Banzhaf H. Spencer, Walsh Randall P. (2008). “Do People Vote with Their Feet? An Empirical Test of Tiebout's Mechanism.” American Economic Review, 98(3), 843–863.
-
- Barreca Alan I., Guldi Melanie, Lindo Jason M., Waddell Glen R. (2011). “Saving Babies? Revisiting the Effect of Very Low Birth Weight Classification.” The Quarterly Journal of Economics, 126, 2117–2123. - PubMed
-
- Brauner Elvira Vaclavik, Forchhammer Lykke, Møller Peter, Simonsen Jacob, Glasius Marianne, Wåhlin Peter, Raaschou-Nielsen Ole, Loft Steffen (2007). “Exposure to Ultrafine Particles from Ambient Air and Oxidative Stress-Induced DNA Damage.” Environmental Health Perspectives, 115, 1177–1182. - PMC - PubMed
-
- Brook Robert D., Urch Bruce, Dvonch J. Timothy, Bard Robert L., Speck Mary, Keeler Gerald, Morishita Masako, Kaciroti Niko, Harkema Jack, Corey Paul, Silverman Frances, Wellenius Greg, Mittleman Murray A., Rajagopalan Sanjay, Brook Jeffrey R. (2009). “Insights Into the Mechanisms and Mediators of the Effects of Air Pollution Exposure on Blood Pressure and Vascular Function in Healthy Humans.” Hypertension, 54, 659–667. - PMC - PubMed
Grants and funding
LinkOut - more resources
Full Text Sources
Research Materials