Observational Study
. 2020 Jul 29;10(21):9663-9673.
doi: 10.7150/thno.47980. eCollection 2020.

Myocardial injury and COVID-19: Serum hs-cTnI level in risk stratification and the prediction of 30-day fatality in COVID-19 patients with no prior cardiovascular disease

Affiliations
Observational Study

Myocardial injury and COVID-19: Serum hs-cTnI level in risk stratification and the prediction of 30-day fatality in COVID-19 patients with no prior cardiovascular disease

Jiatian Cao et al. Theranostics. .

Abstract

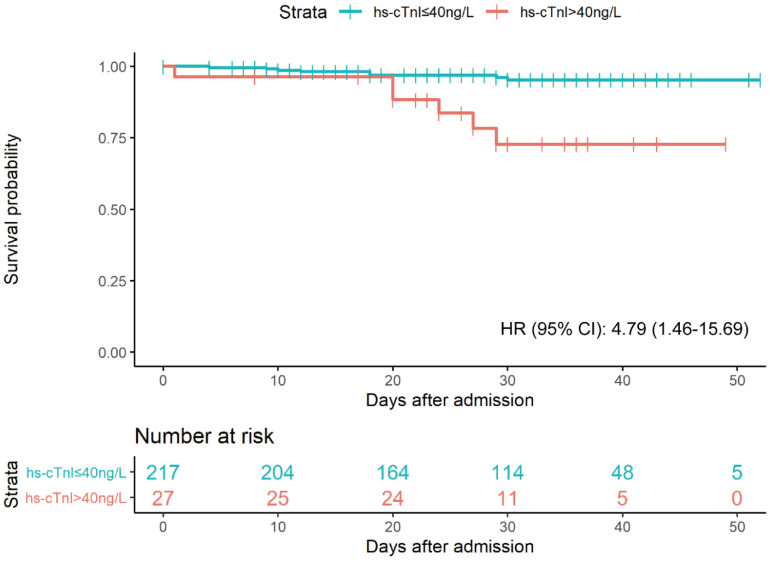
Introduction: To explore the involvement of the cardiovascular system in coronavirus disease 2019 (COVID-19), we investigated whether myocardial injury occurred in COVID-19 patients and assessed the performance of serum high-sensitivity cardiac Troponin I (hs-cTnI) levels in predicting disease severity and 30-day in-hospital fatality. Methods: We included 244 COVID-19 patients, who were admitted to Renmin Hospital of Wuhan University with no preexisting cardiovascular disease or renal dysfunction. We analyzed the data including patients' clinical characteristics, cardiac biomarkers, severity of medical conditions, and 30-day in-hospital fatality. We performed multivariable Cox regressions and the receiver operating characteristic analysis to assess the association of cardiac biomarkers on admission with disease severity and prognosis. Results: In this retrospective observational study, 11% of COVID-19 patients had increased hs-cTnI levels (>40 ng/L) on admission. Of note, serum hs-cTnI levels were positively associated with the severity of medical conditions (median [interquartile range (IQR)]: 6.00 [6.00-6.00] ng/L in 91 patients with moderate conditions, 6.00 [6.00-18.00] ng/L in 107 patients with severe conditions, and 11.00 [6.00-56.75] ng/L in 46 patients with critical conditions, P for trend=0.001). Moreover, compared with those with normal cTnI levels, patients with increased hs-cTnI levels had higher in-hospital fatality (adjusted hazard ratio [95% CI]: 4.79 [1.46-15.69]). The receiver-operating characteristic curve analysis suggested that the inclusion of hs-cTnI levels into a panel of empirical prognostic factors substantially improved the prediction performance for severe or critical conditions (area under the curve (AUC): 0.71 (95% CI: 0.65-0.78) vs. 0.65 (0.58-0.72), P=0.01), as well as for 30-day fatality (AUC: 0.91 (0.85-0.96) vs. 0.77 (0.62-0.91), P=0.04). A cutoff value of 20 ng/L of hs-cTnI level led to the best prediction to 30-day fatality. Conclusions: In COVID-19 patients with no preexisting cardiovascular disease, 11% had increased hs-cTnI levels. Besides empirical prognostic factors, serum hs-cTnI levels upon admission provided independent prediction to both the severity of the medical condition and 30-day in-hospital fatality. These findings may shed important light on the clinical management of COVID-19.

Keywords: COVID-19; Troponin I; in-hospital fatality; myocardial injury.


Conflict of interest statement

Competing Interests: The authors have declared that no competing interest exists.

Figures

Figure 1
Figure 1
Flowchart of the participants' enrollment, classification, and follow-up. Abbreviations: hs-cTnI, high-sensitivity cardiac troponin I.
Figure 2
Figure 2
Distribution of hs-cTnI according to different severity of medical conditions. A. Distribution of cTnI (log) in subgroups (Moderate, Severe, Critical) of patients according to Clinical Classifications. B. Percentage of segments according to cTnI levels (cTnI ≤ 40ng/L or cTnI > 40ng/L ) in Moderate, Severe, or Critical group. The percentage of patients with elevated cTnI levels was positively correlated to the severity of disease conditions (Moderate 1.1%, Severe 13.1%, Critical 26.1%).
Figure 3
Figure 3
Kaplan-Meier plot for survial past hospital admission stratified by hs-cTnI levels. Patients were considered to be right-censored if they were discharged alive from hospital or were still in hospital at the time of data freeze (March 22, 2020). P were estimated from log-rank test. HR were estimated from multivariable Cox proportional hazards regression models after adjustment of age, sex, hypertension, diabetes, and eGFR.
Figure 4
Figure 4
ROC curves of hierarchy predictive models. A. ROC curves for the classification of severe or worse medical conditions. Model 1 is the basic model, included age, sex, hypertension, diabetes, and eGFR, with an AUC1=0.645 (95% CI: 0.575-0.716); Model 2 further included hs-cTnI (log), with an AUC2 = 0.712 (95% CI: 0.648-0.776); and P=0.01 for difference between AUC 1 and AUC2. B. ROC curves for the prediction of in-hospital fatality. Model 1 is the basic model, included age, sex, hypertension, diabetes, and eGFR, with an AUC1 = 0.765 (95% CI: 0.621-0.908); Model 2: further included hs-cTnI (log), with an AUC2 =0.905 (95% CI: 0.853-0.957); and P=0.039 for difference between AUC 1 and AUC2. Model 3: Model 1 + clinical severity condition on admission (i.e., moderate, severe, critical), AUC3 = 0.925 (95% CI: 0.873-0.978); P=0.012 for difference between AUC1 and AUC3, and P=0.47 for difference between AUC2 and AUC3. C. ROC curves for the prediction of 30-day in-hospital fatality. Model 1 is the basic model, included age, sex, hypertension, diabetes, and eGFR, with AUC1 = 0.765 (95% CI: 0.621-0.908); Model 2: further included a binary hs-cTnI variable (cut point=40 ng/L), AUC2 = 0.815 (95% CI: 0.715-0.915); P=0.279 for difference between AUC1 and AUC2. Model 3: further included a binary hs-cTnI variable (cut point=20 ng/L), AUC3 = 0.911 (95% CI: 0.844-0.979); P=0.028 for difference between AUC1 and AUC3, and P=0.026 for difference between AUC2 and AUC3. Abbreviations: ROC, receiver operating characteristic; AUC, area under the curve; eGFR, estimated glomerular filtration rate; and hs-cTnI, high-sensitivity cardiac troponin I.

Similar articles

Cited by

References

    1. World Health Organization. Coronavirus disease (COVID-19) pandemic. 2020.
    1. Novel Coronavirus Pneumonia Emergency Response Epidemiology Team. The epidemiological characteristics of an outbreak of 2019 novel coronavirus diseases (COVID-19) in China. Zhonghua Liu Xing Bing Xue Za Zhi. 2020;41:145–51. - PubMed
    1. Chen N, Zhou M, Dong X, Qu J, Gong F, Han Y. et al. Epidemiological and clinical characteristics of 99 cases of 2019 novel coronavirus pneumonia in Wuhan, China: a descriptive study. Lancet. 2020;395:507–13. - PMC - PubMed
    1. Huang C, Wang Y, Li X, Ren L, Zhao J, Hu Y. et al. Clinical features of patients infected with 2019 novel coronavirus in Wuhan, China. Lancet. 2020;395:497–506. - PMC - PubMed
    1. Aggarwal G, Cheruiyot I, Aggarwal S, Wong J, Lippi G, Lavie CJ, Association of cardiovascular disease with coronavirus disease 2019 (COVID-19) severity: a meta-analysis. Current Problems in Cardiology. 2020. p: 100617. - PMC - PubMed

Publication types

MeSH terms