

Fibrinogen-like protein 2 aggravates nonalcoholic steatohepatitis via interaction with TLR4, eliciting inflammation in macrophages and inducing hepatic lipid metabolism disorder
- PMID: 32863955
- PMCID: PMC7449923
- DOI: 10.7150/thno.44297
Fibrinogen-like protein 2 aggravates nonalcoholic steatohepatitis via interaction with TLR4, eliciting inflammation in macrophages and inducing hepatic lipid metabolism disorder
Abstract
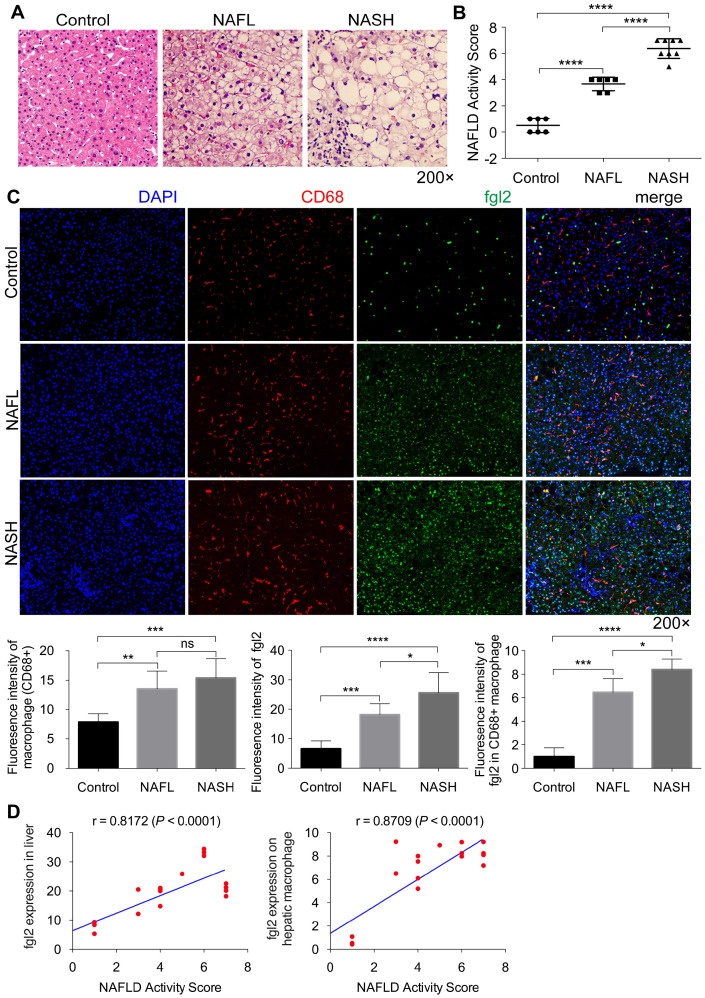
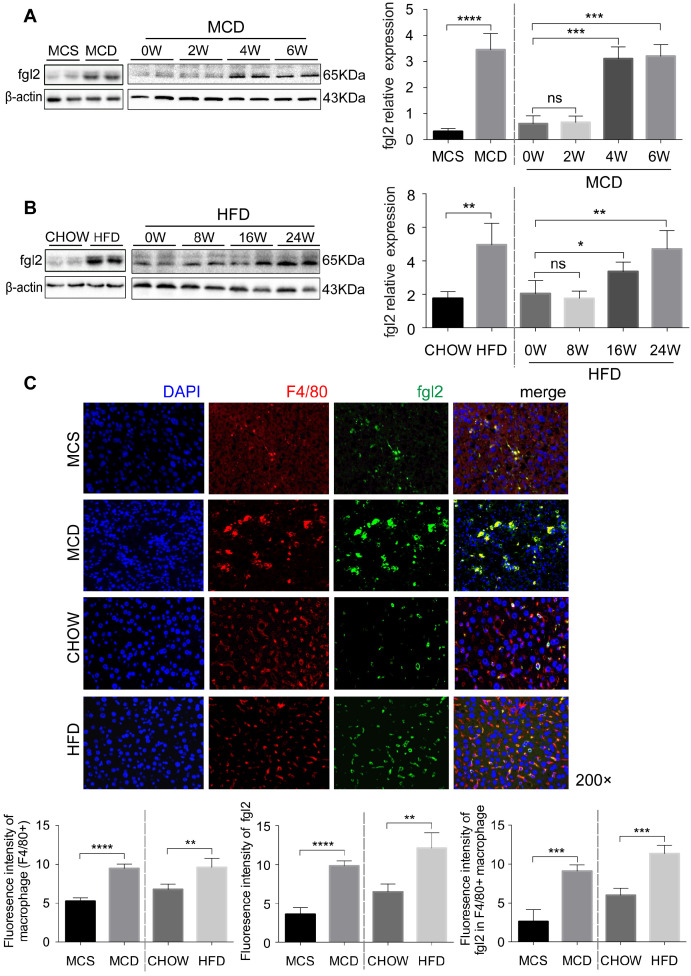
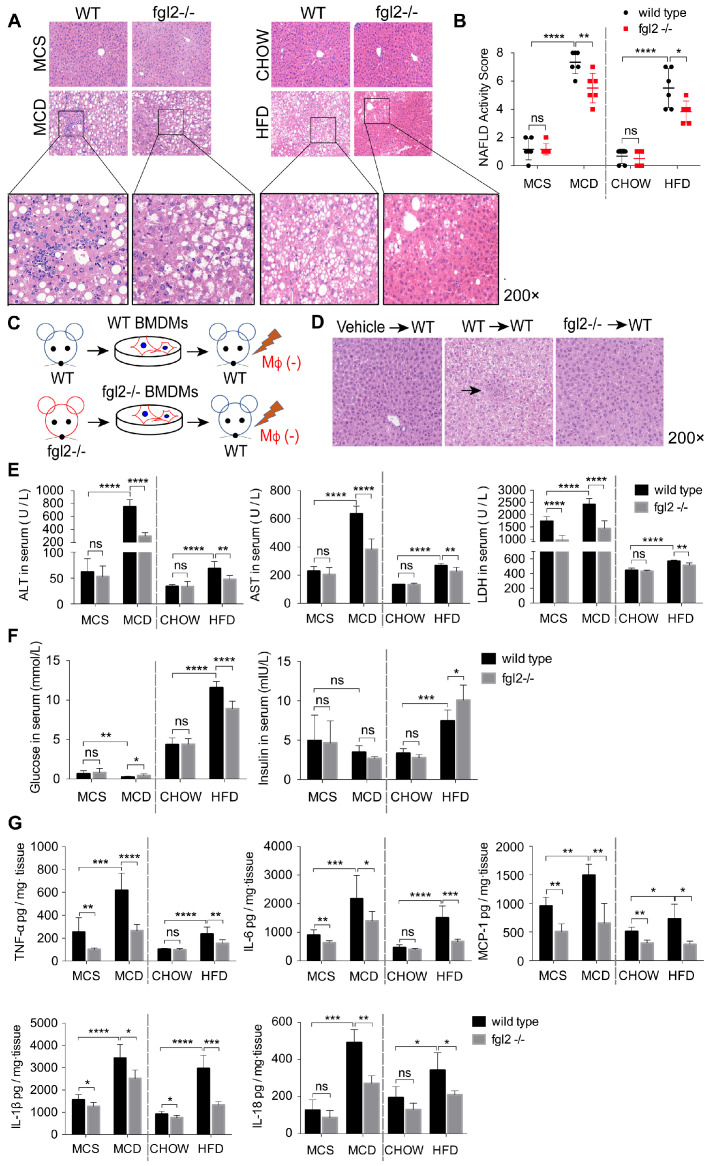
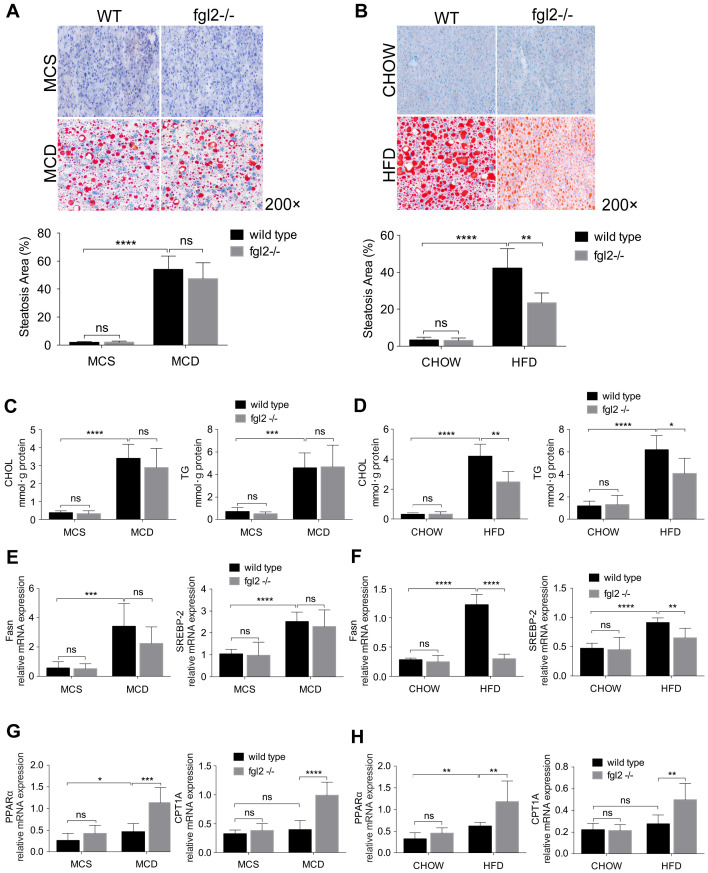
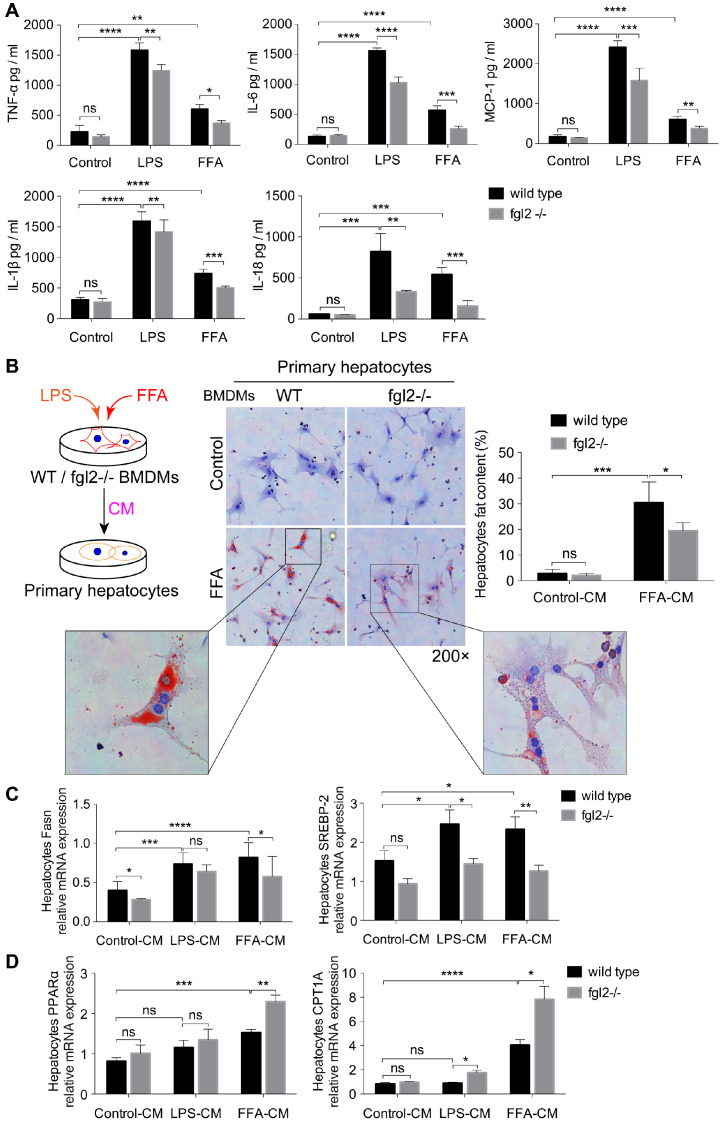
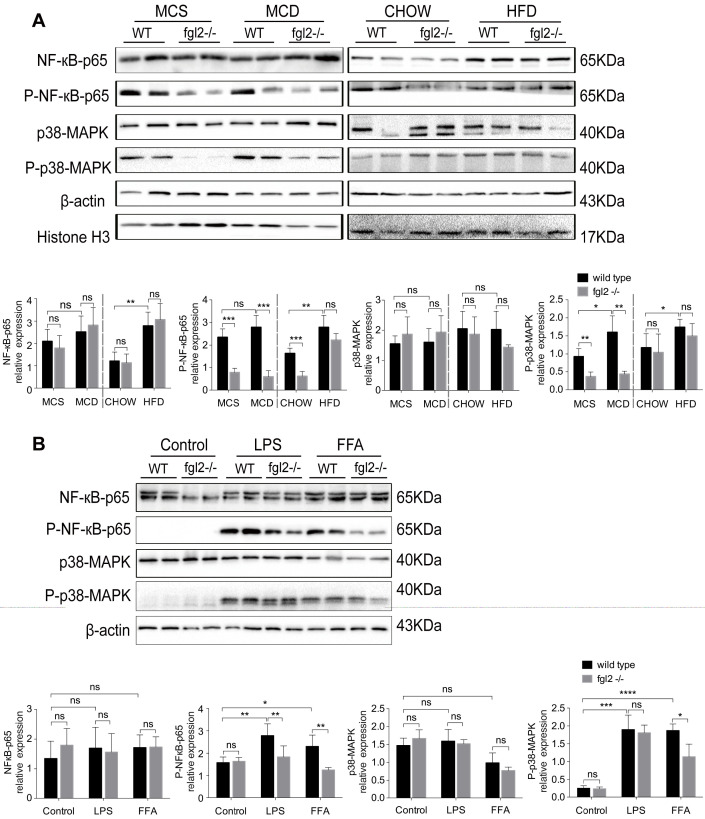
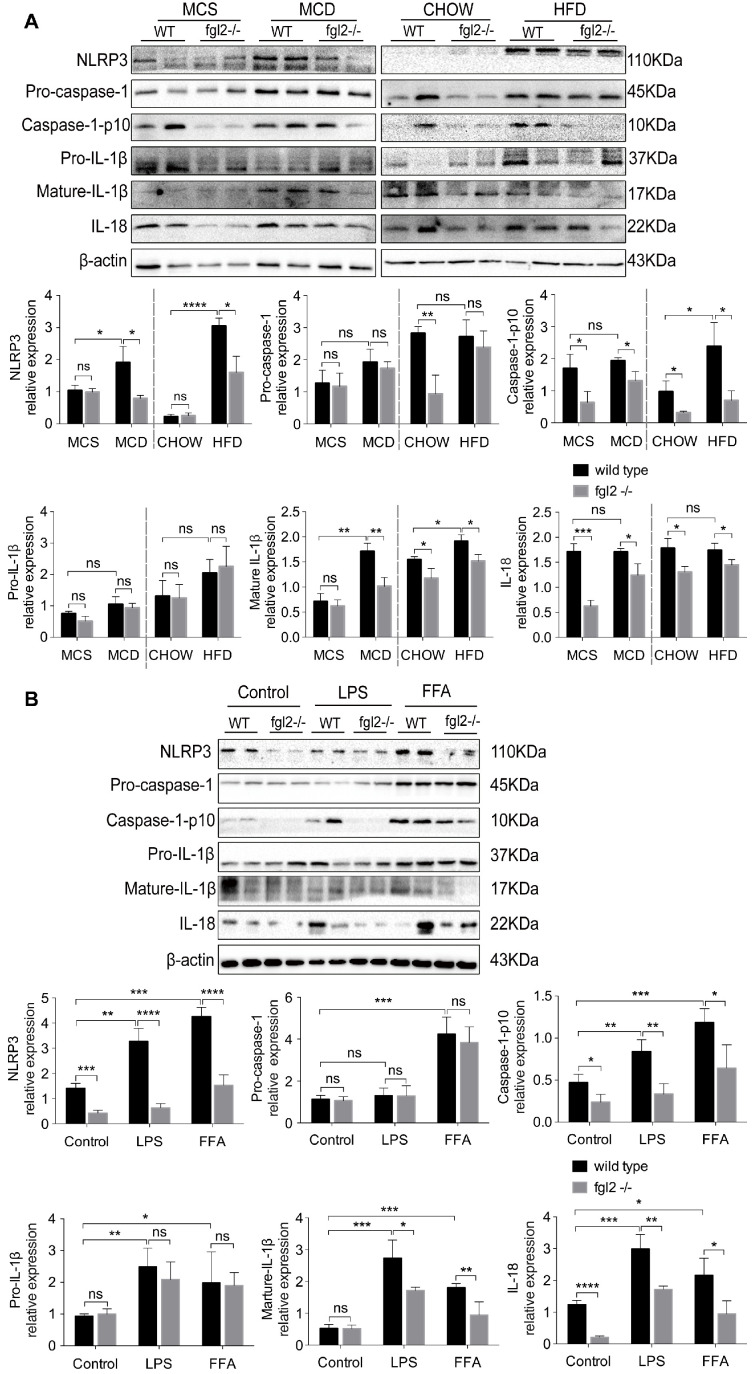
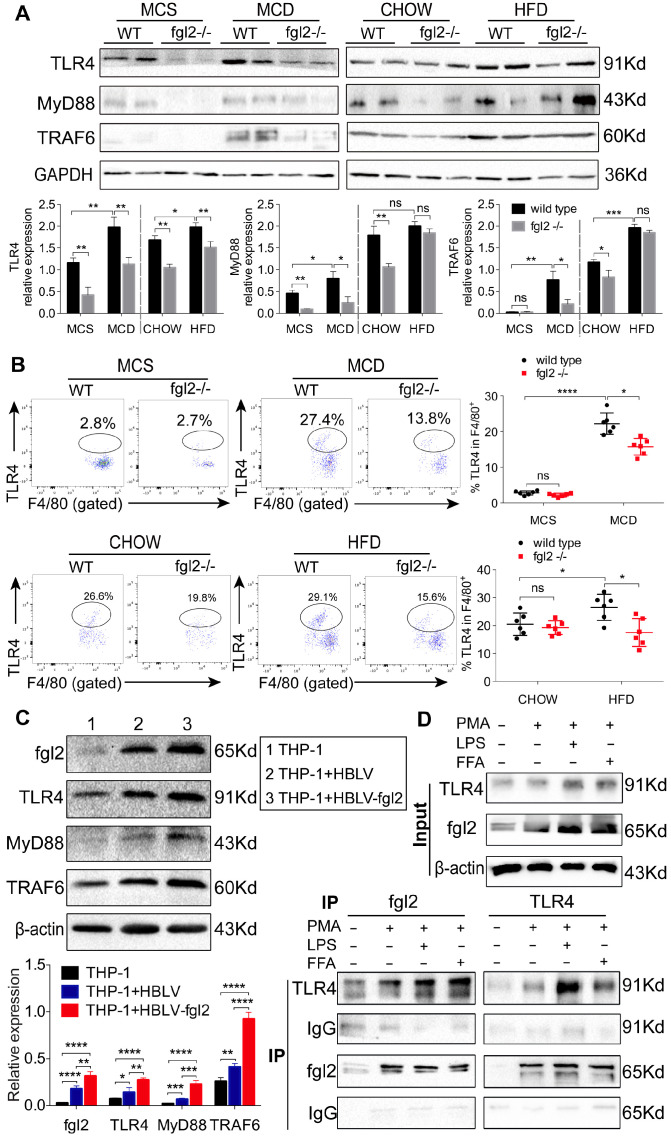
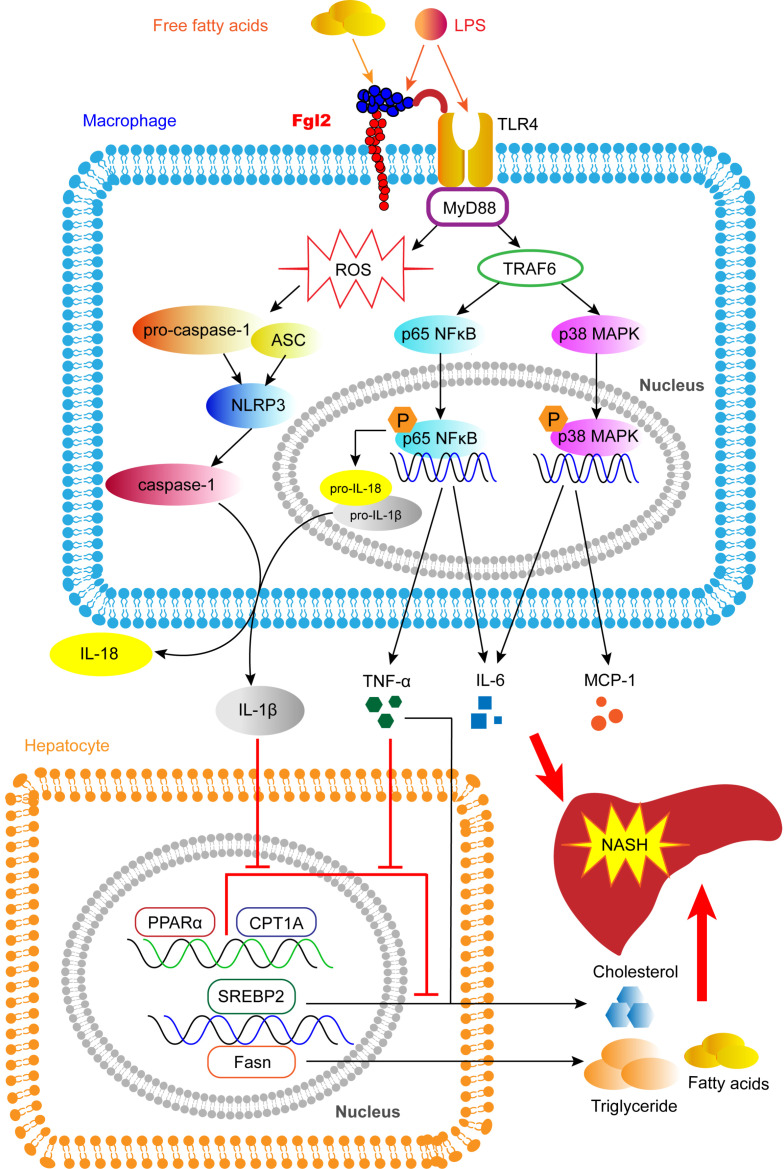
Rationale: The functions of fibrinogen-like protein 2 (fgl2) have been studied in many inflammatory and neoplastic diseases, but the role of fgl2 in nonalcoholic fatty liver disease has not yet been elucidated. In this study, we sought to investigate the role of fgl2 in the pathogenesis of nonalcoholic steatohepatitis (NASH). Methods: Hepatic fgl2 expression was tested in patients with nonalcoholic fatty liver (NAFL) or NASH and controls. Wild-type and fgl2-/- C57BL/6 mice were subjected to a methionine/choline-deficient (MCD) diet or a high-fat diet (HFD) to establish NASH models. Bone marrow-derived macrophages (BMDMs) stimulated with LPS or free fatty acids were used for the in vitro study. Results: In both humans and mice with NASH, macrophage accumulation was concomitant with significantly increased fgl2 expression in the liver. Fgl2 deficiency attenuated liver steatosis and inflammation in diet-induced murine models of NASH. In both liver tissues and BMDMs from NASH mice, fgl2 deficiency resulted in reduced levels of proinflammatory cytokines and reactive oxygen species (ROS) compared with levels in wild-type controls. Activation of NF-κB, p38-MAPK and NLRP3 inflammasomes was also suppressed upon fgl2 disruption. Moreover, lipogenic genes (Fasn and SREBP-2) were downregulated while lipolytic genes (PPAR and CPT1A) were upregulated in the livers of fgl2-/- NASH mice. Primary hepatocytes incubated with the medium collected from fgl2-/- BMDMs showed less fat deposition than those incubated with WT BMDMs. Furthermore, we discovered that fgl2 combined with TLR4 mediates the activation of the Myd88-dependent signaling pathway, which may contribute to inflammation and lipid metabolism disorders. Conclusions: These data suggest that fgl2 aggravates the progression of NASH through activation of NF-κB, p38-MAPK and NLRP3 inflammasomes in macrophages, which consequently induces overproduction of proinflammatory cytokines and lipid metabolism disorders. An interaction of fgl2 and TLR4 may in part contribute to the activation of inflammatory signaling pathways in macrophages.
Keywords: Fibrinogen-like protein 2; Lipid metabolism; Macrophage; Nonalcoholic steatohepatitis; Toll-like receptor 4.
© The author(s).
Conflict of interest statement
Competing Interests: The authors have declared that no competing interest exists.
Figures
Similar articles
-
Regulation of lipid-induced macrophage polarization through modulating peroxisome proliferator-activated receptor-gamma activity affects hepatic lipid metabolism via a Toll-like receptor 4/NF-κB signaling pathway.J Gastroenterol Hepatol. 2020 Nov;35(11):1998-2008. doi: 10.1111/jgh.15025. Epub 2020 Mar 18. J Gastroenterol Hepatol. 2020. PMID: 32128893
-
PTPROt aggravates inflammation by enhancing NF-κB activation in liver macrophages during nonalcoholic steatohepatitis.Theranostics. 2020 Apr 6;10(12):5290-5304. doi: 10.7150/thno.42658. eCollection 2020. Theranostics. 2020. PMID: 32373213 Free PMC article.
-
Gentiopicroside improves NASH and liver fibrosis by suppressing TLR4 and NLRP3 signaling pathways.Biomed Pharmacother. 2024 Aug;177:116952. doi: 10.1016/j.biopha.2024.116952. Epub 2024 Jun 24. Biomed Pharmacother. 2024. PMID: 38917754
-
Pathogenesis of NASH: How Metabolic Complications of Overnutrition Favour Lipotoxicity and Pro-Inflammatory Fatty Liver Disease.Adv Exp Med Biol. 2018;1061:19-44. doi: 10.1007/978-981-10-8684-7_3. Adv Exp Med Biol. 2018. PMID: 29956204 Review.
-
Mechanisms of Fibrosis Development in Nonalcoholic Steatohepatitis.Gastroenterology. 2020 May;158(7):1913-1928. doi: 10.1053/j.gastro.2019.11.311. Epub 2020 Feb 8. Gastroenterology. 2020. PMID: 32044315 Free PMC article. Review.
Cited by
-
GPAT3 regulates the synthesis of lipid intermediate LPA and exacerbates Kupffer cell inflammation mediated by the ERK signaling pathway.Cell Death Dis. 2023 Mar 24;14(3):208. doi: 10.1038/s41419-023-05741-z. Cell Death Dis. 2023. PMID: 36964139 Free PMC article.
-
The role of the interplay between macrophage glycolytic reprogramming and NLRP3 inflammasome activation in acute lung injury/acute respiratory distress syndrome.Clin Transl Med. 2024 Dec;14(12):e70098. doi: 10.1002/ctm2.70098. Clin Transl Med. 2024. PMID: 39623879 Free PMC article. Review.
-
Association between cardiometabolic index and all-cause and cause-specific mortality among the general population: NHANES 1999-2018.Lipids Health Dis. 2024 Dec 27;23(1):425. doi: 10.1186/s12944-024-02408-2. Lipids Health Dis. 2024. PMID: 39731068 Free PMC article.
-
Signaling Pathways Involved in Acute Pancreatitis.J Inflamm Res. 2025 Feb 17;18:2287-2303. doi: 10.2147/JIR.S485804. eCollection 2025. J Inflamm Res. 2025. PMID: 40230438 Free PMC article. Review.
-
Exosome-inflammasome crosstalk and their roles in inflammatory responses.Theranostics. 2021 Mar 4;11(9):4436-4451. doi: 10.7150/thno.54004. eCollection 2021. Theranostics. 2021. PMID: 33754070 Free PMC article. Review.
References
-
- Musso G, Cassader M, Gambino R. Non-alcoholic steatohepatitis: emerging molecular targets and therapeutic strategies. Nat Rev Drug Discov. 2016;15:249–74. - PubMed
-
- Eslam M, Valenti L, Romeo S. Genetics and epigenetics of NAFLD and NASH: Clinical impact. J Hepatol. 2018;68:268–79. - PubMed
-
- Wong RJ, Aguilar M, Cheung R, Perumpail RB, Harrison SA, Younossi ZM. et al. Nonalcoholic Steatohepatitis Is the Second Leading Etiology of Liver Disease Among Adults Awaiting Liver Transplantation in the United States. Gastroenterology. 2015;148:547–55. - PubMed
-
- Tilg H, Diehl AM. Cytokines in alcoholic and nonalcoholic steatohepatitis. N Engl J Med. 2000;343:1467–76. - PubMed
Publication types
MeSH terms
Substances
LinkOut - more resources
Full Text Sources
Medical
Molecular Biology Databases
Miscellaneous
