. 2020 Aug 15;65(15):1268-1280.
doi: 10.1016/j.scib.2020.03.025. Epub 2020 Mar 19.

Impaired function of the suprachiasmatic nucleus rescues the loss of body temperature homeostasis caused by time-restricted feeding

Affiliations

Impaired function of the suprachiasmatic nucleus rescues the loss of body temperature homeostasis caused by time-restricted feeding

Zhihui Zhang et al. Sci Bull (Beijing). .

Abstract

The suprachiasmatic nucleus (SCN) is the master circadian pacemaker that drives body temperature rhythm. Time-restricted feeding (TRF) has potential as a preventative or therapeutic approach against many diseases. The potential side effects of TRF remain unknown. Here we show that a 4-hour TRF stimulus in mice can severely impair body temperature homeostasis and can result in lethality. Nearly half of the mice died at 21 °C, and all mice died at 18 °C during 4-hour TRF. Moreover, this effect was modulated by the circadian clock and was associated with severe hypothermia due to loss of body temperature homeostasis, which is different from "torpor", an adaptive response under food deprivation. Disrupting the circadian clock by the SCN lesions or a non-invasive method (constant light) which disrupts circadian clock rescued lethality during TRF. Analysis of circadian gene expression in the dorsomedial hypothalamus (DMH) demonstrated that TRF reprograms rhythmic transcriptome in DMH and suppresses expression of genes, such as Ccr5 and Calcrl, which are involved in thermoregulation. We demonstrate a side effect of 4-hour TRF on the homeostasis of body temperature and a rescue function by impairing the SCN function. Altogether, our results suggested that constructing a circadian arrhythmicity may have a beneficial effect on the host response to an acute stress.

Keywords: Body temperature; Circadian Clock; Hypothermia; The dorsomedial hypothalamus; The suprachiasmatic nucleus; Time-restricted feeding.


Conflict of interest statement

Conflict of interest The authors declare that they have no conflict of interest

Figures

Fig. 1.
Fig. 1.
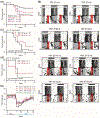
Survival of mice is reduced under TRF at temperatures only slightly below typical room temperatures, (a) A diagram showing the experimental design for TRF treatment. AL: ad libitum and thereafter, (b , c) Kaplan-Meier survival curves of mice fed at ZT4-8 (b) and ZT16-20 (c) at indicated ambient temperatures. Number of mice per group (n) is given in each graph. A log-rank test showed significant differences between different groups of mice: at ZT4-8: 25 °C vs. 21 °C (p=0.0019), 25 °C vs. 19.5 °C (p=0.0002), 21 °C vs. 19.5 °C (p=0.1014), 19.5 °C vs. 18 °C (p=0.0182); at ZT16-20: 25 °C vs. 21 °C (p=0.0006), 21 °C vs. 19.5 °C (p=0.437), 21 °C vs. 18 °C (p<0.0001), 19.5 °C vs. 18 °C (p=0.0015); and ZT4-8 vs. ZT16-20 at 18 °C (p=0.002). No significant differences between ZT4-8 and ZT 16-20 were observed at 19.5 °C and 21 °C. (d) Kaplan-Meier survival curves of mice fed at ZT 16-20 at indicated conditions. Number of mice per group (n) was indicated. A log-rank test showed significant differences between different groups of mice: group-housed mice (black curve) vs. individually-housed mice (green curve) at 18 °C (p<0.0001). The purple curve indicates the group that was subjected to TRF at 25 °C for 2 days before switching to 18 °C, this group vs. the 18 °C group (green curve) (p=0.0031). The experiments were ended at day 15.
Fig. 2.
Fig. 2.
The circadian clock affects the survival of mice subjected to time-restricted feeding, (a) Kaplan-Meier survival curves of mice subjected to TRF at the indicated time points at 21 °C; ZT10-14 vs. ZT22-2 (p= 0.0084), ZT10-14 vs. ZT4-8 (p=0.0006), ZT10-14 vs. ZT16-20 (p=0.0001), ZT22-2 vs. ZT4-8 (p=0.4688), ZT22-2 vs. ZT 16-20 (p=0.3281). (b) Representative double-plotted locomotor actograms shown for mice first fed ad libitum for two weeks and then subjected to TRF for two weeks at the indicated time points at 21 °C. The feeding time is indicated in the red-filled box and the top of actograms. Periods of darkness and light are indicated the black and white bars, respectively, (c, d) Kaplan-Meier survival curves of Per1/2 double knockout mice (c) and Cry1/2 double knockout mice (d) subjected to TRF treatment at ZT10-14 and ZT16-20, p values are indicated in the graphs, (e) Food intake of mice fed ad libitum was recorded for 7 days before the start of the indicated TRF treatment, which lasted for 12 days. Data of food intake only including the survival mice, and the curve is similar to previous reports. Prism two-way ANOVA with Bonferroni’s post hoc test was used to determine the significant interactions of food intake among the different groups: ZT10-14 vs. ZT16-20 at 21 °C (p=0.268), 25 °C vs. 21 °C (p=0.5796) or 19.5 °C (p=0.8447), 19.5 °C vs. 21 °C (p=0.7471) at ZT16-20. For the food intake of ad libitum fed period, 25 °C vs. 19.5 °C or 21 °C (p< 0.001), the first five days food intake of the TRF treatment between ZT10-14 and ZT16-20 at 21 °C (dayl, p<0.0001, day2, p=0.0277, day3, p=0.0015, day4, p=0.0377, day5, p=0.0486).
Fig. 3.
Fig. 3.
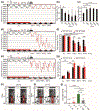
Restricted feeding impairs body temperature homeostasis, (a) Core body temperatures were measured by intra-abdominally implanted thermometers. The representative recording of the body temperatures at each time of day of mice fed ad libitum for four days and then subjected to food consumption at ZT16-20 at Ta of 25 °C (See also Fig. S2a, b, g online). The feeding time is indicated in the red-filled box. Periods of darkness and light are indicated the black and white bars, respectively, (b, c) The body average temperature (b) and body temperature deviation (c) at fed ad libitum and time-restricted feeding day 1 to 4 were averaged separately as ad, TRF1, TRF2, TRF3 and TRF4 and plotted as the mean ± s.e.m at 25 °C. (d) Core body temperatures of mice subjected to food consumption at ZT 16-20 under 21 °C (See also Fig. S2c, d, h online), (e) Core body temperatures of mice subjected to food consumption at ZT10-14 under 21 °C (See also Fig. S2e, f, i online), (f, g) Comparison of the daily body average temperature (f) and body temperature deviation (g) between mice subjected to food consumption at ZT 16-20 and ZT10-14, at fed ad libitum and time-restricted feeding day 1 to 4 were averaged separately as ad libitum, TRF1, TRF2, TRF3 and TRF4 and plotted as the mean ± s.e.m at 21 °C. (h, i) Diurnal locomotion changed in response to restricted feeding. Representative double-plotted locomotion actograms of mice fed ad libitum for two weeks and then subjected to TRF for two weeks at 25 °C (h) or 21 °C (i) (See also Fig. 2b; Fig. S3 online), (j) Percentage distributions of wheel-running activity by time of day were analyzed (See also Fig. S4 online, values represent the average ± s.e.m., * : p < 0.05, * * * : p < 0.001, Error bars: ± s.e.m.).
Fig. 4.
Fig. 4.
Mice with disruption of the SCN function rescued hypothermia and survival. (a, b) SCN sham and lesioned mice were subjected to time-restricted feeding at ZT16-20 at 21 °C. Arrhythmic mice confirmed by locomotor assay (Fig. S5 online) and histological analyses (Fig. S6 online). Restricted feeding region was labeled in red filled bar (TRF). (c, d) Kaplan-Meier survival curves of SCN sham and SCNx mice fed at ZT16-20 (c) and ZT4-8 (d). Log-rank test verified the statistically significant differences, (e, f) The effects of bilateral SCN lesions on the body temperatures of mice subjected to restricted feeding at ZT 16-20. The representative recordings of the body temperatures from the SCN sham (e) and the SCN lesioned mice (f) (See also Fig. S7 online), (g, h) Comparison of daily body average temperature (g) and daily temperature deviation (h) after restricted feeding (ad libitum (AL), TRF1, TRF2, TRF3 and TRF4) in the SCN sham (black bar) and the SCN lesioned mice (red bar). Values represent the average + s.e.m., Error bars: +/− s.e.m., * * : p < 0.01). (i) Kaplan-Meier survival curves of restricted feeding mice under constant light condition (LL) versus constant dark condition (DD). Log-rank test verified the statistically significant differences. Number of mice in each group was indicated in the graph.
Fig. 5.
Fig. 5.
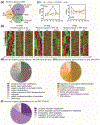
Global reprogramming of the rhythmic transcriptome in the DMH by TRF. (a) Venn diagram displays the total number of rhythmic genes in ad libitum (1533 genes), TRF ZT4-8 (2480 genes) and TRF ZT 16-20 (1436 genes), including common genes, sorted every 4 hr from ZT0. Extracted RNA was processed for RNA-seq, the number of samples in each group (n = 2). The numbers indicated by black lines are the overlapping gene numbers between two groups. Rhythmic genes in each group were determined based on the JTK algorithm (p < 0.05). See also Fig. S9, Tables S1, S2, S3, S4 online. (b) Comparison of the rhythmic genes among ad libitum, TRF ZT4-8, and TRF ZT16-20. Heatmaps display genes exclusively rhythmic in ad libitum (1146) (left panel), TRF ZT4-8 (1800) (middle panel) and TRF ZT16-20 (891) (right panel) (p < 0.05). (c) Expression levels (RPKMs) of circadian output genes of Dbp and Nfil3 in ad libitum, TRF ZT4-8 and TRF ZT16-20 (error bars: mean ± s.e.m., p < 0.001, by Prism two-way ANOVA with Bonferroni’s post hoc test). See also Fig. S10 online. (d) Biological process signatures of common rhythmic genes in the TRF16-20 and TRF4-8 groups. Numbers within the pie charts indicate number of rhythmic genes identified within each biological process based on P value cutoff of 0.05. Two biological replicates per time point were subjected to the RNA sequencing. See also Table S5, S6 and S7 online for each group and Table S8 for enrichment pathways of common rhythmic genes in the TRF16-20 and TRF4-8 groups. (e) Biological process signatures of common rhythmic genes in the ad libitum and TRF ZT4-8 groups. (f) Biological process signatures of common rhythmic genes in the ad libitum and TRF16-20 groups.
Fig. 6.
Fig. 6.
Genes and signal pathways are partially restored in the DMH from lesioned SCN mice. (a, b) Rescue the disturbances of TRF by the SCNx at ZT8 and ZT16. Upper tables represent differential expression (DE) genes between ad libitum and TRF (DE > 2-fold change (<50% or >200%), See also Tables S9, S10 online. Genes rescued (>50%) by the SCNx as DE between TRF and the SCNx (DE > 2-fold change (<50% or >200%) at ZT8 in (a) and ZT16 in (b), See also Tables S11 and S12 online. Heatmaps display the expression levels in ad libitum, TRF, TRF-SCNx at ZT8 (136) and ZT16 (202) (middle lanes). GO enrichment analysis of rescued genes in ZT8 and ZT16 (bottom lanes), (p < 0.05). (c) Common rescued genes in both ZT8 and ZT16 groups. See also Table S13 online. (d, e) Expression levels of genes related to thermoregulation in DMH from ad libitum, TRF and the SCNx-TRF at ZT8 and ZT16. (f) Q-PCR analysis result showing the mRNA levels of genes related to thermoregulation in the DMH from ad libitum, TRF ZT4-8 and TRF ZT16-20 over 24 hr. (g) Q-PCR analysis result showing the mRNA levels of Ccr5 and Calcrl in the hypothalamus under indicated conditions, up: 21 °C AL vs 21°C TRF (p=0.0483), 25°C AL vs 21°C AL (p=0.044), 25°C AL vs 21°C TRF (p=0.0201); down: 25°C AL vs 25°CTRF (p=0.0063), 21°C AL vs 21°C TRF (p=0.0138), 25°C AL vs 21°C TRF (p=0.0044). Values represent the average + s.e.m., Error bars: +/− s.e.m., * : p < 0.05, * * : p < 0.01, Error bars: ± s.e.m..

References

    1. Lowrey PL, Takahashi JS. Genetics of circadian rhythms in mammalian model organisms. Adv Genet, 2011, 74: 175–230 - PMC - PubMed
    1. Shigeyoshi Y, Taguchi K, Yamamoto S, et al. Light-induced resetting of a mammalian circadian clock is associated with rapid induction of the mper1 transcript. Cell, 1997, 91: 1043–1053 - PubMed
    1. Damiola F, Le Minh N, Preitner N, et al. Restricted feeding uncouples circadian oscillators in peripheral tissues from the central pacemaker in the suprachiasmatic nucleus. Genes & development, 2000, 14: 2950–2961 - PMC - PubMed
    1. Eckel-Mahan KL, Patel VR, de Mateo S, et al. Reprogramming of the circadian clock by nutritional challenge. Cell, 2013, 155: 1464–1478 - PMC - PubMed
    1. Okamura H, Miyake S, Sumi Y, et al. Photic induction of mper1 and mper2 in cry-deficient mice lacking a biological clock. Science, 1999, 286: 2531–2534 - PubMed

LinkOut - more resources