. 2019:16:100222.
doi: 10.1016/j.imu.2019.100222. Epub 2019 Aug 18.

Signal quality measure for pulsatile physiological signals using morphological features: Applications in reliability measure for pulse oximetry

Affiliations

Signal quality measure for pulsatile physiological signals using morphological features: Applications in reliability measure for pulse oximetry

Elyas Sabeti et al. Inform Med Unlocked. 2019.

Abstract

Pulse oximetry is a noninvasive and low-cost physiological monitor that measures blood oxygen levels. While the noninvasive nature of pulse oximetry is advantageous, the estimates of oxygen saturation generated by these devices are prone to motion artifacts and ambient noise, reducing the reliability of such estimations. Clinicians combat this by assessing the quality of oxygen saturation estimation by visual inspection of the photoplethysmograph (PPG), which represents changes in pulsatile blood volume and is also generated by the pulse oximeter. In this paper, we propose six morphological features that can be used to determine the quality of the PPG signal and generate a signal quality index. Unlike many similar studies, this approach uses machine learning and does not require a separate signal, such as ECG, for reference. Multiple algorithms were tested against 46 30-min PPG segments of patients with cardiovascular and respiratory conditions, including atrial fibrillation, hypoxia, acute heart failure, pneumonia, ARDS, and pulmonary embolism. These signals were independently annotated for signal quality by two clinicians, with the union of their annotations used as the ground-truth. Similar to any physiological signal recorded in a clinical setting, the utilized dataset is also unbalanced in favor of good quality segments. The experiments showed that a cost-sensitive Support Vector Machine (SVM) outperformed other tested methods and was robust to the unbalanced nature of the data. Though the proposed algorithm was tested on PPG signals, the methodology remains agnostic to the dataset used, and may be applied to any type of pulsatile physiological signal.

Keywords: ARDS; Cost-sensitive SVM; Decision tree ensemble; PPG; Pulsatile physiological signal; Pulse oximetry; Signal quality index.


Figures

Fig. 1.
Fig. 1.
Exemplary segment of PPG signals designated with “bad” quality from both experts (clinicians). A signal segment not annotated as bad quality is assumed to be of good quality.
Fig. 2.
Fig. 2.
The preprocessed (filtering and peak detection) PPG with the following signals/measurements: (1) beat waveform with positive peak, (2) beat waveform with negative peak, (3) negative-to-negative peak jump, (4) positive-to-positive peak jump, (5) positive and negative pulse duration, and (6) backward and forward AC components.
Fig. 3.
Fig. 3.
Cumulative distribution function (CDF) of normalized negative-to-negative peak jump (Pi¯).
Fig. 4.
Fig. 4.
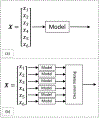
Two training/testing framework used in this paper: (a) a framework for training/testing model on 6-dimensional samples (b) a framework for training/testing six similar models on each 1-dimensional sample feature followed by decision rule, which basically is a logical “or” operation on the six outcomes.
Fig. 5.
Fig. 5.
Inter-rater reliability using Cohen’s Kappa.
Fig. 6.
Fig. 6.
A block diagram of learning process. DT: decision tree, EDT: ensemble of decision trees, SVM: support vector machine, TO: threshold optimization. Models (a) and (b) refer to the two training frameworks illustrated in Fig. 4.
Fig. 7.
Fig. 7.
A visual example of quality result on fixed interval-scale segments using the SVM model with rate (threshold on interval SQI) 0.7. In the first interval (0–8 s) both the algorithm and annotation have poor quality segments in beat-scale, which is less than 5.6 (8 × 0.7) seconds; thus, this interval is not considered poor quality by both the algorithm and the annotation. The second interval (8–16 s) had more than 5.6 s of poor quality beat-scale segments using the algorithm, but slightly less than 5.6 s of poor quality beat-scale segments using the annotation, therefore this interval is labeled as poor quality using the algorithm, but not using the annotation. The last interval (16–24 s) has more than 5.6 s poor quality beat-scale segments in both algorithm and annotation.
Fig. 8.
Fig. 8.
Comparison of ROC curves for the four methods used in this study.

References

    1. Li Q, Clifford GD. Signal quality and data fusion for false alarm reduction in the intensive care unit. J Electrocardiol 2012;45(6):596–603. - PubMed
    1. Silva I, Lee J, Mark RG. Signal quality estimation with multichannel adaptive filtering in intensive care settings. IEEE (Inst Electr Electron Eng) Trans Biomed Eng 2012;59(9): 2476–85. - PMC - PubMed
    1. Rusch T, Sankar R, Scharf J. Signal processing methods for pulse oximetry. Comput Biol Med 1996;26(2):143–59. - PubMed
    1. Lee CH, Yoon H-J. Medical big data: promise and challenges. Kidney Res Clin Pract 2017;36(1):3. - PMC - PubMed
    1. Berner ES, Kasiraman RK, Yu F, Ray MN, Houston TK. Data quality in the outpatient setting: impact on clinical decision support systems. In: AMIA annual symposium proceedings, vol. 2005 American Medical Informatics Association; 2005. p. 41. - PMC - PubMed

LinkOut - more resources