

Mitochondrial relocation of a common synthetic antibiotic: A non-genotoxic approach to cancer therapy
- PMID: 32864504
- PMCID: PMC7454229
- DOI: 10.1016/j.chempr.2020.03.004
Mitochondrial relocation of a common synthetic antibiotic: A non-genotoxic approach to cancer therapy
Abstract
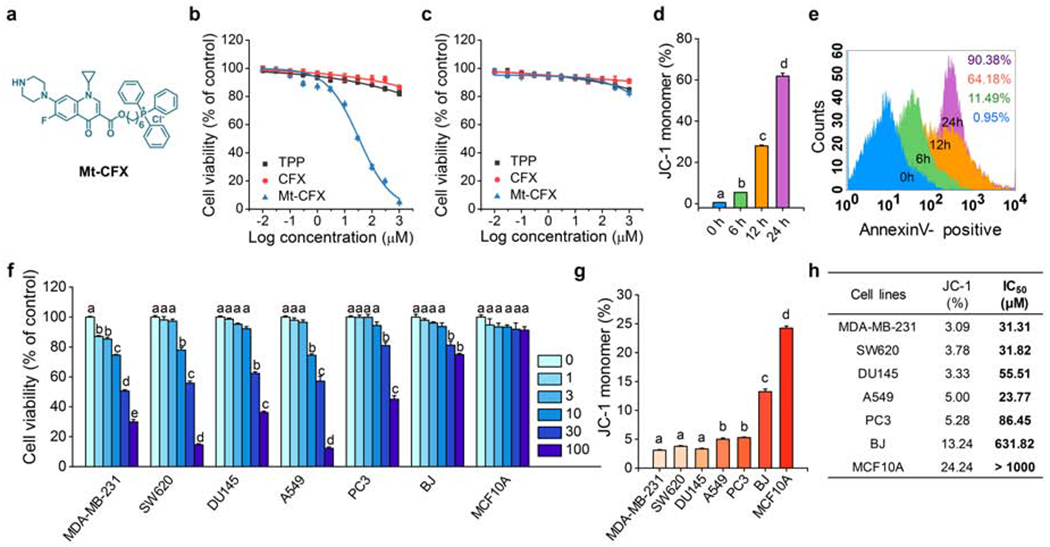
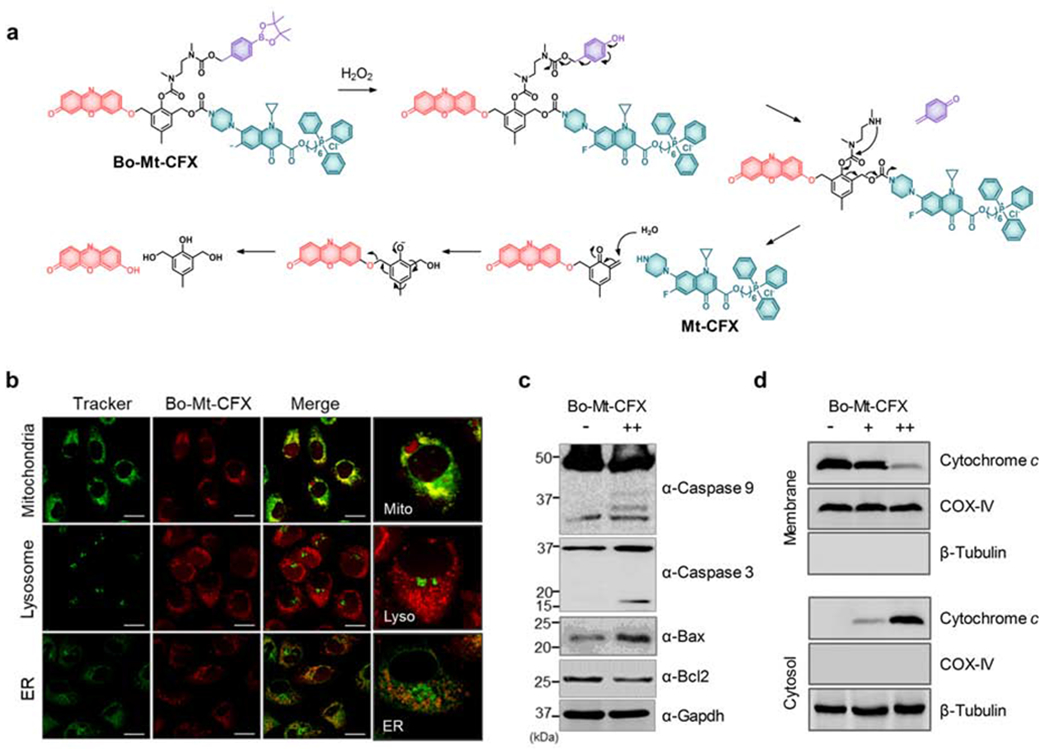
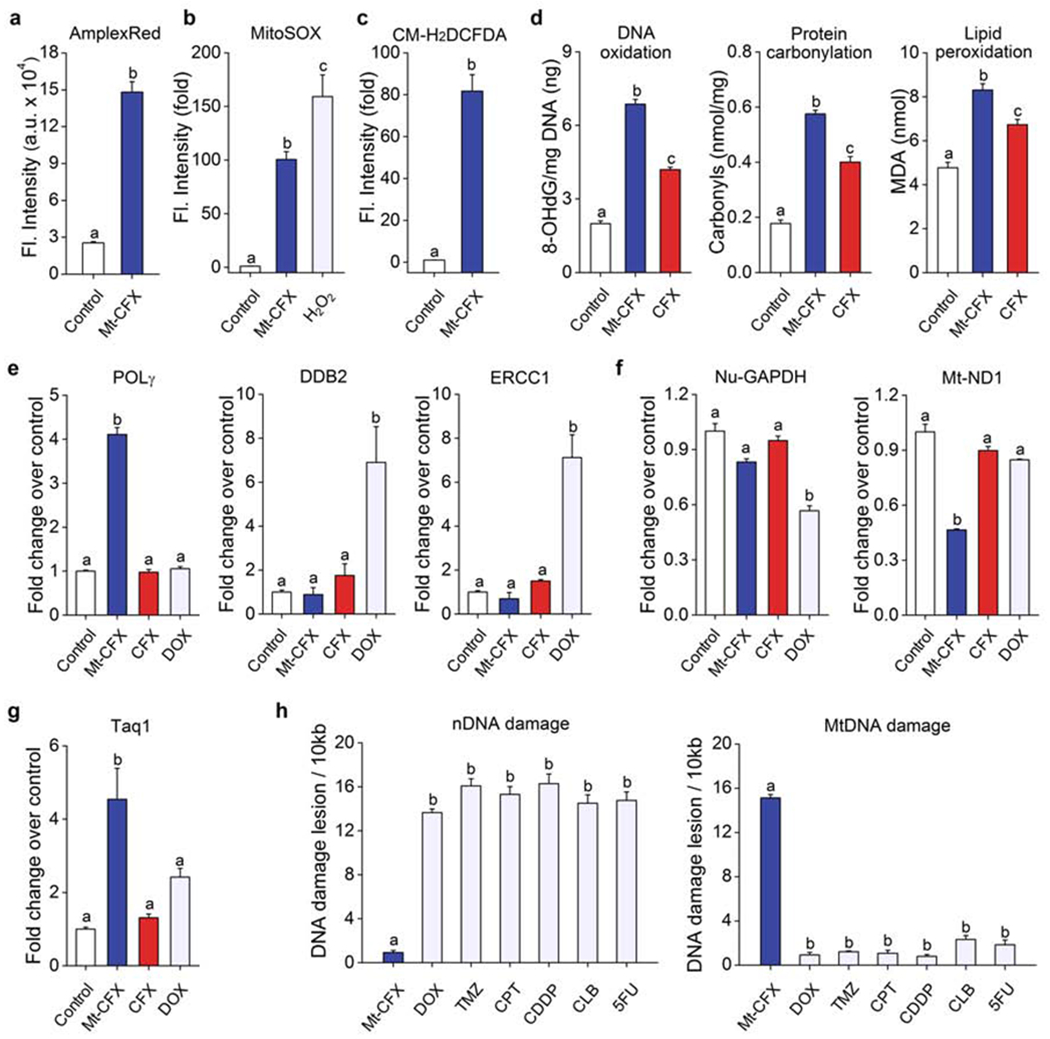
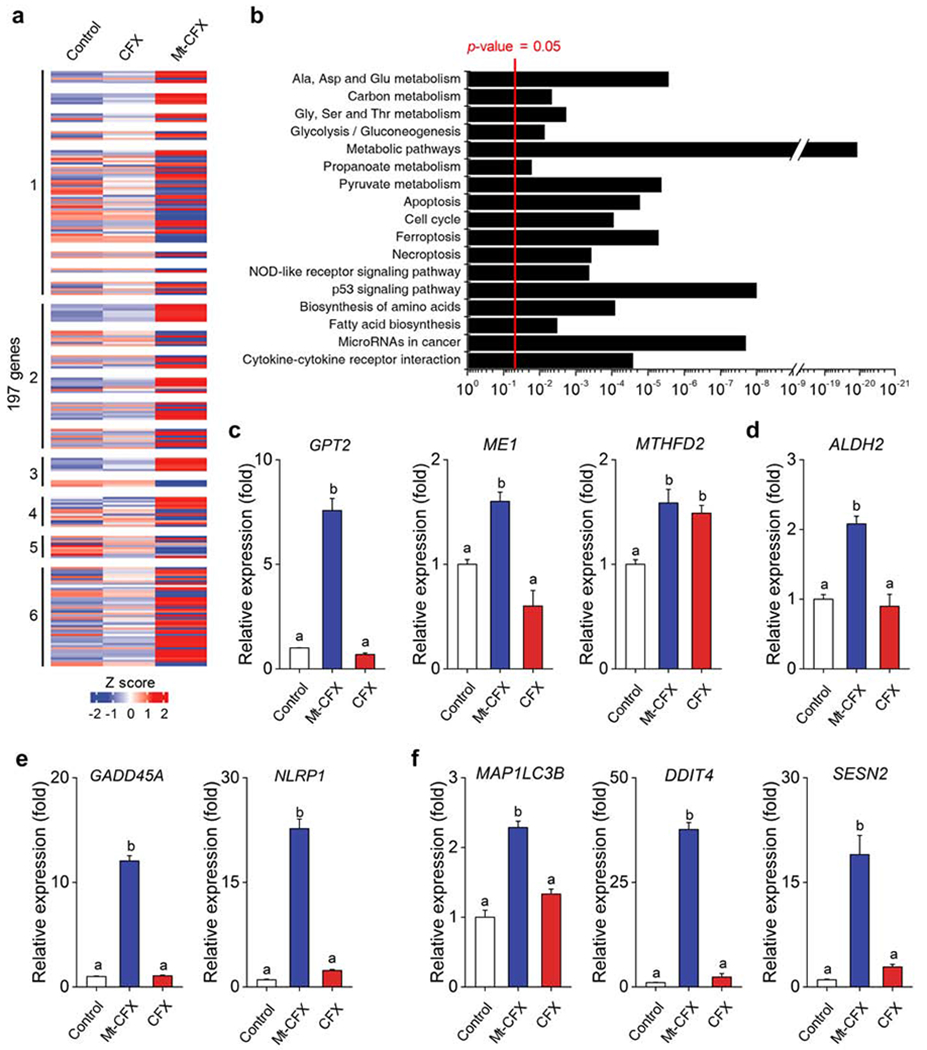
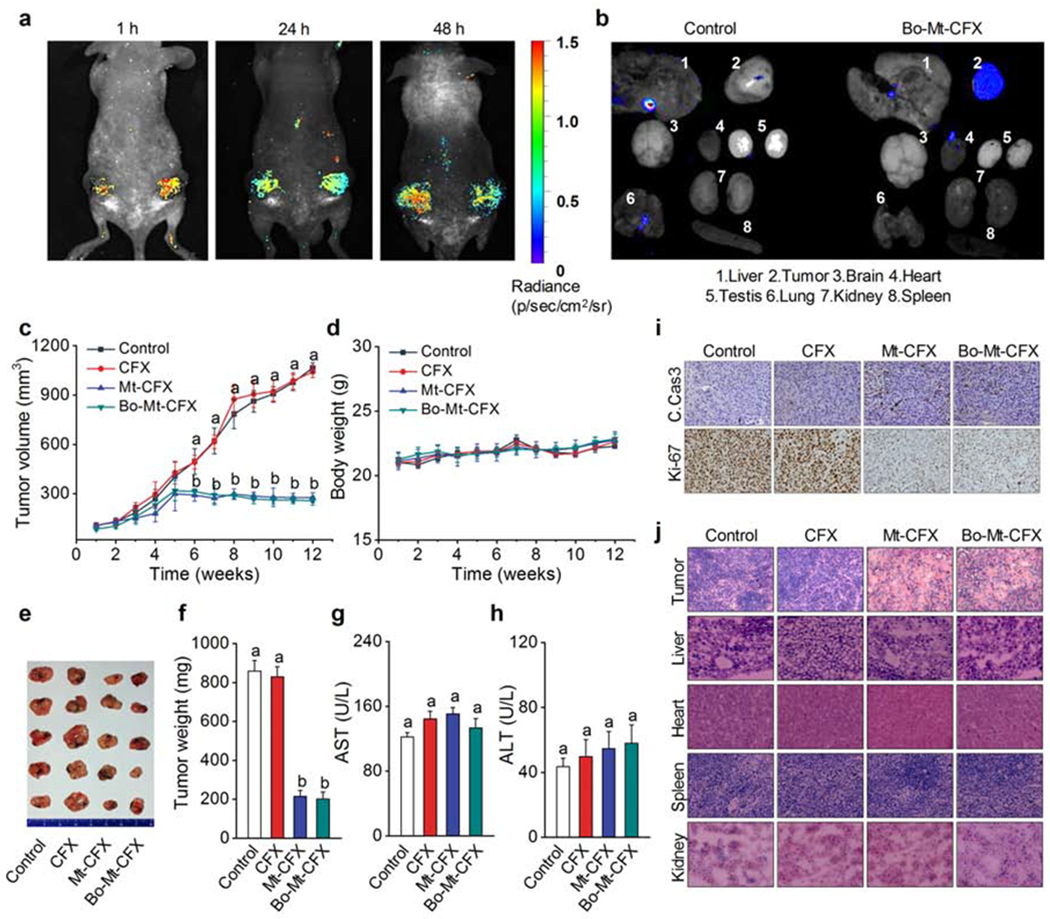
Tumor recurrence as a result of therapy-induced nuclear DNA lesions is a major issue in cancer treatment. Currently, only a few examples of potentially non-genotoxic drugs have been reported. Mitochondrial re-localization of ciprofloxacin, one of the most commonly prescribed synthetic antibiotics, is reported here as a new approach. Conjugating ciprofloxacin to a triphenyl phosphonium group (giving lead Mt-CFX), is used to enhance the concentration of ciprofloxacin in the mitochondria of cancer cells. The localization of Mt-CFX to the mitochondria induces oxidative damage to proteins, mtDNA, and lipids. A large bias in favor of mtDNA damage over nDNA was seen with Mt-CFX, contrary to classic cancer chemotherapeutics. Mt-CFX was found to reduce cancer growth in a xenograft mouse model and proved to be well tolerated. Mitochondrial relocalization of antibiotics could emerge as a useful approach to generating anticancer leads that promote cell death via the selective induction of mitochondrially-mediated oxidative damage.
Keywords: Ciprofloxacin; DNA damage; Mitochondria; Non-genotoxic cancer therapy; Prodrug; Reactive oxygen species; Targeted therapeutics.
Conflict of interest statement
DECLARATION OF INTERESTS Mt-CFX and analogues as non-genotoxic anticancer agents are the subject of a pending patent application, filed by Korea University, with J.S.K, K.S., P.V. and M.W. named as inventors. J.L.S. holds a part-time summer position at Shanghai University.
Figures
Similar articles
-
Mitochondrial DNA damage and altered membrane potential (delta psi) in pancreatic acinar cells induced by reactive oxygen species.Surgery. 1999 Aug;126(2):148-55. Surgery. 1999. PMID: 10455877
-
Mitochondrial DNA damage by bleomycin induces AML cell death.Apoptosis. 2015 Jun;20(6):811-20. doi: 10.1007/s10495-015-1119-z. Apoptosis. 2015. PMID: 25820141
-
Membrane-Targeting Triphenylphosphonium Functionalized Ciprofloxacin for Methicillin-Resistant Staphylococcus aureus (MRSA).Antibiotics (Basel). 2020 Oct 30;9(11):758. doi: 10.3390/antibiotics9110758. Antibiotics (Basel). 2020. PMID: 33143023 Free PMC article.
-
The causes of cancer revisited: "mitochondrial malignancy" and ROS-induced oncogenic transformation - why mitochondria are targets for cancer therapy.Mol Aspects Med. 2010 Apr;31(2):145-70. doi: 10.1016/j.mam.2010.02.008. Epub 2010 Mar 2. Mol Aspects Med. 2010. PMID: 20206201 Review.
-
[Pathways for maintenance of mitochondrial DNA integrity and mitochondrial functions in cells exposed to ionizing radiation].Radiats Biol Radioecol. 2013 Mar-Apr;53(2):117-36. doi: 10.7868/s0869803113020045. Radiats Biol Radioecol. 2013. PMID: 23786028 Review. Russian.
Cited by
-
Rational Design 2-Hydroxypropylphosphonium Salts as Cancer Cell Mitochondria-Targeted Vectors: Synthesis, Structure, and Biological Properties.Molecules. 2021 Oct 20;26(21):6350. doi: 10.3390/molecules26216350. Molecules. 2021. PMID: 34770759 Free PMC article.
-
Functionalized biological metal-organic framework with nanosized coronal structure and hierarchical wrapping pattern for enhanced targeting therapy.Chem Eng J. 2023 Jan 15;456:140963. doi: 10.1016/j.cej.2022.140963. Epub 2022 Dec 14. Chem Eng J. 2023. PMID: 36531859 Free PMC article.
-
Harnessing α-l-fucosidase for in vivo cellular senescence imaging.Chem Sci. 2021 Jun 25;12(29):10054-10062. doi: 10.1039/d1sc02259h. eCollection 2021 Jul 28. Chem Sci. 2021. PMID: 34377399 Free PMC article.
-
Evaluation of Anticancer Activity of 1,3-Oxazol-4-ylphosphonium Salts in Vitro.ChemMedChem. 2022 Oct 19;17(20):e202200319. doi: 10.1002/cmdc.202200319. Epub 2022 Sep 15. ChemMedChem. 2022. PMID: 36037305 Free PMC article.
-
Structurally Redesigned Bioorthogonal Reagents for Mitochondria-Specific Prodrug Activation.JACS Au. 2021 Jan 25;1(1):23-30. doi: 10.1021/jacsau.0c00053. Epub 2020 Dec 15. JACS Au. 2021. PMID: 33554213 Free PMC article.
References
-
- Mehlen P, and Puisieux A (2006) Metastasis: a question of life or death. Nat. Rev. Cancer 6, 449–458. - PubMed
-
- Grosse Y, Baan R, Straif K, Secretan B, El Ghissassi F, Bouvard V, Benbrahim-Tallaa L, Guha N, Galichet L, and Cogliano V (2009) A review of human carcinogens—Part A: pharmaceuticals. Lancet Oncol. 10, 13–14. - PubMed
-
- Eichenauer DA, Thielen I, Haverkamp H, Franklin J, Behringer K, Halbsguth T, Klimm B, Diehl V, Sasse S, Rothe A, et al. (2014) Therapy-related acute myeloid leukemia and myelodysplastic syndromes in patients with Hodgkin lymphoma: a report from the German Hodgkin Study Group. Blood 123, 1658–1664. - PubMed
-
- Pui CH, Ribeiro RC, Hancock ML, Rivera GK, Evans WE, Raimondi SC, Head DR, Behm FG, Mahmoud MH, Sandlund JT, et al. (1991) Acute Myeloid-Leukemia in Children Treated with Epipodophyllotoxins for Acute Lymphoblastic-Leukemia. New Engl. J. Med 325, 1682–1687. - PubMed
-
- Travis LB, Holowaty EJ, Bergfeldt K, Lynch CF, Kohler BA, Wiklund T, Curtis RE, Hall P, Andersson M, Pukkala E, et al. (1999) Risk of leukemia after platinum-based chemotherapy for ovarian cancer. New Engl. J. Med 340, 351–357. - PubMed
Grants and funding
LinkOut - more resources
Full Text Sources
Other Literature Sources