

Automated CT biomarkers for opportunistic prediction of future cardiovascular events and mortality in an asymptomatic screening population: a retrospective cohort study
- PMID: 32864598
- PMCID: PMC7454161
- DOI: 10.1016/S2589-7500(20)30025-X
Automated CT biomarkers for opportunistic prediction of future cardiovascular events and mortality in an asymptomatic screening population: a retrospective cohort study
Abstract
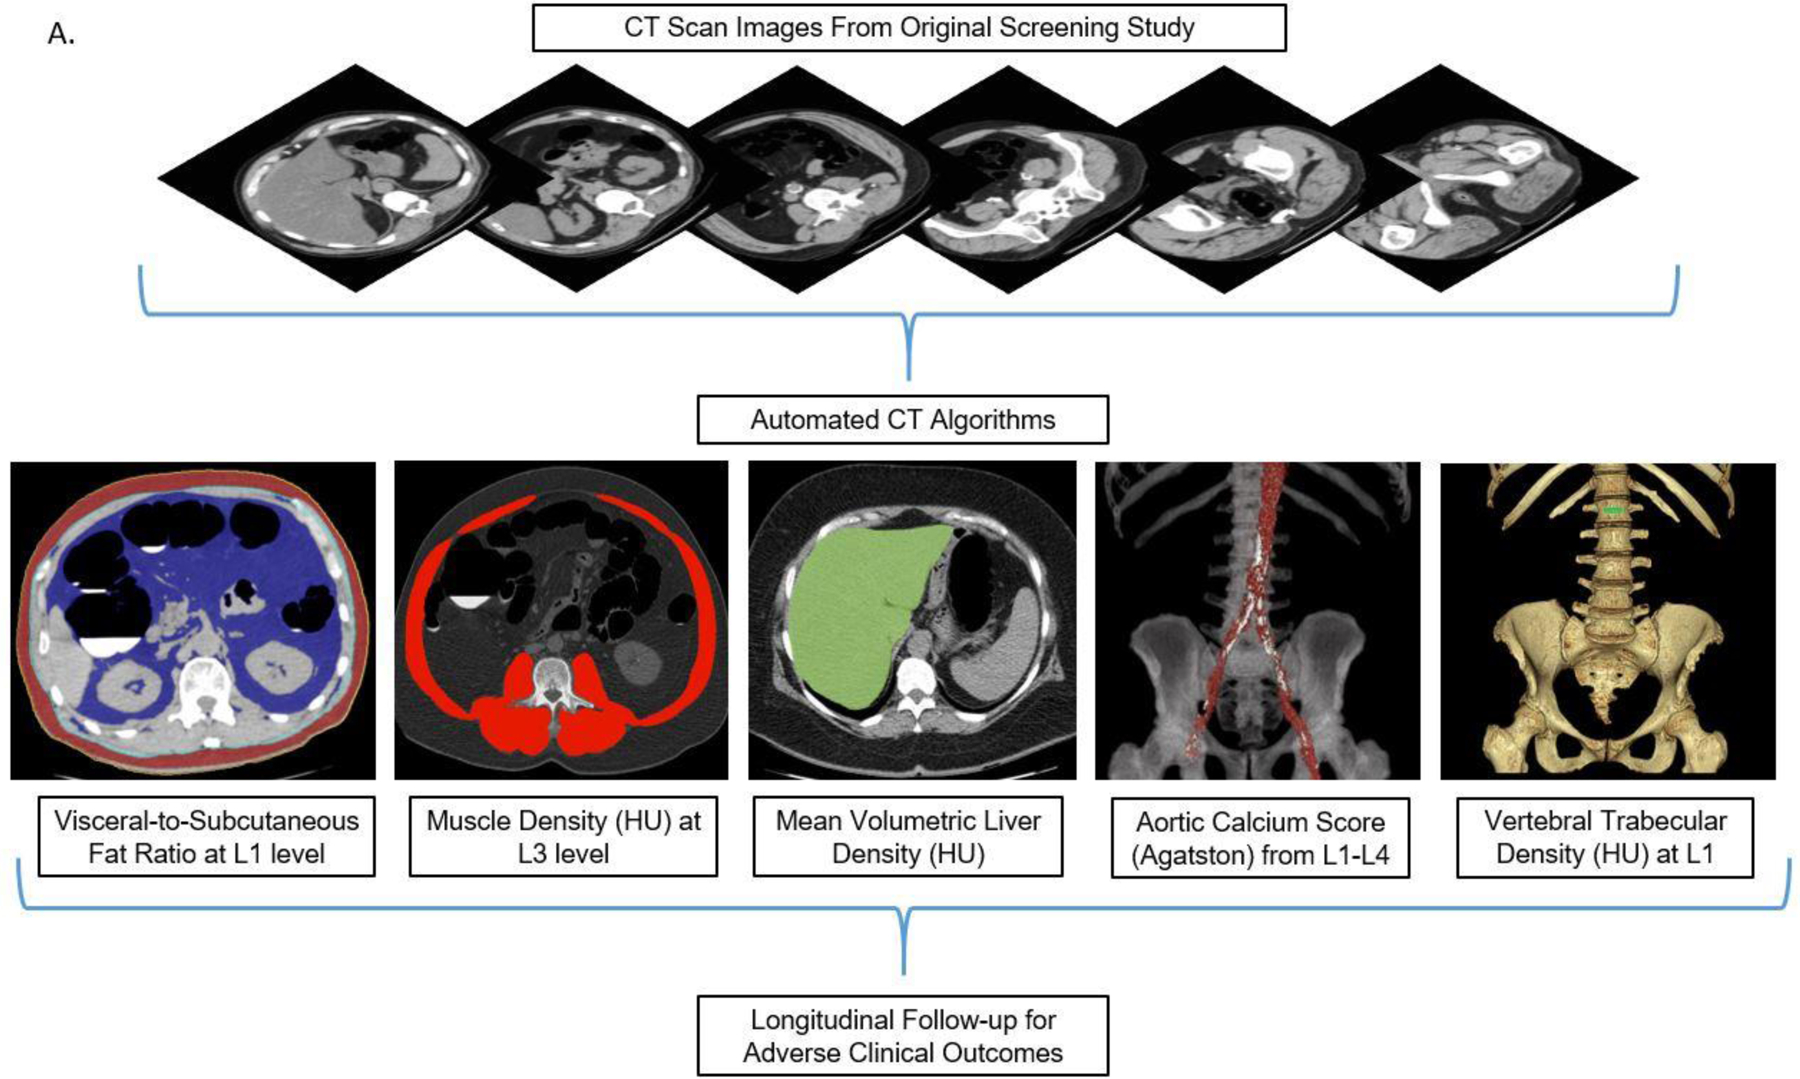
Background: Body CT scans are frequently performed for a wide variety of clinical indications, but potentially valuable biometric information typically goes unused. We investigated the prognostic ability of automated CT-based body composition biomarkers derived from previously-developed deep-learning and feature-based algorithms for predicting major cardiovascular events and overall survival in an adult screening cohort, compared with clinical parameters.
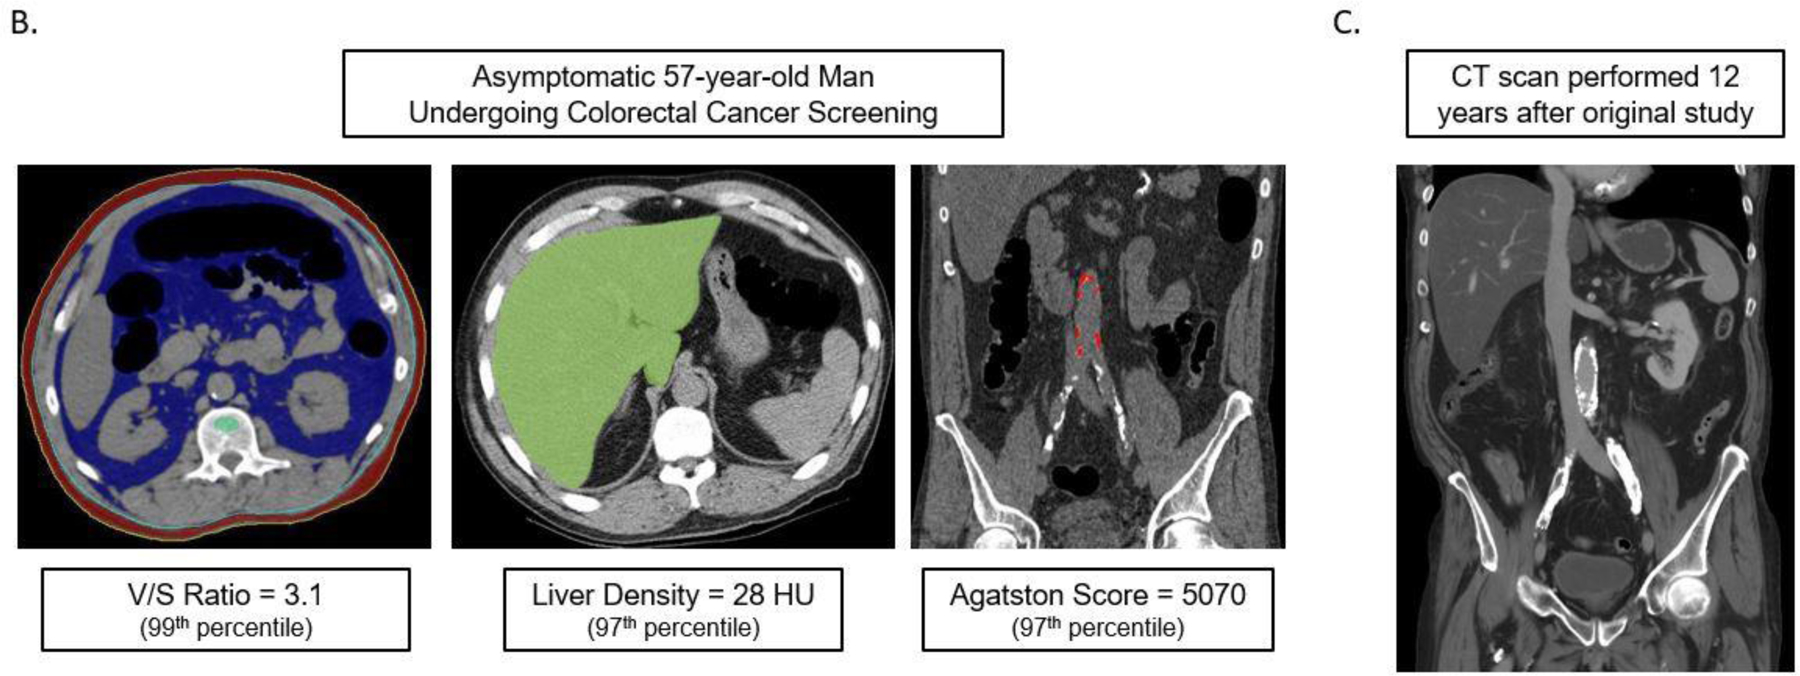
Methods: Mature and fully-automated CT-based algorithms with pre-defined metrics for quantifying aortic calcification, muscle density, visceral/subcutaneous fat, liver fat, and bone mineral density (BMD) were applied to a generally-healthy asymptomatic outpatient cohort of 9223 adults (mean age, 57.1 years; 5152 women) undergoing abdominal CT for routine colorectal cancer screening. Longitudinal clinical follow-up (median, 8.8 years; IQR, 5.1-11.6 years) documented subsequent major cardiovascular events or death in 19.7% (n=1831). Predictive ability of CT-based biomarkers was compared against the Framingham Risk Score (FRS) and body mass index (BMI).
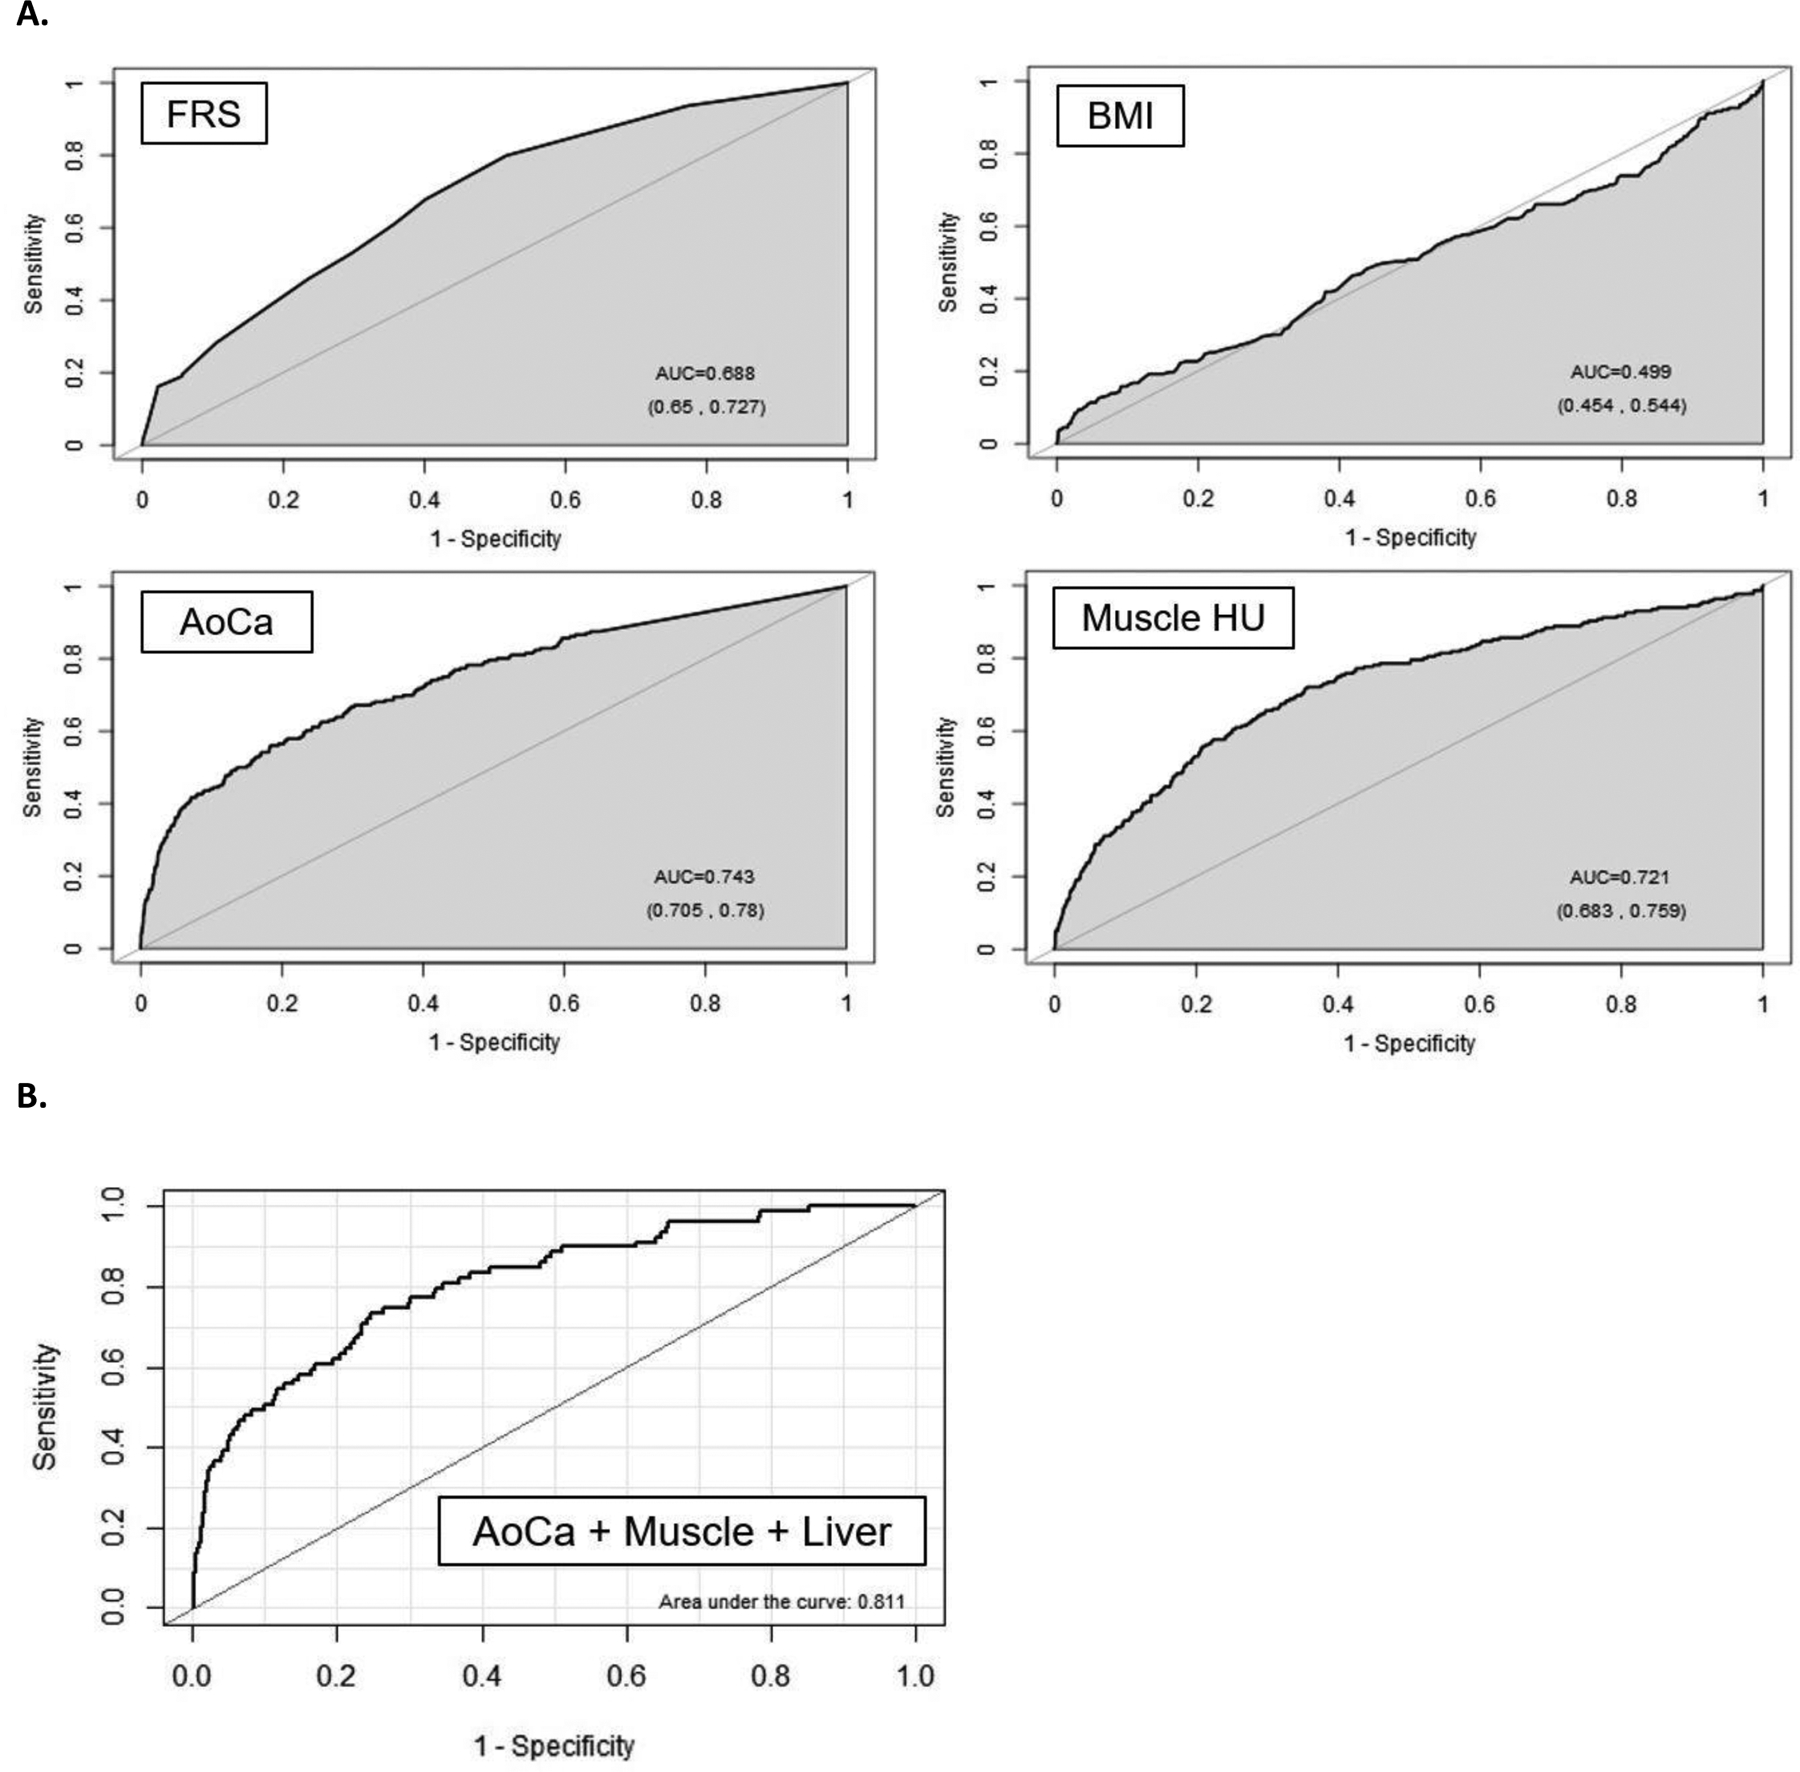
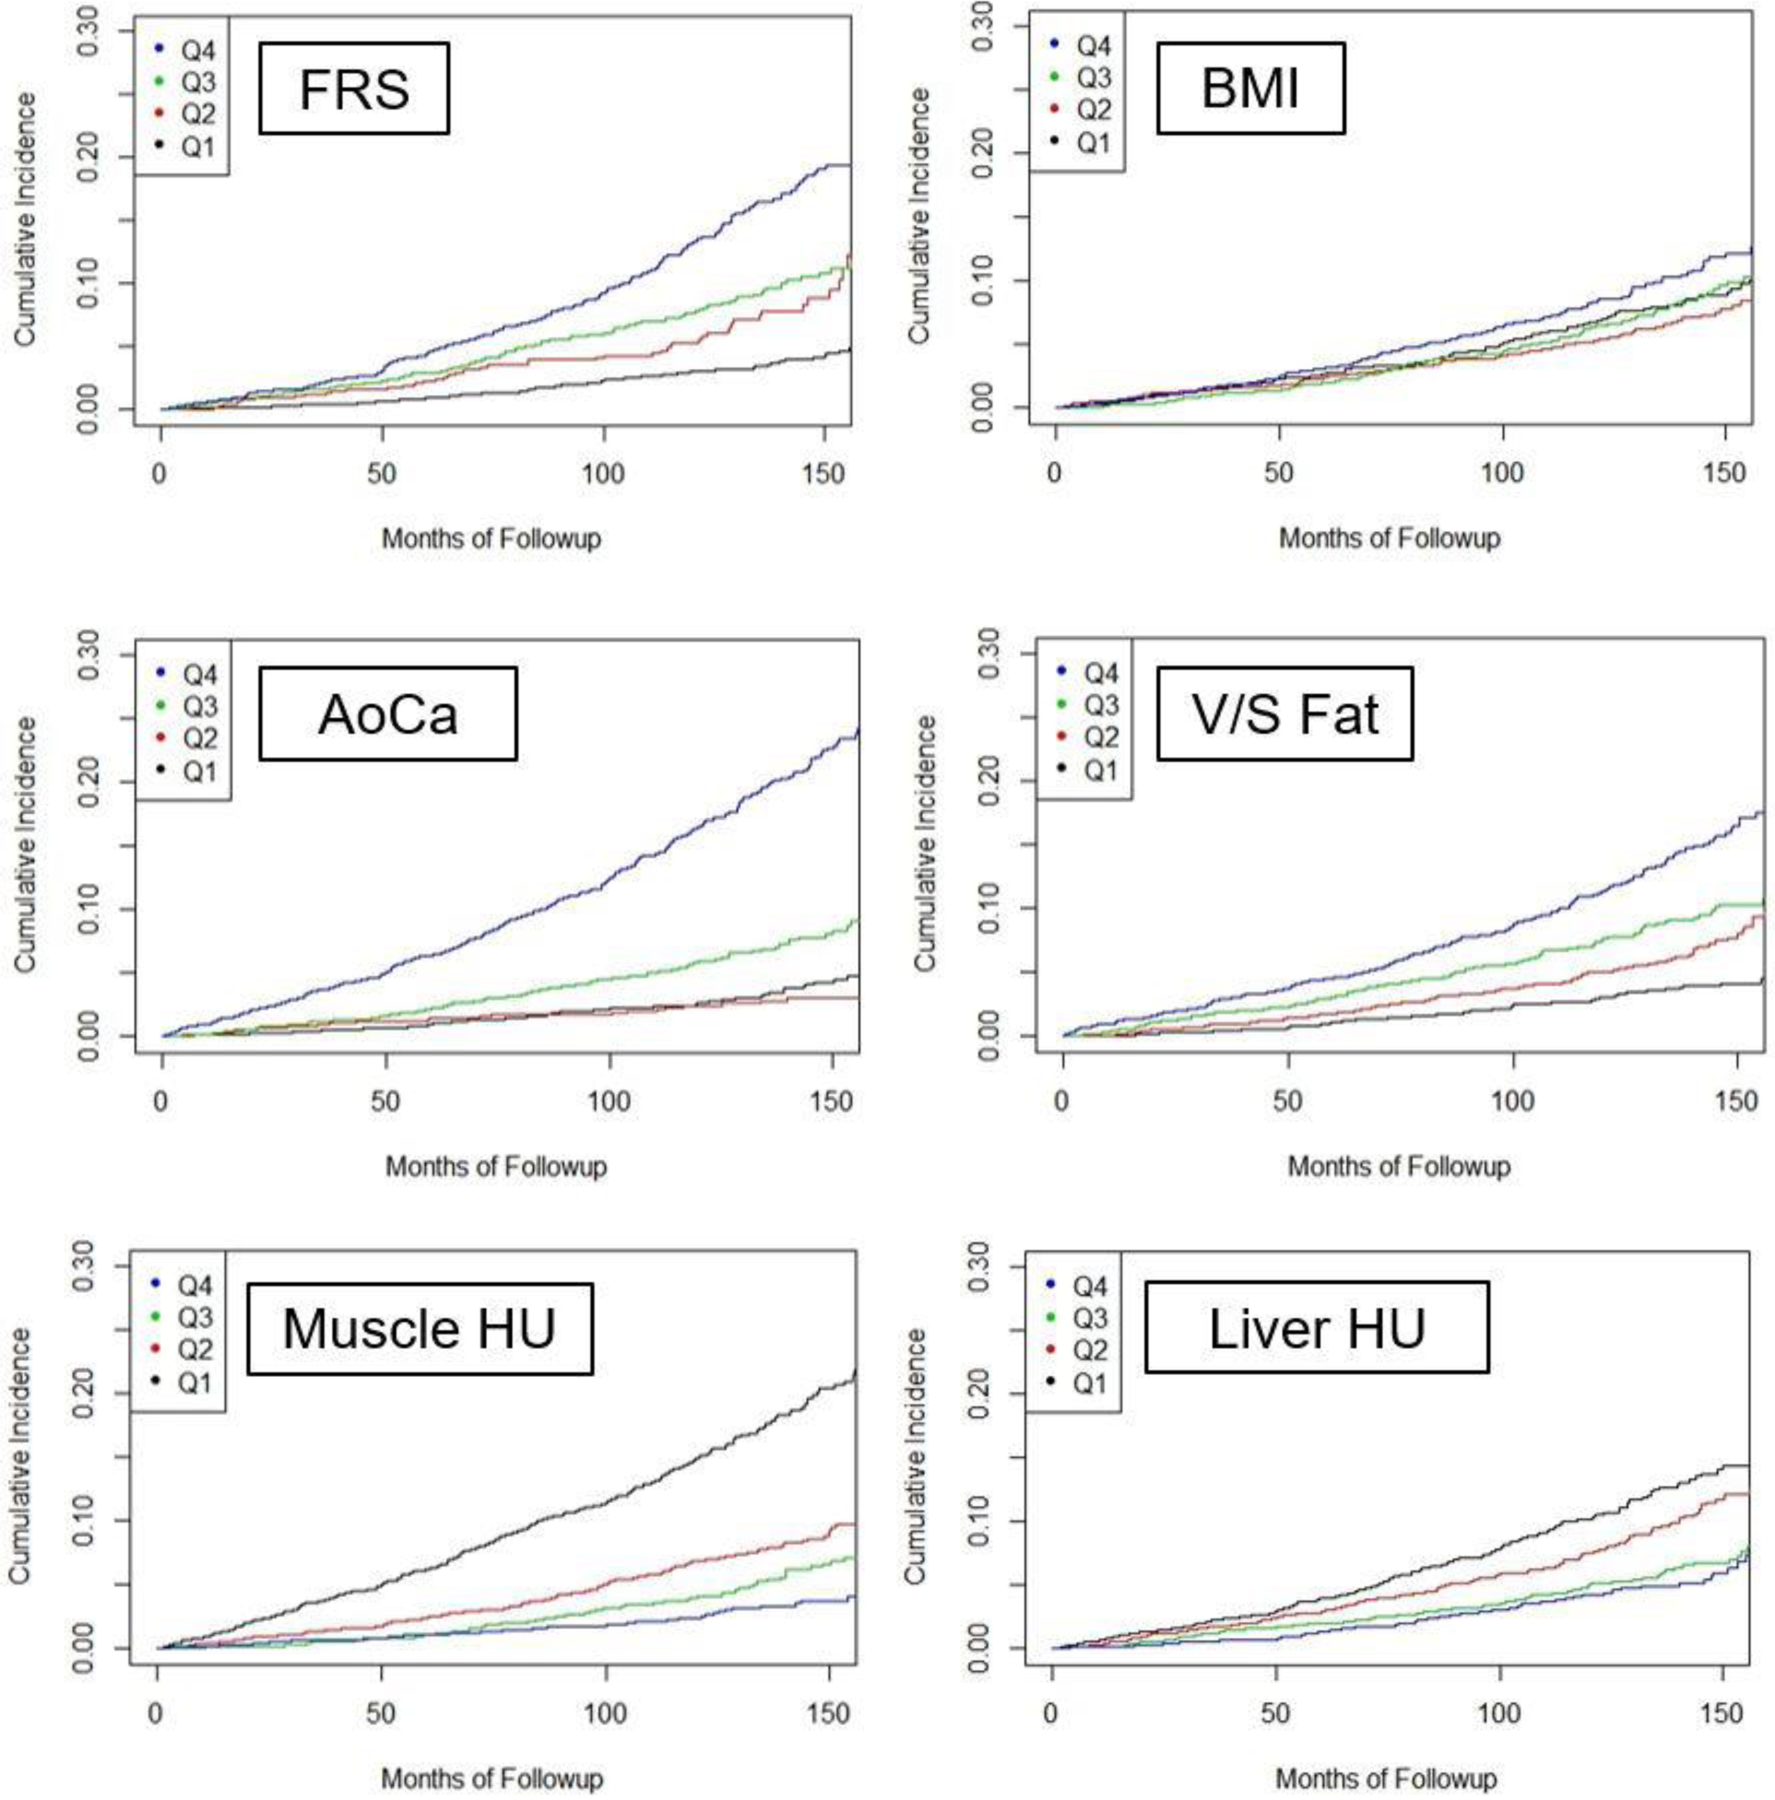
Findings: Significant differences were observed for all five automated CT-based body composition measures according to adverse events (p<0.001). Univariate 5-year AUROC (with 95% CI) for automated CT-based aortic calcification, muscle density, visceral/subcutaneous fat ratio, liver density, and vertebral density for predicting death were 0.743(0.705-0.780)/0.721(0.683-0.759)/0.661(0.625-0.697)/0.619 (0.582-0.656)/0.646(0.603-0.688), respectively, compared with 0.499(0.454-0.544) for BMI and 0.688(0.650-0.727) for FRS (p<0.05 for aortic calcification vs. FRS and BMI); all trends were similar for 2-year and 10-year ROC analyses. Univariate hazard ratios (with 95% CIs) for highest-risk quartile versus others for these same CT measures were 4.53(3.82-5.37) /3.58(3.02-4.23)/2.28(1.92-2.71)/1.82(1.52-2.17)/2.73(2.31-3.23), compared with 1.36(1.13-1.64) and 2.82(2.36-3.37) for BMI and FRS, respectively. Similar significant trends were observed for cardiovascular events. Multivariate combinations of CT biomarkers further improved prediction over clinical parameters (p<0.05 for AUROCs). For example, by combining aortic calcification, muscle density, and liver density, the 2-year AUROC for predicting overall survival was 0.811 (0.761-0.860).
Interpretation: Fully-automated quantitative tissue biomarkers derived from CT scans can outperform established clinical parameters for pre-symptomatic risk stratification for future serious adverse events, and add opportunistic value to CT scans performed for other indications.
Figures
Comment in
-
Artificial intelligence-derived imaging biomarkers to improve population health.Lancet Digit Health. 2020 Apr;2(4):e154-e155. doi: 10.1016/S2589-7500(20)30061-3. Epub 2020 Mar 2. Lancet Digit Health. 2020. PMID: 33328074 No abstract available.
References
Publication types
MeSH terms
Substances
Grants and funding
LinkOut - more resources
Full Text Sources
Other Literature Sources
Medical