. 2020;1(1):tgaa023.
doi: 10.1093/texcom/tgaa023. Epub 2020 Jun 15.

The Impact of 6 and 12 Months in Space on Human Brain Structure and Intracranial Fluid Shifts

Affiliations

The Impact of 6 and 12 Months in Space on Human Brain Structure and Intracranial Fluid Shifts

Kathleen E Hupfeld et al. Cereb Cortex Commun. 2020.

Abstract

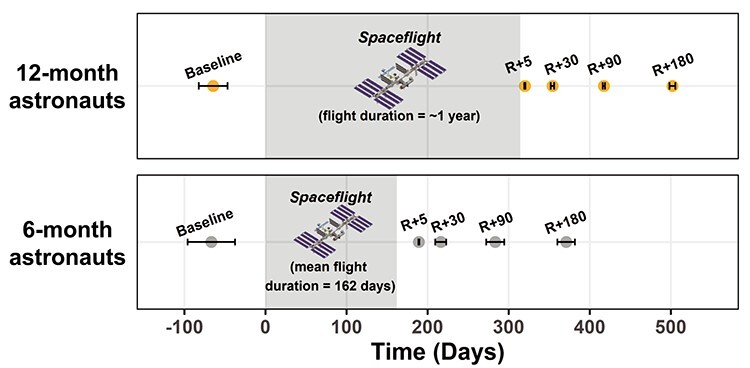
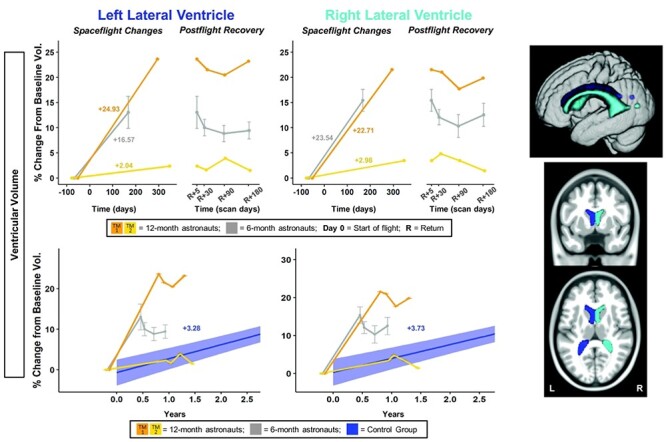
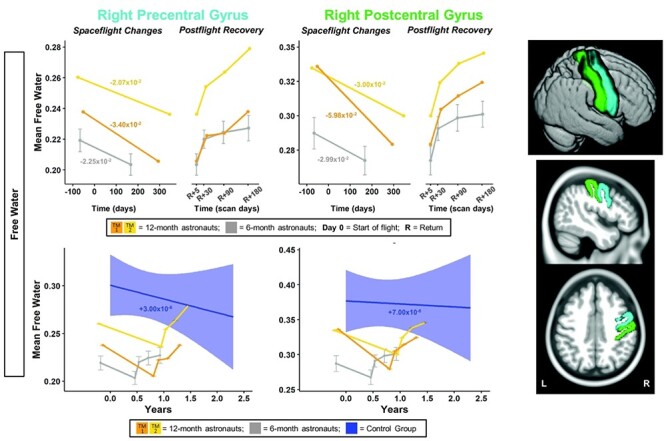
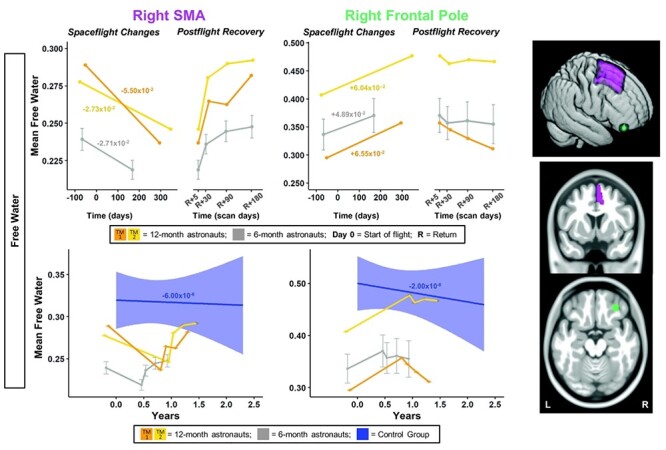
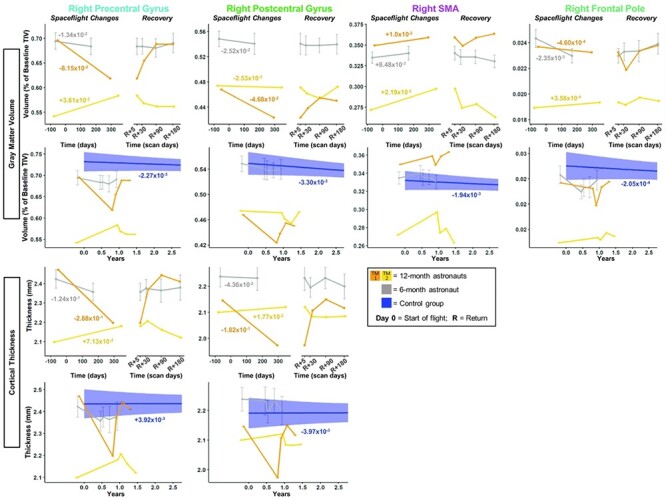
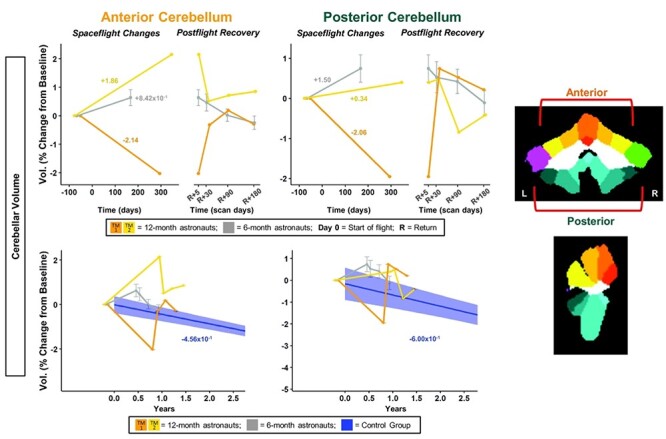
As plans develop for Mars missions, it is important to understand how long-duration spaceflight impacts brain health. Here we report how 12-month (n = 2 astronauts) versus 6-month (n = 10 astronauts) missions impact brain structure and fluid shifts. We collected MRI scans once before flight and four times after flight. Astronauts served as their own controls; we evaluated pre- to postflight changes and return toward preflight levels across the 4 postflight points. We also provide data to illustrate typical brain changes over 7 years in a reference dataset. Twelve months in space generally resulted in larger changes across multiple brain areas compared with 6-month missions and aging, particularly for fluid shifts. The majority of changes returned to preflight levels by 6 months after flight. Ventricular volume substantially increased for 1 of the 12-month astronauts (left: +25%, right: +23%) and the 6-month astronauts (left: 17 ± 12%, right: 24 ± 6%) and exhibited little recovery at 6 months. Several changes correlated with past flight experience; those with less time between subsequent missions had larger preflight ventricles and smaller ventricular volume increases with flight. This suggests that spaceflight-induced ventricular changes may endure for long periods after flight. These results provide insight into brain changes that occur with long-duration spaceflight and demonstrate the need for closer study of fluid shifts.

Keywords: cortical thickness; free water; gray matter volume; spaceflight; ventricular volume.


Figures

Figure 1
Figure 1
Astronaut Testing Timeline. MRI scan day is shown in relation to flight start and end. Average scanning day ± standard deviation is presented. Day = 0 is the start of flight. R = Return. To protect their privacy, individual data are not presented here for the 12-month astronauts.
Figure 2
Figure 2
Ventricular volume changes with spaceflight and comparison with aging. Twelve-month astronaut data are shown in orange (TM-1) and yellow (TM-2). Six-month astronaut data are shown in gray. Volume changes are expressed as a percent change from baseline scan. Top: Numeric values on the left “Spaceflight Changes” panels indicate slope of change in units of volume (% of baseline ventricular volume). For the 6-month group, slopes are the group median slope. Error bars indicate standard error. Structural ROIs are overlaid onto slices and a rendered template brain in standard space. Bottom: The average brain change over time for the control participants is indicated by the blue line with blue 95% confidence interval. The control group median slope is indicated in blue text. Error bars indicate standard error. The dMRI control scans were collected over an average of 1.4 ± 0.6 years and thus entire trajectory of change for the dMRI control data is depicted in the figure. ROI Image: Structural ROIs are overlaid onto slices and a rendered template brain in standard space.
Figure 3
Figure 3
Pre-/postcentral gyri FW changes with spaceflight and aging. Twelve-month astronaut data are shown in orange (TM-1) and yellow (TM-2). Six-month astronaut data are shown in gray. Control data are shown in blue. FW is expressed as mean FW fraction change per year. Top: Numeric values in the left “Spaceflight Changes” panels indicate slope of change in units of mean FW fraction per year. For the 6-month group, these slopes are the group median slope. Error bars indicate standard error. Bottom: The average FW change over time for the control participants is indicated by the blue line with blue 95% confidence interval. The control group median slope is indicated in blue text. Error bars indicate standard error. The dMRI control scans were collected over an average of 1.4 ± 0.6 years and thus entire trajectory of change for the dMRI control data is depicted in the figure. ROI Image: Structural ROIs are overlaid onto slices and a rendered template brain in standard space.
Figure 4
Figure 4
SMA and frontal pole FW changes with spaceflight and aging. Twelve-month astronaut data are shown in orange (TM-1) and yellow (TM-2). Six-month astronaut data are shown in gray. Control data are shown in blue. FW is expressed as mean FW fraction change per year. Top: Numeric values in the left “Spaceflight Changes” panels indicate slope of change in units of mean FW fraction per year. For the 6-month group, these slopes are the group median slope. Error bars indicate standard error. Bottom: The average FW change over time for the control participants is indicated by the blue line with blue 95% confidence interval. The control group median slope is indicated in blue text. Error bars indicate standard error. While the T1 control scans were collected over an average of 7.2 ± 1.5 years, the x-axis here only continues out to 2.75 years in order to provide better visual comparison with the astronaut data. ROI Image: Structural ROIs are overlaid onto slices and a rendered template brain in standard space.
Figure 5
Figure 5
Pre-/postcentral gyri, SMA, and frontal pole GMv and CT changes with spaceflight and aging. Twelve-month astronaut data are shown in orange (TM-1) and yellow (TM-2). Six-month astronaut data are shown in gray. Control data are shown in blue. GMv changes are expressed as a percentage of preflight total intracranial volume (TIV) at baseline scan. CT is expressed as thickness (mm) change per year. Spaceflight Graphs: Numeric values in the left “Spaceflight Changes” panels indicate slope of change in units of volume (% of baseline TIV) or thickness (mm) per year. For the 6-month group, these slopes are the group median slope. Error bars indicate standard error. Control Group Graphs: The average FW change over time for the control participants is indicated by the blue line with blue 95% confidence interval. The control group median slope is indicated in blue text. Error bars indicate standard error. While the T1 control scans were collected over an average of 7.2 ± 1.5 years, the x-axis here only continues out to 2.75 years in order to provide better visual comparison with the astronaut data.
Figure 6
Figure 6
Cerebellar volume changes with spaceflight and aging. Twelve-month astronaut data are shown in orange (TM-1) and yellow (TM-2). Six-month astronaut data are shown in gray. Volume changes are expressed as a percent change from baseline scan. Top: Numeric values on the left “Spaceflight Changes” panels indicate slope of change in units of % of baseline volume per year. For the 6-month group, these slopes are the group median slope. Error bars indicate standard error. Bottom: The average brain change over time for the control participants is indicated by the blue line with blue 95% confidence interval. The control group median slope is indicated in blue text. Error bars indicate standard error. While the T1 control scans were collected over an average of 7.2 ± 1.5 years, the x-axis here only continues out to 2.75 years in order to provide better visual comparison with the astronaut data. ROI Image: ROIs are indicated on template in CERES space. Warm-colored regions indicate those included in anterior cerebellum ROI. Cool-colored regions indicate those included in posterior cerebellum ROI.

References

    1. Apostolova L, Alves G, Hwang KS, Babakchanian S, Bronnick KS, Larsen JP, Thompson PM, Chou Y-Y, Tysnes OB, Vefring HK. 2012. Hippocampal and ventricular changes in Parkinson's disease mild cognitive impairment. Neurobiol Aging. 33:2113–2124. - PMC - PubMed
    1. Asemani D, Inglesby D, Brown T, Collins HR, Eckert MA, Roberts DR. 2019. Spaceflight accelerates longitudinal changes in ventricular volume. Available at SSRN. 3384908. - PMC - PubMed
    1. Ashburner J, Barnes G, Chen C, Daunizeau J, Flandin G, Friston K, Kiebel S, Kilner J, Litvak V, Moran R. 2014. SPM12 Manual. Wellcome Trust Centre for Neuroimaging. London, UK.
    1. Avants BB, Tustison NJ, Song G, Cook PA, Klein A, Gee JC. 2011. A reproducible evaluation of ANTs similarity metric performance in brain image registration. Neuroimage. 54:2033–2044. - PMC - PubMed
    1. Avants BB, Yushkevich P, Pluta J, Minkoff D, Korczykowski M, Detre J, Gee JC. 2010. The optimal template effect in hippocampus studies of diseased populations. Neuroimage. 49:2457–2466. - PMC - PubMed

LinkOut - more resources