. 2020 Aug;1(3):206-214.
doi: 10.1016/j.hroo.2020.05.006.

Inhibition of voltage-gated Na+ currents by eleclazine in rat atrial and ventricular myocytes

Affiliations

Inhibition of voltage-gated Na+ currents by eleclazine in rat atrial and ventricular myocytes

Rachel E Caves et al. Heart Rhythm O2. 2020 Aug.

Abstract

Background: Atrial-ventricular differences in voltage-gated Na+ currents might be exploited for atrial-selective antiarrhythmic drug action for the suppression of atrial fibrillation without risk of ventricular tachyarrhythmia. Eleclazine (GS-6615) is a putative antiarrhythmic drug with properties similar to the prototypical atrial-selective Na+ channel blocker ranolazine that has been shown to be safe and well tolerated in patients.

Objective: The present study investigated atrial-ventricular differences in the biophysical properties and inhibition by eleclazine of voltage-gated Na+ currents.

Methods: The fast and late components of whole-cell voltage-gated Na+ currents (respectively, I Na and I NaL) were recorded at room temperature (∼22°C) from rat isolated atrial and ventricular myocytes.

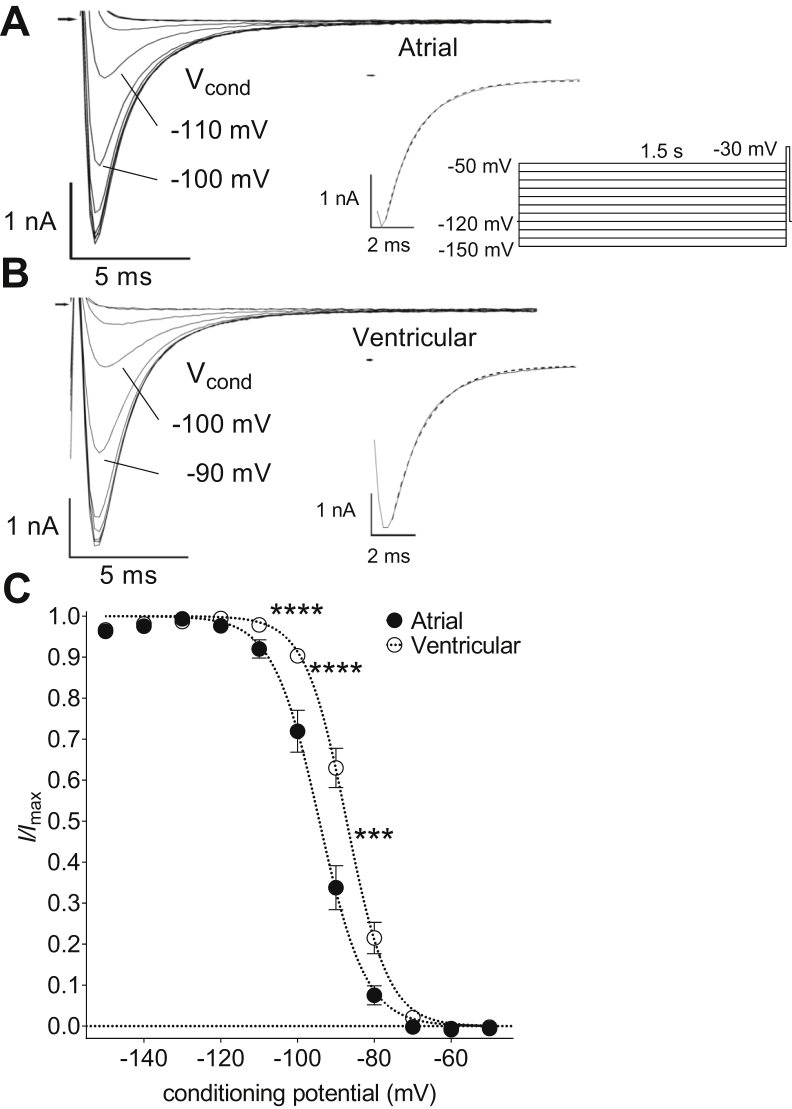
Results: Atrial I Na activated at command potentials ∼5.5 mV more negative and inactivated at conditioning potentials ∼7 mV more negative than ventricular I Na. There was no difference between atrial and ventricular myocytes in the eleclazine inhibition of I NaL activated by 3 nM ATX-II (IC50s ∼200 nM). Eleclazine (10 μM) inhibited I Na in atrial and ventricular myocytes in a use-dependent manner consistent with preferential activated state block. Eleclazine produced voltage-dependent instantaneous inhibition in atrial and ventricular myocytes; it caused a negative shift in voltage of half-maximal inactivation and slowed the recovery of I Na from inactivation in both cell types.

Conclusions: Differences exist between rat atrial and ventricular myocytes in the biophysical properties of I Na. The more negative voltage dependence of I Na activation/inactivation in atrial myocytes underlies differences between the 2 cell types in the voltage dependence of instantaneous inhibition by eleclazine. Eleclazine warrants further investigation as an atrial-selective antiarrhythmic drug.

Keywords: Antiarrhythmic drug; Atrial myocytes; Cardiac regional heterogeneity; INa; INa,Late; Na+ channel blocker; Ventricular myocytes.


Figures

Figure 1
Figure 1
Atrial-ventricular differences in fast Na+ current (INa) density–voltage relations. A, B: Representative current traces recorded from an atrial (A) and a ventricular myocyte (B) on depolarization to a range of voltages. Arrows indicate zero current level. Insert shows voltage pulse protocol. Residual uncompensated capacitative transients have been blanked for clarity. C: Mean INa density–voltage relations for atrial (filled circles, n = 10) and ventricular (open circles, n = 10) myocytes. Solid lines represent fits to Supplemental Equation 1. Data were significantly different by both cell type (P < .05) and voltage (P < .0001) with significant interaction (P < .0001; 2-way repeated measures analysis of variance). ∗∗P < .01; ∗∗∗∗P < .0001 vs ventricular; Bonferroni post hoc test. D: Voltage dependence of time-to-peak (TTP) INa for atrial (filled circles, n = 10) and ventricular (open circles, n = 10) myocytes. The membrane time constants were 0.161 ± 0.021 ms for atrial myocytes (n = 10) and 0.314 ± 0.025 ms for ventricular cells (n = 10; P = .00016, unpaired Student t test).
Figure 2
Figure 2
Atrial-ventricular differences in steady-state voltage-dependent inactivation of fast Na+ current (INa). A, B: Representative current traces recorded from an atrial (A) and a ventricular myocyte (B) on depolarization to -30 mV following conditioning at a range of voltages. Conditioning potential (Vcond) for 2 of the traces indicated. Arrows indicate zero current level. Inserts show voltage pulse protocol and current trace elicited from a Vcond of -130 mV on an expanded time scale. Dashed lines represent fits to Supplemental Equation 2. Supplemental Equation 2 showed a better goodness-of-fit than Supplemental Equation 3 according to the Akaike Information Criterion. Residual uncompensated capacitative transients have been blanked for clarity. C: Mean INa steady-state voltage-dependent inactivation curves for atrial (filled circles, n = 11) and ventricular (open circles, n = 12) myocytes. INa were normalized to the maximum inward current amplitude. Dashed lines represent fits to Supplemental Equation 4. Data were significantly different by both cell type (P < .001) and voltage (P < .0001) with significant interaction (P < .0001; 2-way repeated measures analysis of variance). ∗∗∗P < .001; ∗∗∗∗P < .0001 vs ventricular; Bonferroni post hoc test.
Figure 3
Figure 3
Eleclazine inhibition of the late Na+ current (INaL) in atrial and ventricular myocytes. A, B: Representative current traces recorded from an atrial (A) and a ventricular myocyte (B) on depolarization to -20 mV in control (control), 10 μM tetrodotoxin (TTX), 3 nM sea anemone toxin (ATX-II), and eleclazine (ELE, 300 nM). C: Concentration dependence of INaL inhibition by ELE. Currents measured at 400 ms were normalized to the corresponding activated current in the presence of ATX-II alone and plotted against the corresponding concentration of ELE. Each data point represents the mean (± standard error of the mean) of data from 5 cells and each cell was exposed to a single concentration of ELE. Curves represent fits to Supplemental Equation 5.
Figure 4
Figure 4
Use-dependent inhibition of fast Na+ current (INa) by eleclazine (ELE, 10 μM). A, B: Mean normalized current amplitudes recorded by a series of 40 pulses to -30 mV at diastolic intervals (DI) of 110 (circles) and 40 ms (triangles) in atrial (A, filled symbols, n = 12) and ventricular myocytes (B, open symbols) from a holding potential of -120 mV in the presence of ELE. Currents were normalized to the currents elicited in the absence of ELE by the corresponding pulse number according to Supplemental Equation 6. Solid lines in A and B represent fits to Supplemental Equation 7. C: The mean percentage use-dependent inhibition (Supplemental Equation 8) at DI of 110 and 40 ms from atrial (filled columns) and ventricular (open columns) myocytes (data and sample sizes correspond to A and B). Use-dependent inhibition was significantly different by DI (P < .0001) but not by cell type (P = .7591). ∗∗∗∗P < .0001; Bonferroni post hoc test vs DI 110 ms in the same cell type. D: The effect of holding potential (HP) on mean percentage instantaneous inhibition (Supplemental Equation 9) by ELE. Data show mean inhibition on the first pulse to -30.mV at a DI of 110 ms in atrial (filled columns: HP = -120 mV, n = 12 and HP = -100 mV, n = 8) and ventricular (open columns, HP = -120 mV, n = 9 and HP = -100 mV, n = 9) myocytes. ∗∗∗∗P < .0001, 2-way analysis of variance. ##P < .01; Student unpaired t test.
Figure 5
Figure 5
Effect of pulse duration on the use-dependent inhibition by eleclazine (ELE). Mean normalized current amplitudes recorded by a series of 40 pulses to -30 mV at diastolic intervals of 110 ms in A: atrial myocytes (filled circles, n = 5) and B: ventricular myocytes (open circles, n = 5) from a holding potential of -120 mV in the presence of 10 μM ELE. Gray-filled circles data from Figure 4 with pulse durations of 20 ms are shown for comparison (atrial n = 12; ventricular n = 9). Currents were normalized to the currents elicited in the absence of ELE by the corresponding pulse number.
Figure 6
Figure 6
Effect of eleclazine (ELE) on half-maximal voltage of steady-state inactivation. Data shown are the mean changes in half-maximal voltage of inactivation (Vhalf,inact) caused by 10 μM ELE for atrial (filled column, n = 9) and ventricular (open column, n = 9) myocytes. Hatched columns show corresponding time-matched controls in the absence of ELE for 8 atrial and 9 ventricular myocytes. ∗∗P < .01; ∗∗∗P < .001; 2-way analysis of variance with Bonferroni post hoc test.
Figure 7
Figure 7
Effect of eleclazine (ELE) on fast Na+ current (INa) recovery from inactivation. A: Recovery of INa from inactivation in atrial (filled symbols, n = 7) and ventricular (open symbols, n = 7) myocytes. Dashed lines represent fits to Supplemental Equation 11. The holding potential during recovery was -120 mV. B: Fitted fast (left-hand panel) and slow (right-hand panel) time constants in control and in the presence of 10 μM ELE for atrial (filled columns) and ventricular (open columns) myocytes. ∗P < .05; ∗∗∗P < .001; ∗∗∗∗, P < .0001; 2-way repeated measures analysis of variance (ANOVA) with Bonferroni post hoc test vs control. C: Mean amplitude of fast component in control and in the presence of 10 μM ELE for atrial (filled columns) and ventricular (open columns) myocytes. ∗∗∗∗P < .0001; 2-way repeated measures ANOVA with Bonferroni post hoc test vs control.
Figure 8
Figure 8
The time course of recovery from eleclazine binding. Data were calculated from the data shown in Figure 7A using Supplemental Equation 12. Filled circles, atrial myocytes (n = 7); open circles, ventricular myocytes (n = 7). Solid lines represent fits to Supplemental Equation 11. Fits were constrained to go to 0 at time = 0.0001 second. Fitted parameters are shown in Supplemental Table 6.

References

    1. Camm A.J., Kirchhof P., Lip G.Y.H. Guidelines for the management of atrial fibrillation: The Task Force for the Management of Atrial Fibrillation of the European Society of Cardiology (ESC) Eur Heart J. 2010;31:2369–2429. - PubMed
    1. Naccarelli G.V., Varker H., Lin J., Schulman K.L. Increasing prevalence of atrial fibrillation and flutter in the United States. Am J Cardiol. 2009;104:1534–1539. - PubMed
    1. Carmeliet E., Vereecke J. 1st ed. Kluwer Academic Publishers; New York: 2002. Cardiac Cellular Electrophysiology.
    1. Lafuente-Lafuente C., Valembois L., Bergmann J.-F., Belmin J. Antiarrhythmics for maintaining sinus rhythm after cardioversion of atrial fibrillation. Cochrane Database Sys Rev. 2015;3:CD005049. - PubMed
    1. Alboni P., Botto G.L., Baldi N. Outpatient treatment of recent-onset atrial fibrillation with the “pill-in-the-pocket” approach. N Engl J Med. 2004;351:2384–2391. - PubMed