. 2020 Nov;29(11):2189-2200.
doi: 10.1002/pro.3939. Epub 2020 Sep 28.

Metabolites modulate the functional state of human uridine phosphorylase I

Affiliations

Metabolites modulate the functional state of human uridine phosphorylase I

Yu-Ting Huang et al. Protein Sci. 2020 Nov.

Abstract

Metabolic pathways in cancer cells typically become reprogrammed to support unconstrained proliferation. These abnormal metabolic states are often accompanied by accumulation of high concentrations of ATP in the cytosol, a phenomenon known as the Warburg Effect. However, how high concentrations of ATP relate to the functional state of proteins is poorly understood. Here, we comprehensively studied the influence of ATP levels on the functional state of the human enzyme, uridine phosphorylase I (hUP1), which is responsible for activating the chemotherapeutic pro-drug, 5-fluorouracil. We found that elevated levels of ATP decrease the stability of hUP1, leading to the loss of its proper folding and function. We further showed that the concentration of hUP1 exerts a critical influence on this ATP-induced destabilizing effect. In addition, we found that ATP interacts with hUP1 through a partially unfolded state and accelerates the rate of hUP1 unfolding. Interestingly, some structurally similar metabolites showed similar destabilization effects on hUP1. Our findings suggest that metabolites can alter the folding and function of a human protein, hUP1, through protein destabilization. This phenomenon may be relevant in studying the functions of proteins that exist in the specific metabolic environment of a cancer cell.

Keywords: ATP; ligand-binding; protein functional state; protein stability; uridine phosphorylase I.


Figures

FIGURE 1
FIGURE 1
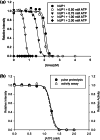
Effects of ATP on the functional state of hUP1. (a) Unfolding equilibrium of hUP1 in urea was monitored in the presence of 0 (●), 0.5 (○), 0.75 (▼), 1.00 (▽), and 2.00 (◆) mM ATP using pulse proteolysis. Relative intensity is the ratio of hUP1 band intensity remaining after pulse proteolysis to hUP1 band intensity without proteolysis. Apparent C m values were determined by fitting relative intensities to a two‐state model. (b) The influence of ATP on the functional state of hUP1 was monitored by simultaneous pulse proteolysis (●) and activity assays (∆) in the absence of urea. hUP1 was incubated overnight at room temperature with different concentrations of ATP. Samples were then aliquoted into two sets for pulse proteolysis and activity assay. The enzymatic activity of hUP1 was quantified by measuring the amount of product, uracil, at an absorbance of 290 nm
FIGURE 2
FIGURE 2
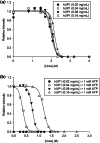
Effects of hUP1 concentration on protein stability. The stability of hUP1 was determined by pulse proteolysis in the absence (a) or presence (b) of 1.0 mM ATP. (a) Unfolding equilibrium analyses were conducted by pulse proteolysis using 0.02 (●), 0.04 (○), 0.08 (▼), and 0.16 (∆) mg/ml hUP1. Relative intensity is the ratio of hUP1 band intensity remaining after pulse proteolysis to hUP1 band intensity without proteolysis. Apparent C m values were determined by fitting relative intensities to a simple two‐state model. (b) Pulse proteolysis was used to determine the effect of 1.0 mM ATP on the stability of hUP1 at different concentrations (●, ○, ▼, ∆). At 1 mM ATP, a low concentration of hUP1 (0.02 mg/ml) was completely digested by the protease, even in the absence of urea
FIGURE 3
FIGURE 3
Unfolding kinetics of hUP1. (a) Unfolding of hUP1 (0.08 mg/ml) in 3.0 M urea was monitored by pulse proteolysis in the presence (○) and absence (●) of 1.0 mM ATP. Relative intensity was determined by expressing intensity at a given time point relative to the intensity of hUP1 prior to initiating the reaction (t 0). Unfolding kinetic constants were determined by fitting relative intensities to a first‐order rate equation. (b) The natural logarithms of the observed unfolding rate constants (k) in the presence (○) and absence (●) of 1.0 mM ATP were plotted against the concentration of urea. The unfolding arm of hUP1 in the presence of ATP was fit to a model with two irreversible kinetic steps
FIGURE 4
FIGURE 4
Identifying the partially unfolded conformation of hUP1. The accumulation of a partially unfolded conformation of hUP1 (0.08 mg/ml) was detected by ANS binding. The fluorescence intensity of ANS at 470 nm was measured after incubation with hUP1 in different concentrations of urea in the presence (○) or absence (●) of 1.0 mM ATP
FIGURE 5
FIGURE 5
Effects of various metabolites on the stability of hUP1. (a) hUP1 (0.08 mg/ml) was unfolded for 16 hr in 1.75 M urea in the presence of various metabolites (1.0 mM) or in the absence of a metabolite (None). The amount of remaining folded protein was determined by pulse proteolysis. Undigested protein (control) is shown for comparison. (b) Relative intensity is the ratio of the band intensity of hUP1 remaining after pulse proteolysis to the band intensity of the control. The letters a, b, c indicate statistically significant differences (p < .05). (c) The unfolding equilibrium of hUP1 (0.08 mg/ml) was monitored using pulse proteolysis in the presence (○) and absence (●) of 3 mM uridine. The band intensity of hUP1 was normalized to that of intact hUP1 after pulse proteolysis in the absence of urea
FIGURE 6
FIGURE 6
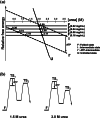
Energetic effects of ATP on the functional state of hUP1. (a) The free‐energy diagram explains the accumulation of an equilibrium intermediate (I) in the presence of ATP. The four base lines, F, refer to the folded state of different concentrations of hUP1. The intersections of F and U are marked according to the C m value of hUP1 alone, and the intersections of F and I′ are marked according to the C m value of hUP1 in the presence of 1.0 mM ATP. (b) Unfolding kinetic models explain the increased k u of hUP1 in the presence of ATP. The reaction energy diagram illustrates the effect of ATP on the free energy of transition state 1 (TS1) for hUP1 unfolding. The free energies of the transition states in 1.5 and 3.0 M urea were determined using unfolding kinetics data from Figure 2b

References

    1. Griffin JL, Shockcor JP. Metabolic profiles of cancer cells. Nat Rev Cancer. 2004;4:551–561. - PubMed
    1. Chiarugi A, Dolle C, Felici R, Ziegler M. The NAD metabolome—A key determinant of cancer cell biology. Nat Rev Cancer. 2012;12:741–752. - PubMed
    1. Ward PS, Thompson CB. Metabolic reprogramming: A cancer hallmark even Warburg did not anticipate. Cancer Cell. 2012;21:297–308. - PMC - PubMed
    1. Sun C, Li T, Song X, et al. Spatially resolved metabolomics to discover tumor‐associated metabolic alterations. Proc Natl Acad Sci U S A. 2019;116:52–57. - PMC - PubMed
    1. Zhao Y, Butler EB, Tan M. Targeting cellular metabolism to improve cancer therapeutics. Cell Death Dis. 2013;4:e532. - PMC - PubMed

Publication types

MeSH terms