. 2020 Sep 15;9(18):e017071.
doi: 10.1161/JAHA.120.017071. Epub 2020 Aug 31.

MerTK Expression and ERK Activation Are Essential for the Functional Maturation of Osteopontin-Producing Reparative Macrophages After Myocardial Infarction

Affiliations

MerTK Expression and ERK Activation Are Essential for the Functional Maturation of Osteopontin-Producing Reparative Macrophages After Myocardial Infarction

Kohsuke Shirakawa et al. J Am Heart Assoc. .

Abstract

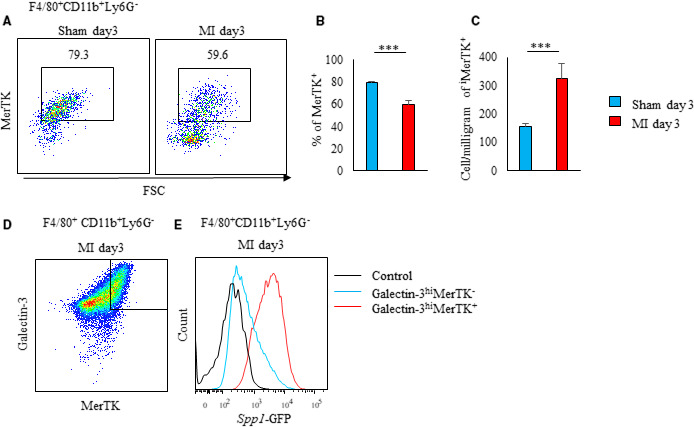
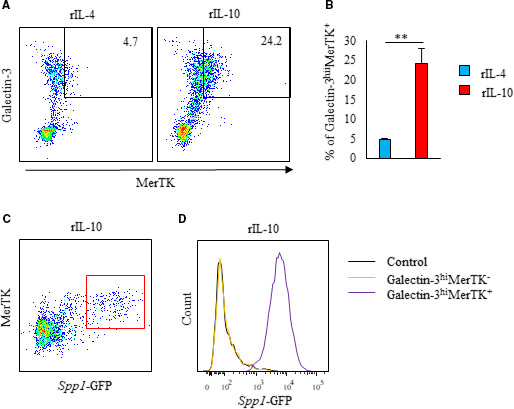
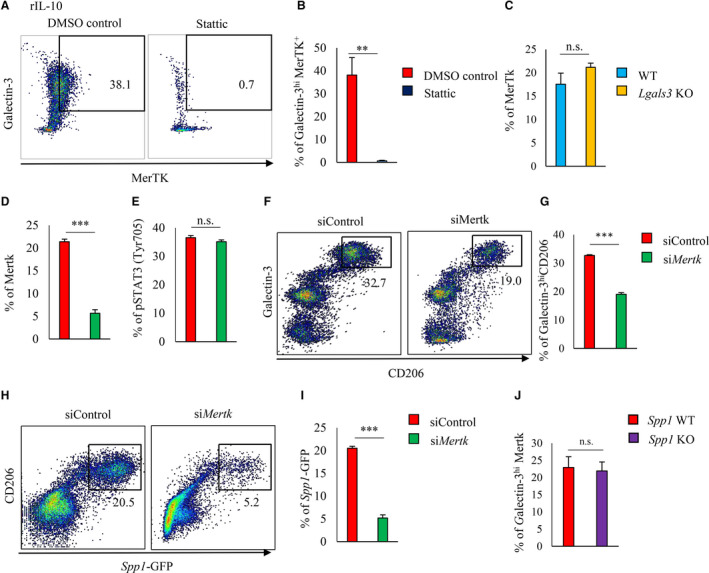
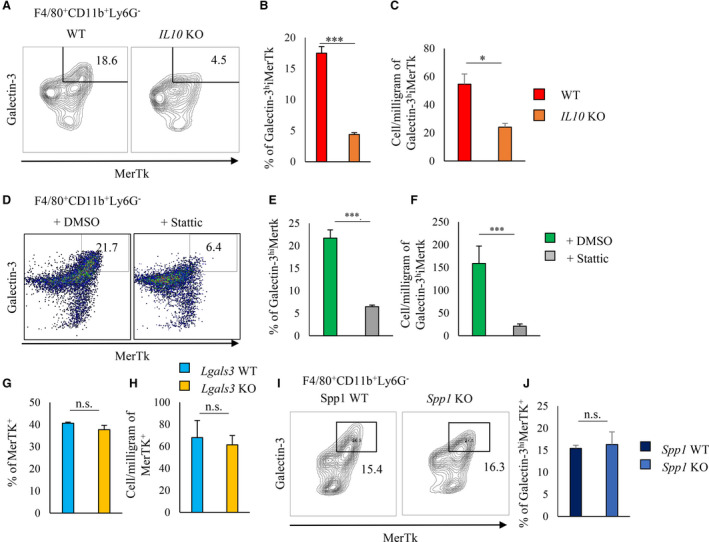
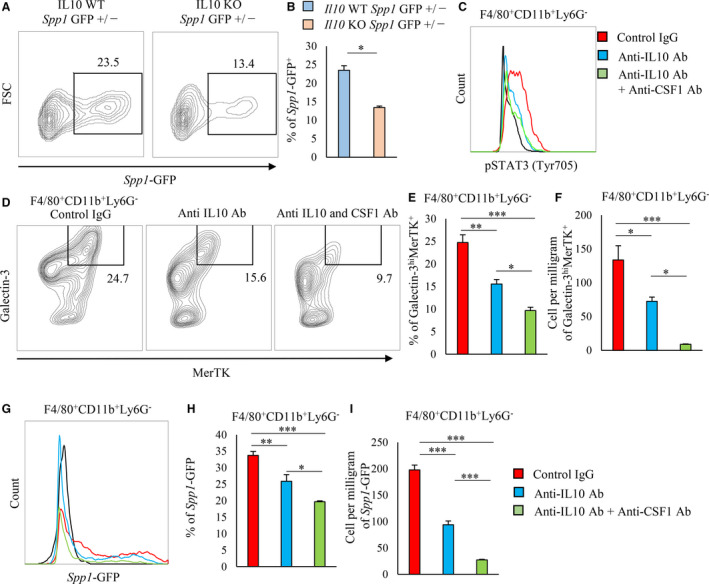
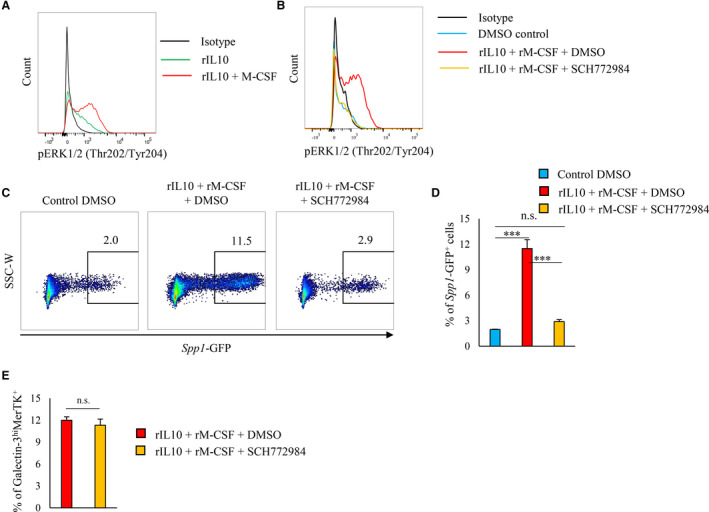
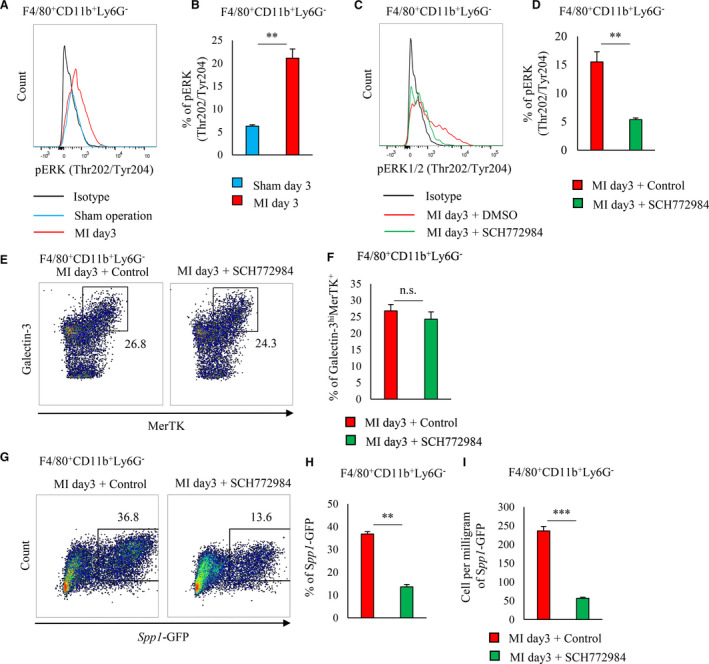
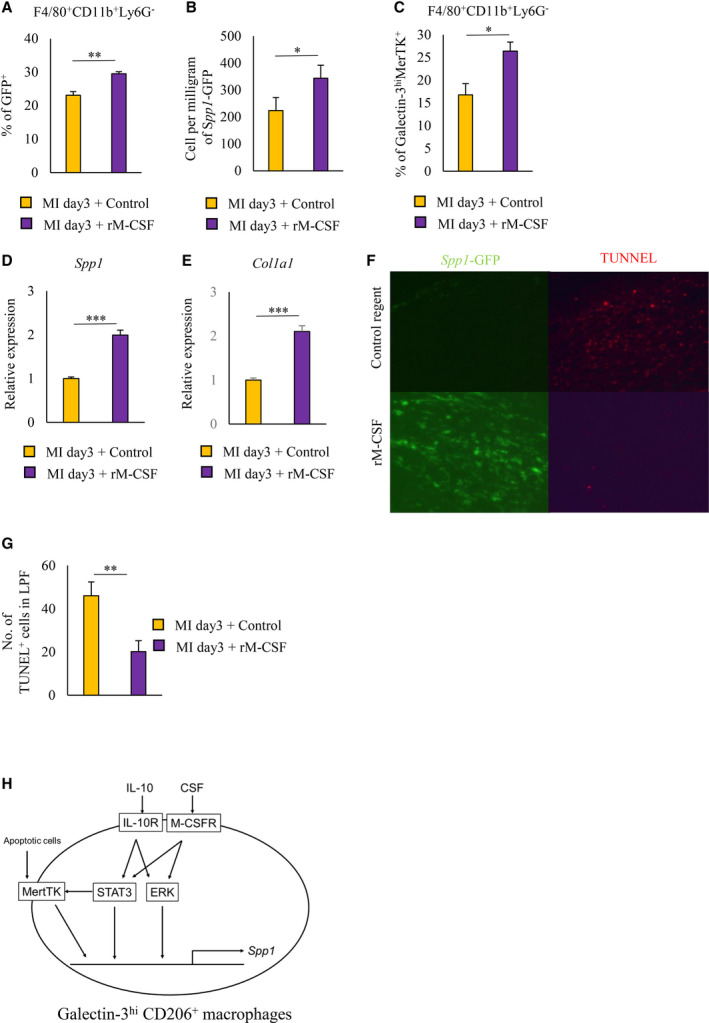
Background We previously reported that osteopontin plays an essential role in accelerating both reparative fibrosis and clearance of dead cells (efferocytosis) during tissue repair after myocardial infarction (MI) and galectin-3hiCD206+ macrophages is the main source of osteopontin in post-MI heart. Interleukin-10- STAT3 (signal transducer and activator of transcription 3)-galectin-3 axis is essential for Spp1 (encoding osteopontin) transcriptional activation in cardiac macrophages after MI. Here, we investigated the more detailed mechanism responsible for functional maturation of osteopontin-producing macrophages. Methods and Results In post-MI hearts, Spp1 transcriptional activation occurred almost exclusively in MerTK (Mer tyrosine kinase)+ galectin-3hi macrophages. The induction of MerTK on galectin-3hi macrophages is essential for their functional maturation including efferocytosis and Spp1 transcriptional activity. MerTK+galectin-3hi macrophages showed a strong activation of both STAT3 and ERK (extracellular signal-regulated kinase). STAT3 inhibition suppressed the differentiation of osteopontin-producing MerTK+galectin-3hi macrophages, however, STAT3 activation was insufficient at inducing Spp1 transcriptional activity. ERK inhibition suppressed Spp1 transcriptional activation without affecting MerTK or galectin-3 expression. Concomitant activation of ERK is required for transcriptional activation of Spp1. In Il-10 knockout enhanced green fluorescent protein-Spp1 knock-in mice subjected to MI, osteopontin-producing macrophages decreased but did not disappear entirely. Interleukin-10 and macrophage colony-stimulating factor synergistically activated STAT3 and ERK and promoted the differentiation of osteopontin-producing MerTK+galectin-3hi macrophages in bone marrow-derived macrophages. Coadministration of anti-interleukin-10 plus anti-macrophage colony-stimulating factor antibodies substantially reduced the number of osteopontin-producing macrophages by more than anti-interleukin-10 antibody alone in post-MI hearts. Conclusions Interleukin-10 and macrophage colony-stimulating factor act synergistically to activate STAT3 and ERK in cardiac macrophages, which in turn upregulate the expression of galectin-3 and MerTK, leading to the functional maturation of osteopontin-producing macrophages.

Keywords: MerTK; galectin‐3; macrophage; macrophage colony‐stimulating factor; myocardial infarction; osteopontin.


Conflict of interest statement

None.

Figures

Figure 1
Figure 1. A unique population of galectin‐3hi MerTK+ macrophages is the primary source of osteopontin in post‐MI hearts.
A through C, Flow cytometric analysis of MerTK expression in F4/80+CD11b+Ly6G cells from sham‐operated and post‐MI hearts on day 3 (n=3 to 5 mice per group). Representative scatter plot of intracellular galectin‐3 and MerTK expression in F4/80+CD11b+Ly6G cells (A). Bar graph shows the percentage of galectin‐3hi MerTK+ cells in F4/80+CD11b+Ly6G cells (B). Bar graph shows the cell number per mg of galectin‐3hiMerTK+F4/80+CD11b+Ly6G cells (C). D and E, Flow cytometric analysis of EGFP‐Spp1 expression in galectin‐3hiMerTK+ and galectin‐3hiMerTK expressing F4/80+CD11b+ Ly6G cells in post‐MI hearts. Representative scatter plot of intracellular galectin‐3 and MerTK expression in F4/80+CD11b+Ly6G cells in post‐MI hearts on day 3 (D). Representative histogram of Spp1‐GFP expressing cells in galectin‐3hiMerTK+ and galectin‐3hiMerTK expressing F4/80+CD11b+ Ly6G cells from post‐MI hearts on day 3 (E). Flow cytometric analysis was performed in at least 3 independent experiments. Data are mean±SEM. ***P<0.001. EGFP indicates enhanced green fluorescent protein; GFP, green fluorescent protein; MerTK, Mer tyrosine kinase; and MI, myocardial infarction.
Figure 2
Figure 2. Bone marrow‐derived CD11b+ Ly6G cells differentiate to osteopontin‐producing cells that express both galectin‐3hi and MerTK after in vitro interleukin‐10 treatment.
A through D, CD11b+Ly6G cells were isolated from the bone marrow of 8‐ to 10‐week‐old EGFP‐Spp1‐knock‐in reporter mice and cultured for 3 days with rIL‐4 or rIL‐10. A and B, Flow cytometric analysis of intracellular galectin‐3 and MerTK was performed (n=5 per group). Representative scatter plot of intracellular galectin‐3 and MerTK expression in rIL‐4 or rIL‐10 treated CD11b+Ly6G cells (A). Bar graph shows galectin‐3hiMerTK+expression in CD11b+Ly6G cells (B). Representative scatter plot of Spp1‐GFP expression in MerTK+CD11b+Ly6G cells treated with rIL‐10 (C). Representative histogram of Spp1‐GFP expression in galectin‐3hiMerTK+ and galectin‐3hiMerTK‐expressing CD11b+Ly6G cells treated with rIL‐10 (D). Flow cytometric analysis was performed in at least 3 independent experiments. Data are mean±SEM. **P<0.01. EGFP indicates enhanced green fluorescent protein; GFP, green fluorescent protein; MerTK, Mer tyrosine kinase; MI, myocardial infarction; and rIL, recombinant interleukin.
Figure 3
Figure 3. STAT3‐MerTK‐Galectin‐3 axis regulates in vitro osteopontin expression.
A and B, CD11b+Ly6G cells were isolated from the bone marrow of 8‐ to 10‐week‐old WT mice and cultured for 3 days in rIL‐10+DMSO or rIL‐10+Stattic. Representative flow cytometry scatter plot of intracellular galectin‐3hiMerTK+ expression in CD11b+Ly6G cells (A). Bar graph shows galectin‐3hi MerTK+ expression in CD11b+Ly6G cells (n=5 per group) (B). C, CD11b+Ly6G cells were isolated from the bone marrow of 8‐ to 10‐week‐old WT or Lgals3 KO mice and cultured in rIL‐10 for 3 days. Bar graph shows MerTK expression in CD11b+Ly6G cells by flow cytometric analysis (n=5 mice per group). D through I, CD11b+Ly6G cells were isolated from the bone marrow of 8‐ to 10‐week‐old EGFP‐Spp1‐knock‐in reporter mice and cultured in rIL‐10 for 3 days with siControl or siMerTK. Bar graphs show the expression of MerTK (D) and pSTAT3 (E) in CD11b+Ly6G cells with either siControl or siMerTK (n=5 mice per group). Representative scatter plot of of intracellular galectin‐3 in CD206+ CD11b+ Ly6G cells (F). Bar graph shows galectin‐3hiCD206+ expression in CD11b+Ly6G cells (n=5 mice per group) (G). Representative scatter plot of Spp1‐GFP in CD206+ CD11b+ Ly6G cells (H). Bar graph shows Spp1‐GFP expression in CD11b+Ly6G cells (n=5 mice per group) (I). CD11b+Ly6G cells were isolated from the bone marrow of 8‐ to 10‐week‐old WT or Spp1 knockout mice and cultured in rIL‐10 for 3 days. Bar graph shows galectin‐3hiMerTK+ expression in CD11b+Ly6G cells (n=3 per group) (J). Flow cytometric analysis was performed in at least 3 independent experiments. Data are mean±SEM. **P<0.01, ***P<0.001; n.s., not significant. EGFP indicates enhanced green fluorescent protein; GFP, green fluorescent protein; MerTK, Mer tyrosine kinase; rIL, recombinant interleukin; STAT3, signal transducer and activator of transcription 3; and WT, wild‐type.
Figure 4
Figure 4. Inhibition of STAT3 tyrosine phosphorylation suppressed MerTK expression in cardiac macrophages after MI.
A through C, Flow cytometric analysis of galectin‐3 and MerTK expression in F4/80+CD11b+Ly6G cells from post‐MI hearts on day 3 from WT and Il‐10 knockout mice. Representative scatterplot of galectin‐3hiMerTK+ expression in F4/80+CD11b+Ly6G cells (A). Bar graphs show the percentage (B) and the cell number per milligram (C) of galectin‐3hiMerTK+ cells in F4/80+CD11b+Ly6G cells (n=5 per group). D through F, DMSO or Stattic (STAT3 inhibitor) was administered to WT mice via intraperitoneal injection from 1 day before MI to days 3 after MI. Representative scatterplot of galectin‐3hiMerTK+ expression in F4/80+CD11b+Ly6G cells (D). Bar graphs show the percentage of galectin‐3hiMerTK+ cells in CD11b+Ly6G cells (E) and the cell number per milligram of galectin‐3hiMerTK+F4/80+CD11b+Ly6G cells (n=8 per group) (F). G and H, Flow cytometric analysis of MerTK in F4/80+CD11b+Ly6G cells from post‐MI hearts of WT and Lgals3 knockout mice. Bar graphs show the percentage (G) and cell number per milligram (H) of MerTK+ cells in F4/80+CD11b+Ly6G cells (n=4 per group). I and J, Flow cytometric analysis of galectin‐3hiMerTK+ expression in F4/80+CD11b+Ly6G cells from post‐MI hearts of WT and Spp1 knockout mice. Representative scatterplot of galectin‐3hiMerTK+ expression in F4/80+CD11b+Ly6G cells. (I) Bar graph shows the percentage of MerTK+ cells in F4/80+CD11b+Ly6G cells (n=3 per group) (J). Flow cytometric analysis was performed in at least 3 independent experiments. Data are mean±SEM. *P<0.05, ***P<0.001; n.s., not significant. EGFP indicates enhanced green fluorescent protein; GFP, green fluorescent protein; MerTK, Mer tyrosine kinase; MI, myocardial infarction; pSTAT3, phosphorylated signal transducer and activator of transcription 3; rIL, recombinant interleukin; and WT, wild‐type.
Figure 5
Figure 5. Interleukin‐10 requires M‐CSF to induce in vivo osteopontin‐producing macrophage differentiation and the upregulation of galectin‐3 and MerTK.
A and B, Flow cytometric analysis of GFP expression in CD11b+ Ly6G cells in post‐MI hearts on day 3 from either Il‐10 WT or Il‐10 KO EGFP‐Spp1‐knock‐in reporter mice and is shown in the representative scatter plots (A). Bar graph shows the percentage of GFP+ expression in CD11b+Ly6G cells (B). C through I, Control IgG, anti–interleukin‐10 antibody, or anti–interleukin‐10+anti–M‐CSF antibodies were administered to EGFP‐Spp1‐knock‐in reporter mice via intraperitoneal injection from 1 day before MI to 3 days MI. Representative histogram of pSTAT3 (Y705) expression in cardiac CD11b+Ly6G cells treated with control IgG, anti–interleukin‐10 antibody, or anti–interleukin‐10+anti–M‐CSF antibodies. C, Flow cytometric analysis of intracellular galectin‐3 and MerTK expression in F4/80+CD11b+Ly6G cells from post‐MI hearts treated with control IgG, anti–interleukin‐10 antibody, or anti–interleukin‐10+anti–M‐CSF antibodies. Representative plot of galectin‐3hiMerTK expression in F4/80+CD11b+Ly6G cells (D). Bar graph shows the percentage of galectin‐3hiMerTK expression in F4/80+CD11b+Ly6G cells (n=4 to 5 mice per group) (E). Bar graph shows the cell number per milligram of galectin‐3hiMerTK+F4/80+CD11b+Ly6G cells (n=4 to 5 mice per group) (F). Representative histogram of Spp1‐GFP expression in F4/80+CD11b+Ly6G cells (G). Bar graph shows the percentage of Spp1‐GFP expression in F4/80+CD11b+Ly6G cells (n=4–5 mice per group) (H). Bar graph shows the cell number per mg of GFP+F4/80+CD11b+Ly6G cells (n=4 to 5 mice per group) (I). Flow cytometric analysis was performed in at least 3 independent experiments. Data are mean±SEM. *P<0.05, **P<0.01, ***P<0.001. EGFP indicates enhanced green fluorescent protein; GFP, green fluorescent protein; M‐CSF, macrophage colony‐stimulating factor; MerTK, Mer tyrosine kinase; MI, myocardial infarction; pSTAT3, phosphorylated signal transducer and activator of transcription 3; and rIL, recombinant interleukin.
Figure 6
Figure 6. ERK1/2 phosphorylation regulates in vitro OPN expression.
A, CD11b+Ly6G cells were isolated from the bone marrow of 8‐ to 10‐week‐old WT mice and cultured for 3 days with either rIL‐10 or rIL‐10+rM‐CSF. Representative histogram of pERK1/2 (Thr202/Tyr204) expression in CD11b+Ly6G cells (A). B through E, CD11b+Ly6G cells were isolated from the bone marrow of 8‐ to 10‐week‐old WT mice and cultured for 3 days treated with rIL‐10+rM‐CSF plus DMSO, rIL‐10+rM‐CSF+SCH772984 (ERK1/2 inhibitor), or DMSO. Representative histogram of pERK1/2 (Thr202/Tyr204) in CD11b+Ly6G cells (B). Representative scatter plot of EGFP‐Spp1 expression (C), and bar graph shows the percentage of EGFP‐Spp1 (D). Bar graph shows the percentage of galectin‐3hiMerTK+ expression in CD11b+Ly6G cells (E). Flow cytometric analysis was performed in at least 3 independent experiments. Data are mean±SEM. ***P<0.001; n.s., not significant. EGFP indicates enhanced green fluorescent protein; ERK, extracellular signal‐regulated kinase; MerTK, Mer tyrosine kinase; M‐CSF, macrophage colony‐stimulating factor; MI, myocardial infarction; pERK, phosphorylated extracellular signal‐regulated kinase; rIL, recombinant interleukin; and WT, wild‐type.
Figure 7
Figure 7. ERK1/2 phosphorylation regulates in vivo osteopontin expression.
A, Representative histogram of pERK1/2 (Thr202/Tyr204) expression in cardiac F4/80+ CD11b+Ly6G cells of either sham‐operated or post‐MI hearts on day 3 (n=3 mice per group) (A). Bar graph shows the percentage of pERK1/2 (Thr202/Tyr204)‐expressing cells in F4/80+CD11b+Ly6G cells (n=3 mice per group) (B). C through I, DMSO or SCH772984 (ERK1/2 inhibitor) was administered to EGFP‐Spp1‐knock‐in reporter mice via intraperitoneal injection from 1 day before MI to 3 days after MI. Representative flow cytometry histogram of pERK1/2 expression in cardiac F4/80+CD11b+Ly6G cells treated with either DMSO or SCH772984 (C). Bar graph shows the percentage of pERK1/2 (Thr202/Tyr204)‐expressing cells in F4/80+CD11b+Ly6G cells (n=5 mice per group) (D). Flow cytometric analysis of intracellular galectin‐3 and MerTK expression in F4/80+CD11b+Ly6G cells from post‐MI hearts treated DMSO or SCH772984. Representative scatter plot of galectin‐3hi MerTK expression in F4/80+CD11b+Ly6G cells (E). Bar graph shows the percentage of galectin‐3hi MerTK cells in CD11b+Ly6G cells (n=5 mice per group) (F). Representative scatter plot of GFP‐MerTK+ expression in F4/80+CD11b+Ly6G cells (G). Bar graph shows the percentage of Spp1‐GFP+ cells in F4/80+CD11b+Ly6G cells (n=5 mice per group) (H). Bar graph shows the cell number per mg of Spp1‐GFP+F4/80+CD11b+Ly6G cells (n=5 mice per group) (I). Flow cytometric analysis was performed in at least 3 independent experiments. Data are mean±SEM. **P<0.01, ***P<0.001; n.s., not significant. EGFP indicates enhanced green fluorescent protein; ERK, extracellular signal‐regulated kinase; MerTK, Mer tyrosine kinase; MI, myocardial infarction; and pERK, phosphorylated extracellular signal‐regulated kinase.
Figure 8
Figure 8. M‐CSF treatment improves myocardial repair by inducing osteopontin‐producing macrophage differentiation after MI.
A through F, Control reagent or rM‐CSF was administered to EGFP‐Spp1‐knock‐in reporter mice via intravenous injection from day 0 to day 3 after MI. Bar graphs show the percentage (A) and cell number per mg (B) of Spp1‐GFP+ cells in F4/80+CD11b+Ly6G cells from post‐MI hearts. Bar graph shows the intracellular galectin‐3MerTK expression in F4/80+CD11b+Ly6G cells from post‐MI hearts (C). mRNA expression levels of Spp1 (D) and Col1a1 (E) were quantified in post‐MI hearts on day 3 of WT mice treated with control regent or rM‐CSF (n=9 mice per group). Histochemical identification of TUNEL‐positive cells in post‐MI hearts from EGFP‐Spp1‐knock‐in reporter mice on day 7 (F). Total cell number of TUNEL‐positive cells in post‐MI hearts (G). Schematic illustration depicts the pathway that induced the differentiation of osteopontin‐producing macrophages after MI (H). Data are mean±SEM. *P<0.05, **P<0.01, ***P<0.001. EGFP indicates enhanced green fluorescent protein; M‐CSF, macrophage colony‐stimulating factor; MerTK, Mer tyrosine kinase; MI, myocardial infarction; rM‐CSF, recombinant macrophage colony‐stimulating factor; and TUNEL, terminal deoxynucleotidyl transferase 2′‐deoxyuridine‐5′‐triphosphate nick‐end labeling.

References

    1. Horckmans M, Ring L, Duchene J, Santovito D, Schloss MJ, Drechsler M, Weber C, Soehnlein O, Steffens S. Neutrophils orchestrate post‐myocardial infarction healing by polarizing macrophages towards a reparative phenotype. Eur Heart J. 2017;187–197. - PubMed
    1. Wan E, Yeap XY, Dehn S, Terry R, Novak M, Zhang S, Iwata S, Han X, Homma S, Drosatos K, et al. Enhanced efferocytosis of apoptotic cardiomyocytes through myeloid‐epithelial‐reproductive tyrosine kinase links acute inflammation resolution to cardiac repair after infarction. Circ Res. 2013;1004–1012. - PMC - PubMed
    1. Shiraishi M, Shintani Y, Shintani Y, Ishida H, Saba R, Yamaguchi A, Adachi H, Yashiro K, Suzuki K. Alternatively activated macrophages determine repair of the infarcted adult murine heart. J Clin Invest. 2016;2151–2166. - PMC - PubMed
    1. DeBerge M, Yeap XY, Dehn S, Zhang S, Grigoryeva L, Misener S, Procissi D, Zhou X, Lee DC, Muller WA, et al. MerTK cleavage on resident cardiac macrophages compromises repair after myocardial ischemia reperfusion injury. Circ Res. 2017;930–940. - PMC - PubMed
    1. Wynn TA, Vannella KM. Macrophages in tissue repair, regeneration, and fibrosis. Immunity. 2016;450–462. - PMC - PubMed

Publication types

MeSH terms