

Complement activation in polycystic ovary syndrome occurs in the postprandial and fasted state and is influenced by obesity and insulin sensitivity
- PMID: 32865246
- PMCID: PMC9623543
- DOI: 10.1111/cen.14322
Complement activation in polycystic ovary syndrome occurs in the postprandial and fasted state and is influenced by obesity and insulin sensitivity
Abstract
Objective: Polycystic ovary syndrome (PCOS) is associated with metabolic risk. Complement proteins regulate inflammation and lipid clearance but their role in PCOS-associated metabolic risk is unclear. We sought to establish whether the complement system is activated in PCOS in the fasting and postprandial state.
Design: Case-control study.
Patients: Fasting complement levels were measured in 84 women with PCOS and 95 healthy controls. Complement activation post-oral fat tolerance test (OFTT) was compared in 40 additional subjects (20 PCOS, 20 controls).
Measurements: Activation pathway (C3, C4, C3a(desArg), factor B, factor H, properdin, Factor D) and terminal pathway (C5, C5a, terminal complement complex [TCC]) proteins were measured by commercial or in-house assays.
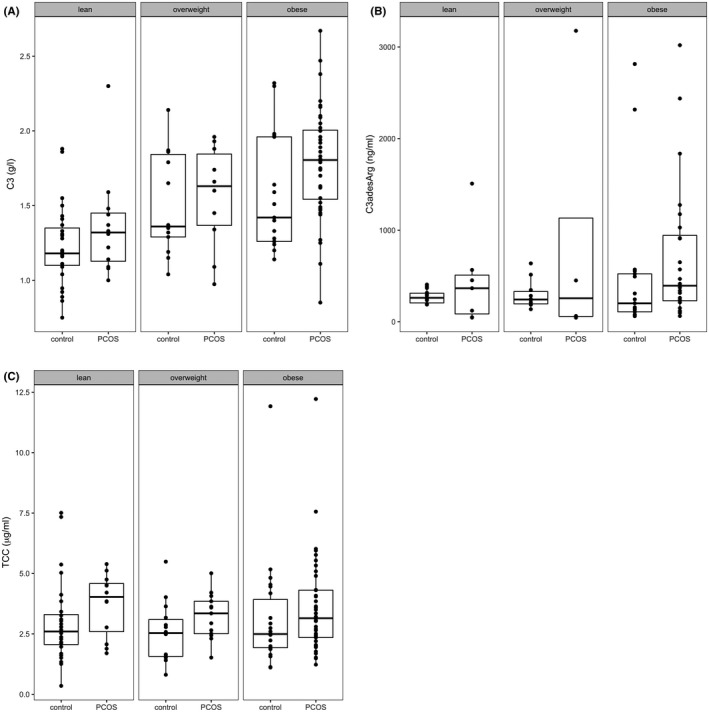
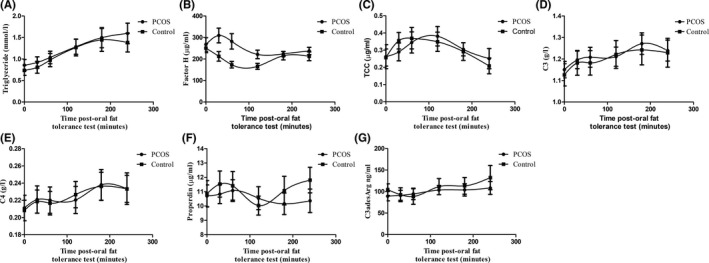
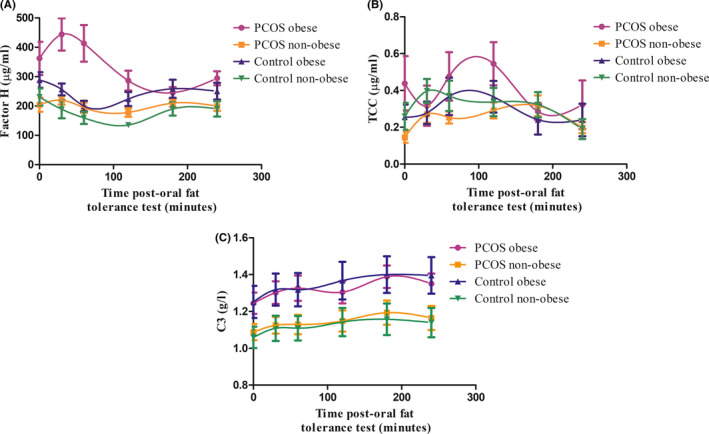
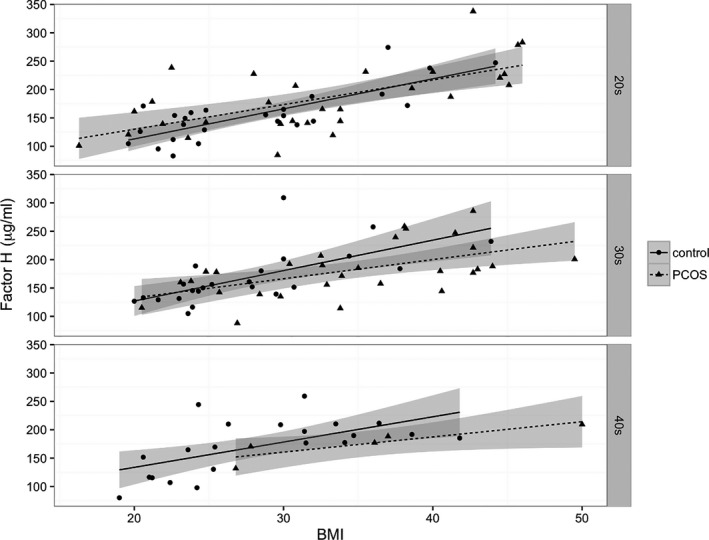
Results: Fasting C3, C3a(desArg) and TCC concentrations were increased in insulin-resistant (adjusted differences: C3 0.13 g/L [95%CI 0-0.25]; C3a(desArg) 319.2 ng/mL [19.5-619]; TCC 0.66 μg/mL [0.04-1.28]) but not in insulin-sensitive women with PCOS. C3 and factor H levels increased with obesity. Post-OFTT, C3 and C4 levels increased to a similar extent in PCOS subjects and controls, whist factor H levels increased more in women with PCOS compared to controls (adjusted differences (area under the curve): 12 167 μg min/mL [4942-19 392]), particularly in the presence of concomitant obesity.
Conclusions: Activation and terminal complement pathway components are elevated in patients with PCOS, especially in the presence of insulin resistance and obesity.
Keywords: complement system proteins; insulin resistance; obesity; polycystic ovary syndrome.
© 2020 The Authors. Clinical Endocrinology published by John Wiley & Sons Ltd.
Conflict of interest statement
The authors have no conflicts of interest to declare.
Figures
Similar articles
-
Components of the Complement Cascade Differ in Polycystic Ovary Syndrome.Int J Mol Sci. 2022 Oct 13;23(20):12232. doi: 10.3390/ijms232012232. Int J Mol Sci. 2022. PMID: 36293087 Free PMC article.
-
Complement Dysregulation in Obese Versus Nonobese Polycystic Ovary Syndrome Patients.Cells. 2023 Aug 4;12(15):2002. doi: 10.3390/cells12152002. Cells. 2023. PMID: 37566081 Free PMC article.
-
Association of Complement Proteins with C Reactive Protein in Non-Obese Women with and Without Polycystic Ovary Syndrome.Int J Mol Sci. 2025 Mar 26;26(7):3008. doi: 10.3390/ijms26073008. Int J Mol Sci. 2025. PMID: 40243681 Free PMC article.
-
Metabolism and insulin signaling in common metabolic disorders and inherited insulin resistance.Dan Med J. 2014 Jul;61(7):B4890. Dan Med J. 2014. PMID: 25123125 Review.
-
AMERICAN ASSOCIATION OF CLINICAL ENDOCRINOLOGISTS, AMERICAN COLLEGE OF ENDOCRINOLOGY, AND ANDROGEN EXCESS AND PCOS SOCIETY DISEASE STATE CLINICAL REVIEW: GUIDE TO THE BEST PRACTICES IN THE EVALUATION AND TREATMENT OF POLYCYSTIC OVARY SYNDROME - PART 2.Endocr Pract. 2015 Dec;21(12):1415-26. doi: 10.4158/EP15748.DSCPT2. Endocr Pract. 2015. PMID: 26642102 Review.
Cited by
-
Components of the Complement Cascade Differ in Polycystic Ovary Syndrome.Int J Mol Sci. 2022 Oct 13;23(20):12232. doi: 10.3390/ijms232012232. Int J Mol Sci. 2022. PMID: 36293087 Free PMC article.
-
Inflammatory Markers in Non-Obese Women with Polycystic Ovary Syndrome Are Not Elevated and Show No Correlation with Vitamin D Metabolites.Nutrients. 2022 Aug 27;14(17):3540. doi: 10.3390/nu14173540. Nutrients. 2022. PMID: 36079796 Free PMC article.
-
A Cross-Sectional Study of Alzheimer-Related Proteins in Women with Polycystic Ovary Syndrome.Int J Mol Sci. 2024 Jan 18;25(2):1158. doi: 10.3390/ijms25021158. Int J Mol Sci. 2024. PMID: 38256230 Free PMC article.
-
A bibliometric analysis and visualization of literature on non-fasting lipid research from 2012 to 2022.Front Endocrinol (Lausanne). 2023 Apr 19;14:1136048. doi: 10.3389/fendo.2023.1136048. eCollection 2023. Front Endocrinol (Lausanne). 2023. PMID: 37152935 Free PMC article.
-
Proteomics and bioinformatics analysis of follicular fluid from patients with polycystic ovary syndrome.Front Mol Biosci. 2022 Aug 22;9:956406. doi: 10.3389/fmolb.2022.956406. eCollection 2022. Front Mol Biosci. 2022. PMID: 36072434 Free PMC article.
References
-
- Morgan CL, Jenkins‐Jones S, Currie CJ, Rees DA. Evaluation of adverse outcome in young women with polycystic ovary syndrome versus matched, reference controls: a retrospective, observational study. J Clin Endocrinol Metab. 2012;97:3251‐3260. - PubMed
-
- Engström G, Hedblad B, Eriksson KF, Janzon L, Lindgärde F. Complement C3 is a risk factor for the development of diabetes: a population‐based cohort study. Diabetes. 2005;54:570‐575. - PubMed
-
- Engström G, Hedblad B, Janzon L, Lindgärde F. Complement C3 and C4 in plasma and incidence of myocardial infarction and stroke: a population‐based cohort study. Eur J Cardiovasc Prev Rehabil. 2007;14:392‐397. - PubMed
Publication types
MeSH terms
Substances
Grants and funding
LinkOut - more resources
Full Text Sources
Medical
Miscellaneous
