. 2020 Nov;33(11):e4397.
doi: 10.1002/nbm.4397. Epub 2020 Aug 31.

Imaging of two samples with a single transmit/receive channel using coupled ceramic resonators for MR microscopy at 17.2 T

Affiliations

Imaging of two samples with a single transmit/receive channel using coupled ceramic resonators for MR microscopy at 17.2 T

Marine A C Moussu et al. NMR Biomed. 2020 Nov.

Abstract

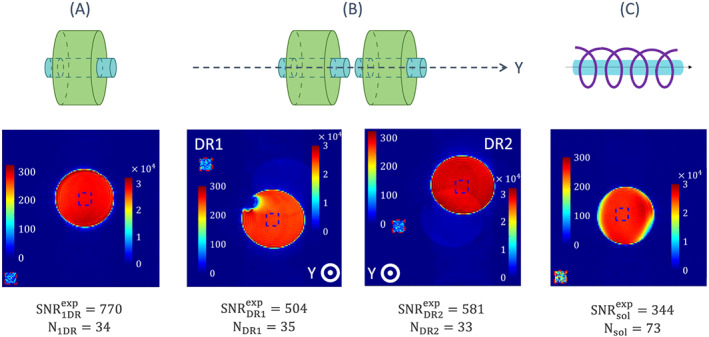
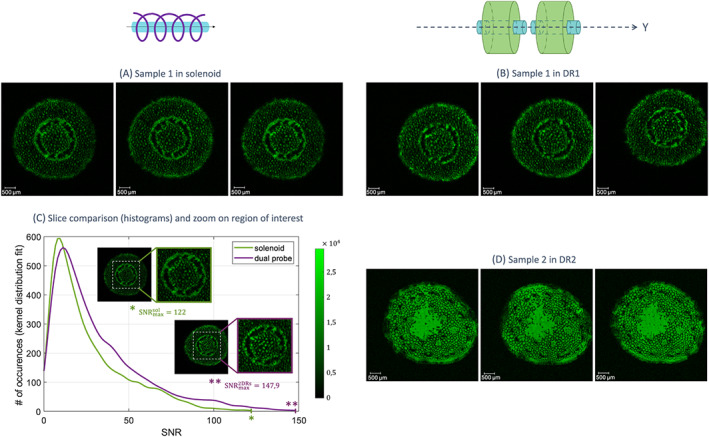
In this paper we address the possibility to perform imaging of two samples within the same acquisition time using coupled ceramic resonators and one transmit/receive channel. We theoretically and experimentally compare the operation of our ceramic dual-resonator probe with a wire-wound solenoid probe, which is the standard probe used in ultrahigh-field magnetic resonance microscopy. We show that due to the low-loss ceramics used to fabricate the resonators, and a favorable distribution of the electric field within the conducting sample, a dual probe, which contains two samples, achieves an SNR enhancement by a factor close to the square root of 2 compared with a solenoid optimized for one sample.

Keywords: dielectric resonators; electromagnetic coupling; magnetic resonance microscopy; signal-to-noise ratio; solenoid.


Figures

FIGURE 1
FIGURE 1
Hybridization scheme and mode field profiles of the first transverse electric (TE) mode of two coupled dielectric resonators. The electromagnetic coupling of the individual TE01δ modes of the single DRs, initially at the same frequency f0 gives rise to two coupled modes whose frequencies are shifted lower and higher than f0.The lower‐frequency, symmetric mode is denoted (++) and is equivalent to a magnetic dipole longer than the initial TE01δmode with zero coupling. The higher‐frequency, antisymmetric mode, denoted (+‐), corresponds to two magnetic dipoles aligned in opposite directions such that the electromagnetic (EM) field maps represent the H‐ and E‐fields of the single resonator TE01δ mode and of the coupled modes. The maps were obtained with the Eigenmode Solver of CST Studio, normalized w.r.t. the maximum in each case and plotted on a linear scale from 0 to 1. The graph on the right represents the H‐field magnitude profiles along the resonator axis for the (++) (purple line) and (+‐) (orange dotted line) modes. For comparison, the H‐field amplitude of the original TE01δ mode has been displayed for each single resonator (blue dashed line)
FIGURE 2
FIGURE 2
Coupled modes frequencies. Left: relative position of the two resonators. Right: coupled modes frequencies versus distance sa between resonators. The results from numerical simulations (CST) with a frequency domain solver and a semi‐analytical model (SAM*) are compared (see Section 3). In the first case, each resonator consists of a dielectric ring containing a sample tube, and the coupled modes are excited with a copper loop (see Section 3.2). In the second case, the resonator consists of a dielectric disk with the same permittivity as the ring. Insets represent the E‐field modulus of the coupled modes, computed with the semi‐analytical model, for different values of the axial shift. The operating region of the experimental probe is indicated with a blue circle
FIGURE 3
FIGURE 3
Electromagnetic field (modulus) maps from numerical simulations (CST Studio) for 1 Watt of input power (impedance matched case). Left, top: (a) H‐field and (b) E‐field of the solenoid; left, bottom: (c) H‐field and (d) E‐field of the single dielectric ring resonator probe. Right: (e) H‐field and (f) E‐field of the dual dielectric ring resonators probe. In each case, the probe contains one (or two) saline water sample(s) of diameter 4 mm, height 14 mm, conductivity 1.59 S/m and relative permittivity 81. The maximum value of magnetic field reached in the sample and the mean value of the electric field in this region are given for comparison. White arrows represent the magnetic field lines. The graph on the right (g) represents the H‐field magnitude profiles, extracted from the magnetic field maps, along the resonator axis and in its centre, for comparison of the (++) coupled mode with the solenoid coil. To this end, the solenoid field profile is represented twice, at the location of each of the coupled DRs
FIGURE 4
FIGURE 4
Experimental dual ceramic probe. (a): schematic. (b): view of the probe with the two DRs, and their respective samples, the feeding loop and the direction of displacement. The loop holder can be slid on the rail from the outside of the MR device bore. (c): view of the two DRs with their samples
FIGURE 5
FIGURE 5
Experimental SNR investigation. SNR maps of (a) a single ceramic probe, (b) a dual ceramic probe and (c) the optimal solenoid. The signal and noise boxes are represented in blue and red dashed contours, respectively, with their own color scale. The signal value is computed from the mean value of the pixels in the signal box, within the sample, and the noise from the standard deviation of the noise box located outside the sample, as shown on each slice. The numerical values of the noise level and the SNR are given below each figure. The sample is a saline water tube of relative permittivity 81 and electrical conductivity 1.59 S/m in this range of frequencies. In the left map of (b), the low signal region within the tube is an air bubble
FIGURE 6
FIGURE 6
MR acquisitions of plant petioles with the dual ring probe and with the solenoid coil. Images were selected from the same acquisition for the two samples imaged with the dual probe. Two petioles from two different plants were used as samples 1 and 2. Sample 1 was imaged with (a) the solenoid coil and (b) the dual probe (in DR1) using identical acquisition parameters. In selected slices of these acquisitions (based on the similarity of the imaged part of the petiole), the histogram profiles (fitted by a kernel distribution) of the pixel values were plotted for each probe, divided by their respective noise level (c). This provides the distribution of SNR values pixel by pixel in the selected slices. The highest SNR value reached with the proposed dual ceramic probe is 1.21 times higher than that of the solenoid coil. (d) Sample 2 was imaged with the dual probe (in DR2) during the same acquisition time slot as sample 1. In (a), (b) and (d), the selected images are represented with a linear scale from 0 to 1 since they are normalized with respect with their respective maximum values. In (c), the compared slices are represented with the same, indicated linear scale

References

    1. Ciobanu L. Microscopic magnetic resonance imaging: A practical perspective. Singapore: Pan Stanford Publishing; 2017.
    1. Glover P, Mansfield P. Limits to magnetic resonance microscopy. Rep Prog Phys. 2002;65(10):1489‐1511.
    1. Schadewijk VR, Krug JR, Shen D, et al. Magnetic resonance microscopy at cellular resolution and localised spectroscopy of Medicago truncatula at 22.3 Tesla. Sci Rep. 2020;10(1):1‐11. - PMC - PubMed
    1. Weiger M, Schmidig D, Denoth S, et al. NMR microscopy with isotropic resolution of 3.0 𝜇m using dedicated hardware and optimized methods. Concepts Magn Reson Part B: Magn Reson Eng: Educat J. 2008;33(2):84‐93.
    1. Ciobanu L, Seeber D, Pennington C. 3D MR microscopy with resolution 3.7 𝜇m by 3.3 𝜇m by 3.3 𝜇m. J Magn Reson. 2002;158(1–2):178‐182. - PubMed

Publication types

MeSH terms