. 2020 Aug 17;117(33-34):545-552.
doi: 10.3238/arztebl.2020.0545.

Medical Emergencies During the COVID-19 Pandemic

Collaborators, Affiliations

Medical Emergencies During the COVID-19 Pandemic

Anna Slagman et al. Dtsch Arztebl Int. .

Abstract

Background: In this study, we investigate the number of emergency room consultations during the COVID-19 pandemic of 2020 in Germany compared to figures from the previous year.

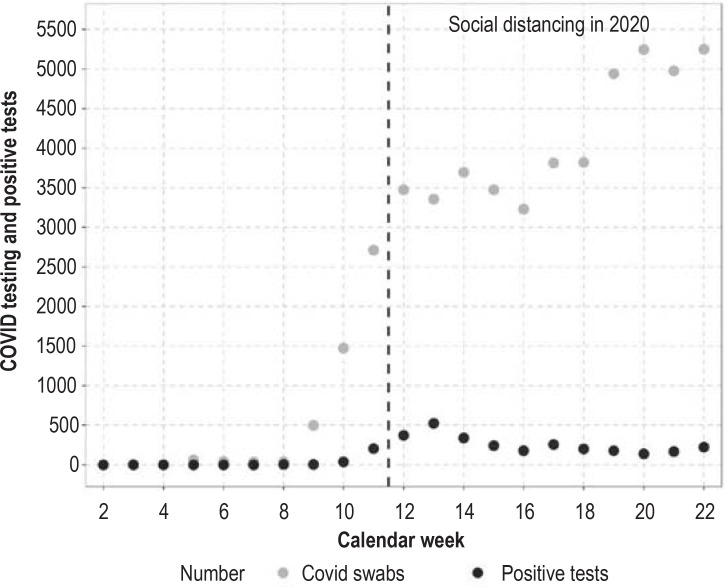
Methods: Case numbers from calendar weeks 1 through 22 of the two consecutive years 2019 and 2020 were obtained from 29 university hospitals and 7 non-university hospitals in Germany. Information was also obtained on the patients' age, sex, and urgency, along with the type of case (outpatient/inpatient), admitting ward, and a small number of tracer diagnoses (I21, myocardial infarction; J44, COPD; and I61, I63, I64, G45, stroke /TIA), as well as on the number of COVID-19 cases and of tests performed for SARS-CoV-2, as a measure of the number of cases in which COVID-19 was suspected or at least included in the differential diagnoses.

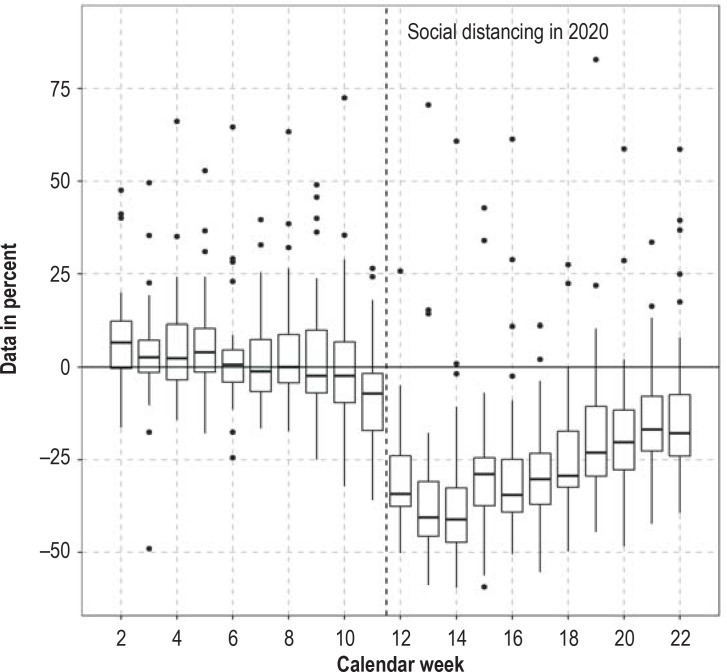
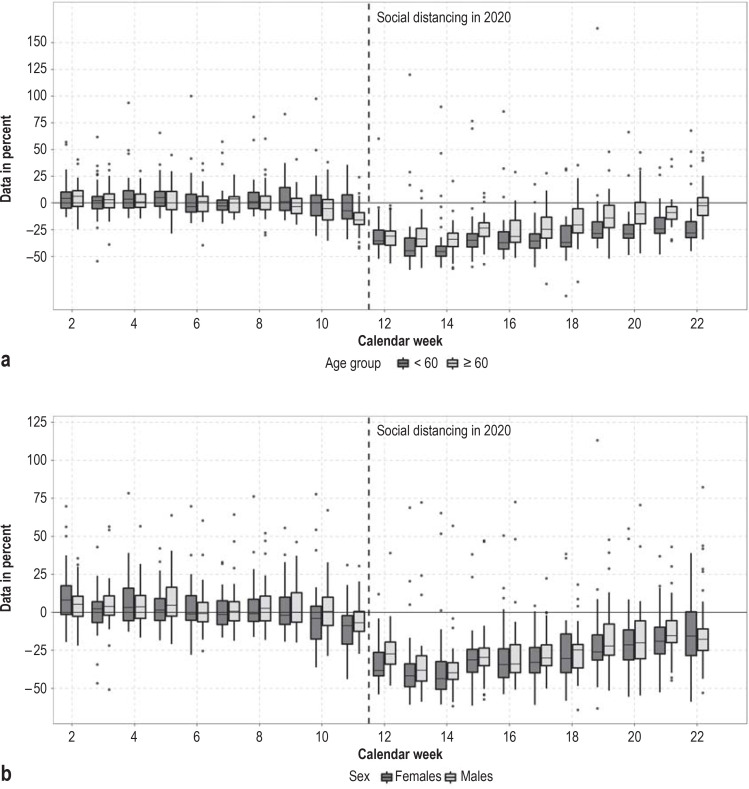
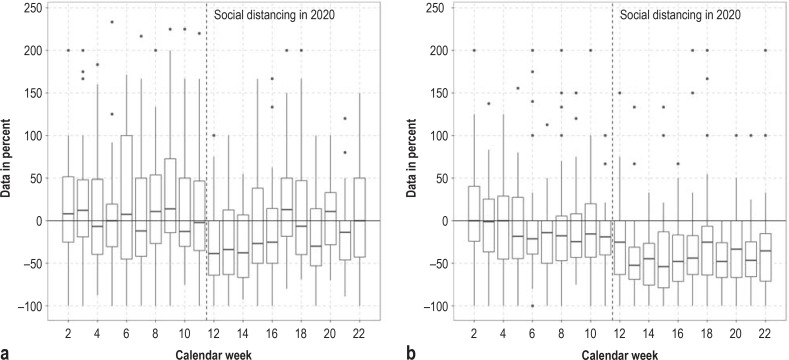
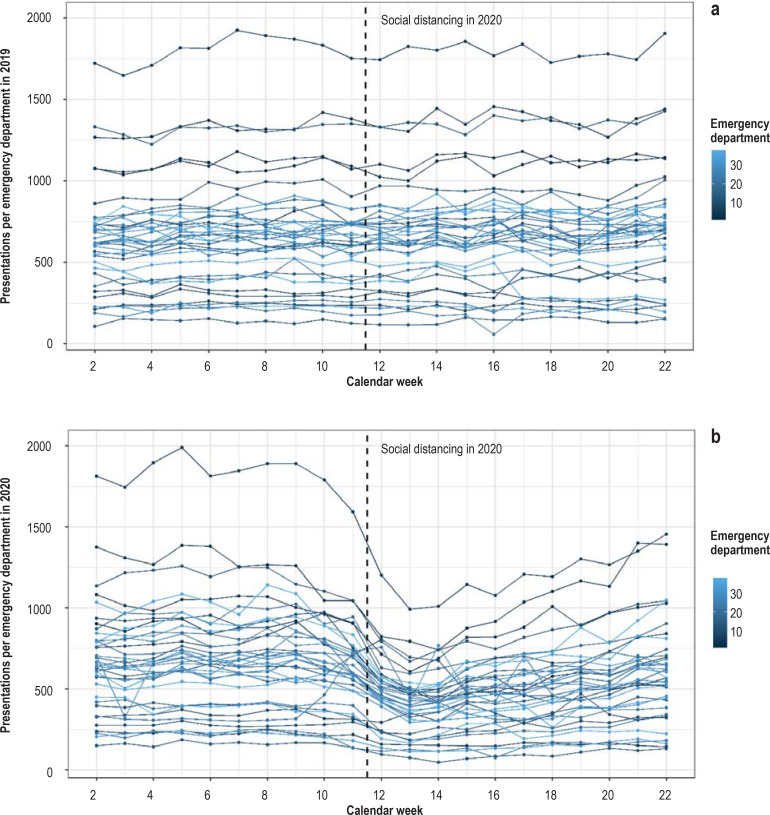
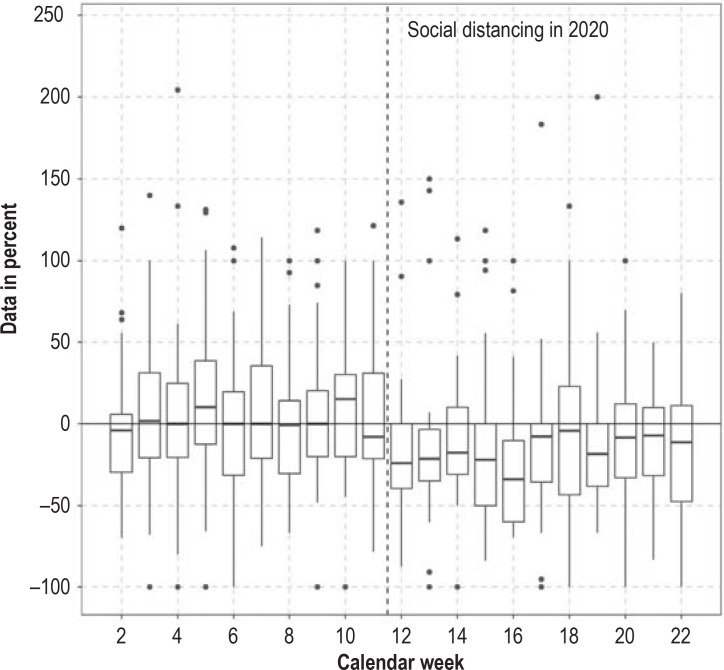
Results: A total of 1 022 007 emergency room consultations were analyzed, of which 546 940 took place in 2019 and 475 067 in 2020. The number of consultations with a positive test for the COVID-19 pathogen was 3122. The total number of emergency room consultations in the observation period was 13% lower in 2020 than in 2019, with a maximum drop by 38% coinciding with the highest number of COVID-19 cases (calendar week 14; 572 cases). After the initiation of interpersonal contact restrictions in 2020, there was a marked drop in COVID-19 case numbers, by a mean of -240 cases per week per emergency room (95% confidence interval [-284; -128]). There was a rise in case numbers thereafter, by a mean of 17 patients per week [14; 19], and the number of cases of myocardial infarction returned fully to the level seen in 2019.

Conclusion: In Germany, the COVID-19 pandemic led to a significant drop in medical emergencies of all kinds presenting to the nation's emergency departments. A recovery effect began to be seen as early as calendar week 15, but the levels seen in 2019 were not yet reached overall by calendar week 22; only the prevalence of myocardial infarction had renormalized by then. The reasons for this require further investigation.


Figures

Figure 1
Figure 1
A comparison of the relative change in presentations across participating emergency departments in calendar weeks 1–22 in 2019 and 2020.
Figure 2
Figure 2
Relative deviations (%) in the number of presentations across participating emergency departments. a) Relative deviation in the number of presentations between 2019 and 2020 stratified according to age groups (= 60 years and <60 years). b) Stratified according to gender (male, female)
Figure 3
Figure 3
Relative deviations (%) in the number of presentations across participating emergency departments. a) Stratified according to urgency (primary assessment predominantly using MTS, ESI; urgent: triage categories 1–3 (red, orange, yellow); less urgent: triage categories 4 and 5 (green, blue) b) Stratified according to specialty (trauma; non-trauma) c) Stratified according to hospital setting (outpatient vs. inpatient); outliers over 250% are not shown in the presentation (trauma n = 3, hospital setting n = 4). ESI, Emergency Severity Index; MTS, Manchester Triage Scale
Figure 4
Figure 4
Relative deviations (%) in the number of presentations across participating emergency departments for selected tracer diagnoses. a) Myocardial infarction b) COPD: outliers over 250% are not shown in the presentation (COPD diagnosis n = 13, MI diagnosis n = 15). See eFigure 3 for the diagnosis stroke/TIA.
eFigure 1
eFigure 1
Presentation of case numbers in the various emergency departments in the calendar weeks 2–22 a) in 2019 and b) in 2020. In one emergency department, the cases at a COVID testing site were formally documented for 2 calendar weeks via the emergency department, meaning that a rise in case numbers is seen here for 2020, which, however, is due not to additional medical emergencies, but to SARS-CoV-2 testing.
eFigure 2
eFigure 2
Absolute frequencies of SARS-CoV2 tests performed in calendar weeks 1–22 in 2020 at participating emergency departments. Absolute number of Covid tests and positive tests.
eFigure 3
eFigure 3
Relative deviations (%) in the number of presentations at participating emergency departments for the diagnosis stroke/TIA (transient ischemic attack). Outliers over 250% are not shown in the presentation (n = 8). A comparison of calendar weeks 1–22 in 2019 and 2020.

Similar articles

Cited by

References

    1. Zhou P, Yang XL, Wang XG, et al. A pneumonia outbreak associated with a new coronavirus of probable bat origin. Nature. 2020;579:270–273. - PMC - PubMed
    1. Bundestag D. Gesetz zum Schutz der Bevölkerung bei einer epidemischen Lage nationaler Tragweite. Bundesgesetzblatt. 2020:587–592.
    1. Saglietto A, D‘Ascenzo F, Zoccai GB, De Ferrari GM. COVID-19 in Europe: the Italian lesson. Lancet. 2020;395:1110–1111. - PMC - PubMed
    1. Möckel M, Bachmann U, Behringer W, Pfäfflin F, Stegemann MS. How emergency departments prepare for virus disease outbreaks like COVID-19. Eur J Emerg Med. 2020;27:161–162. - PMC - PubMed
    1. Kluge S, Janssens U, Welte T, Weber-Carstens S, Marx G, Karagiannidis C. Empfehlungen zur intensivmedizinischen Therapie von Patienten mit COVID-19. Med Klin Intensivmed Notfmed. 2020;115:175–177. - PMC - PubMed