Case Reports
. 2020 Oct 1;130(10):5272-5286.
doi: 10.1172/JCI134966.

Human NK cell deficiency as a result of biallelic mutations in MCM10

Affiliations
Case Reports

Human NK cell deficiency as a result of biallelic mutations in MCM10

Emily M Mace et al. J Clin Invest. .

Abstract

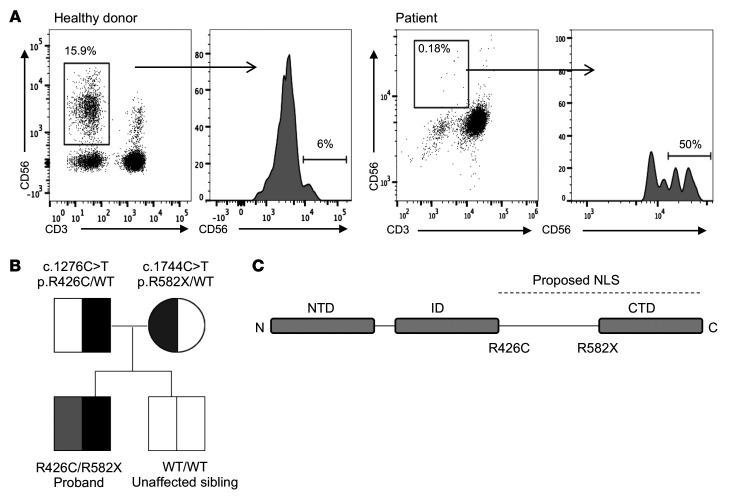
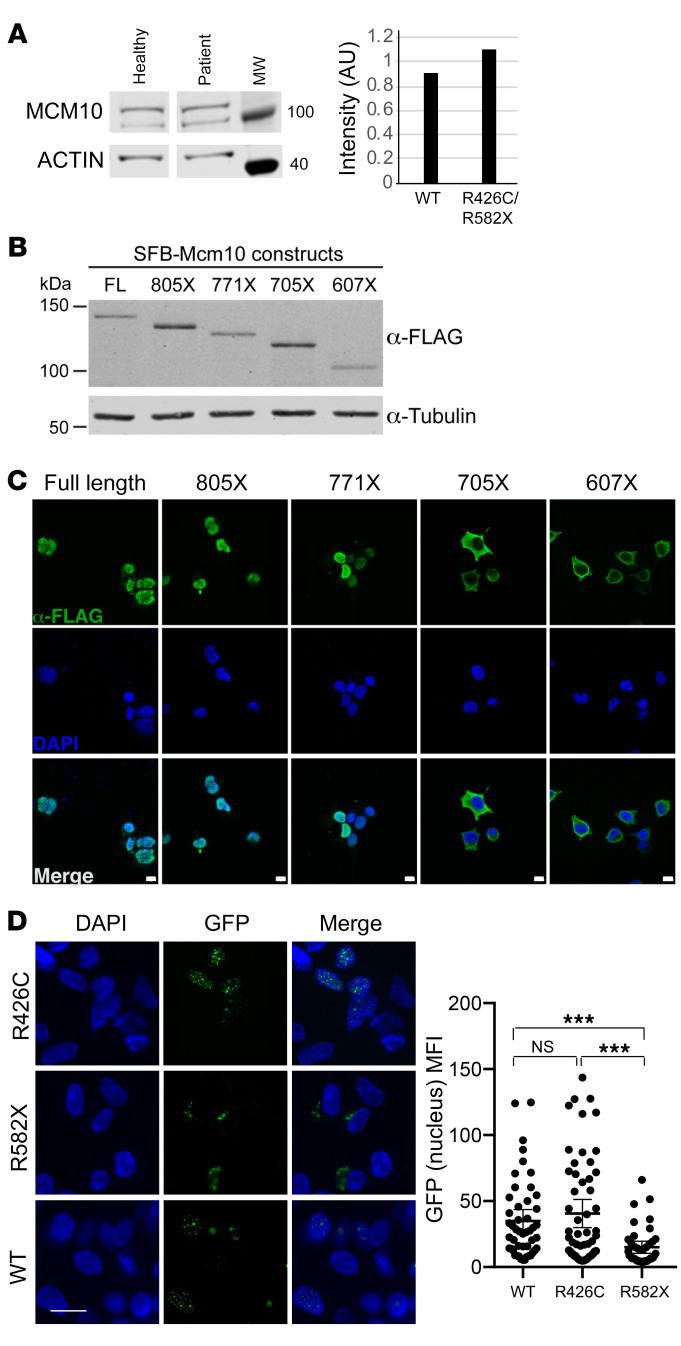
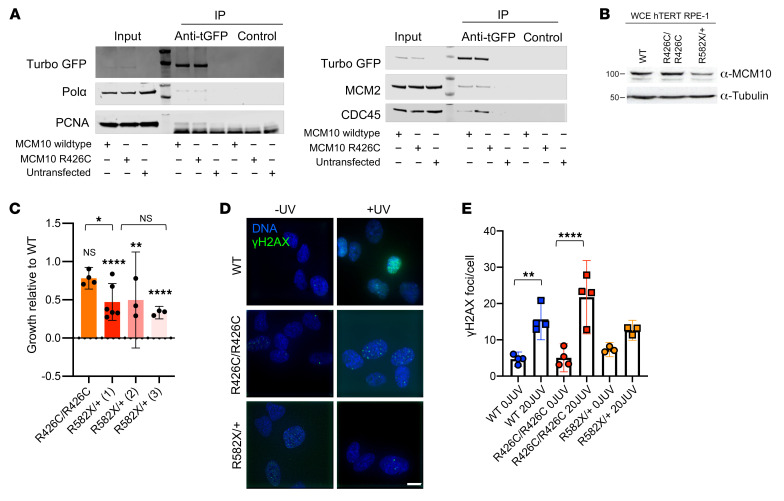
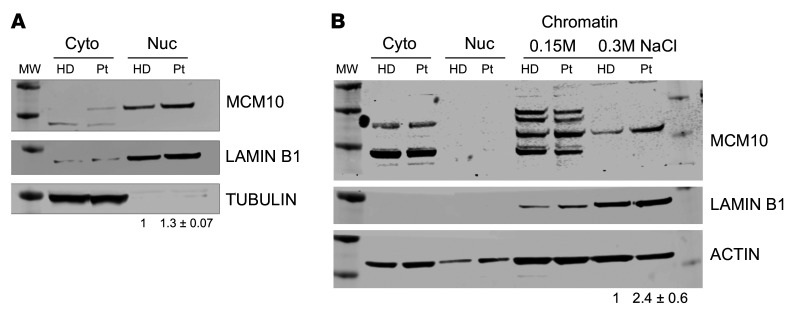
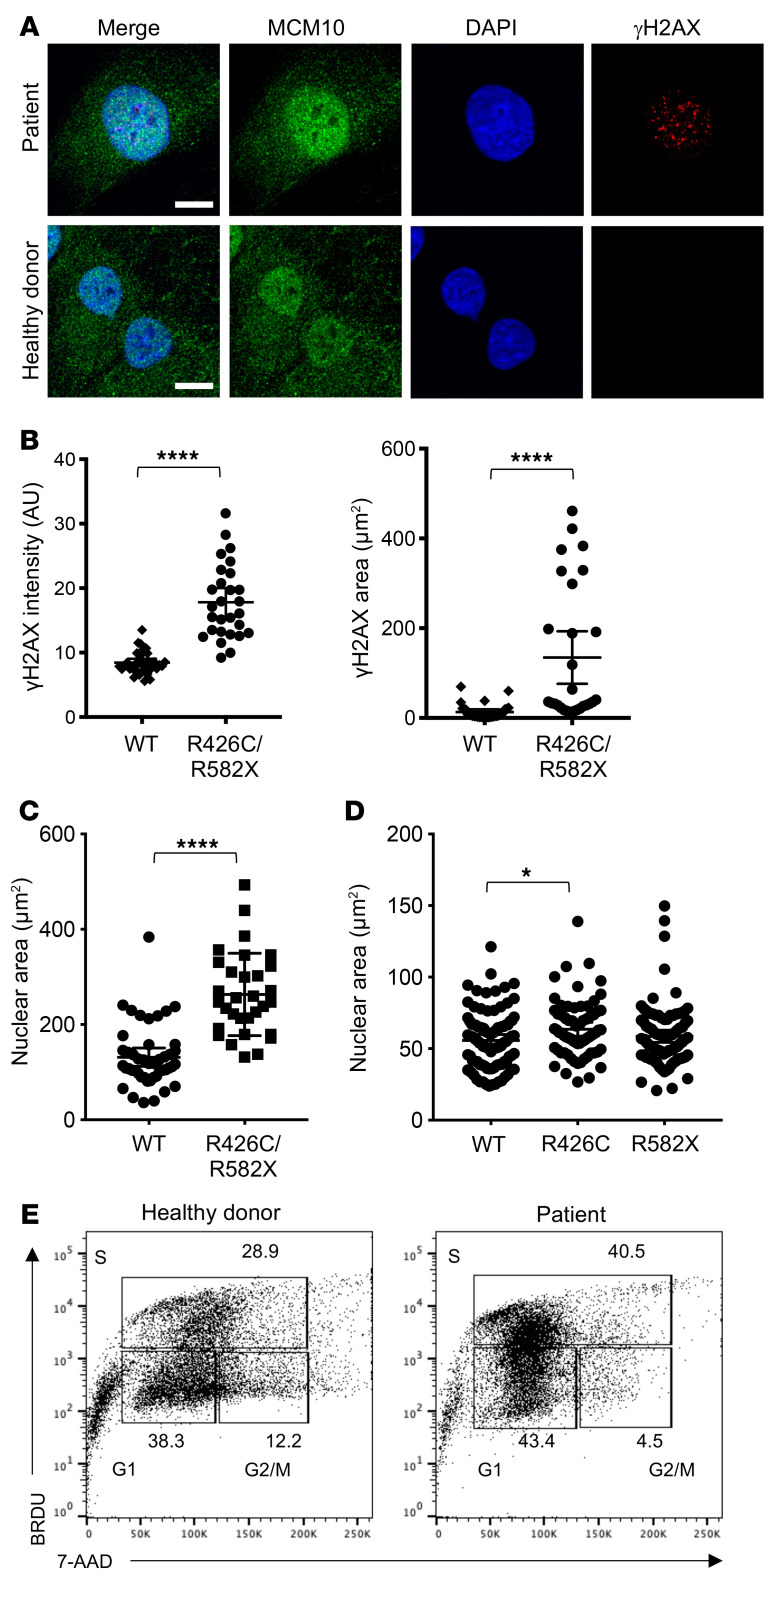
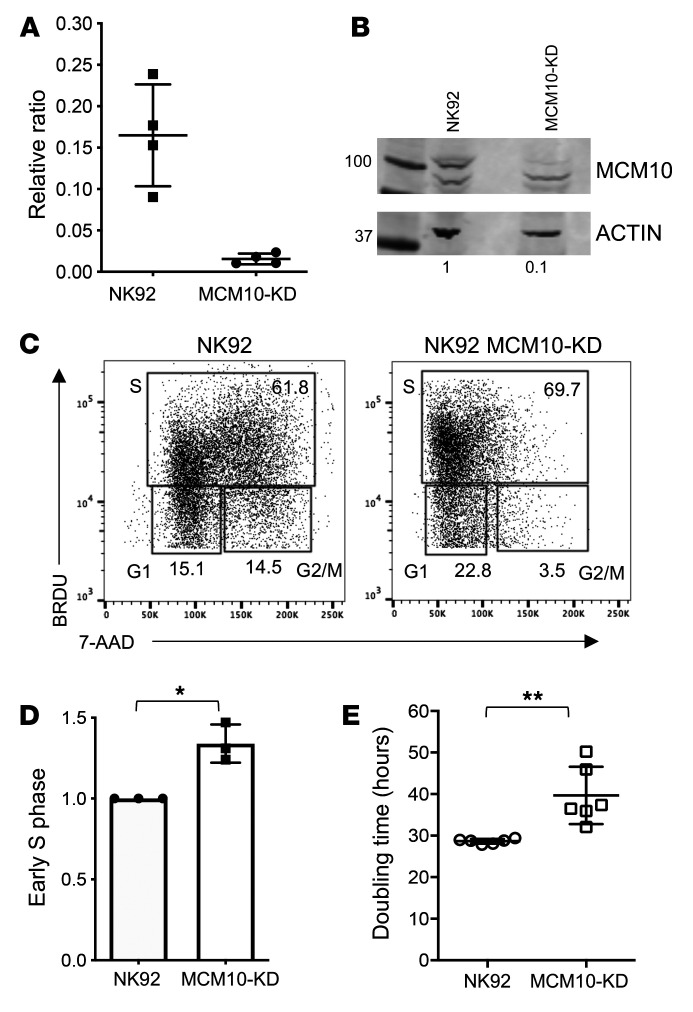
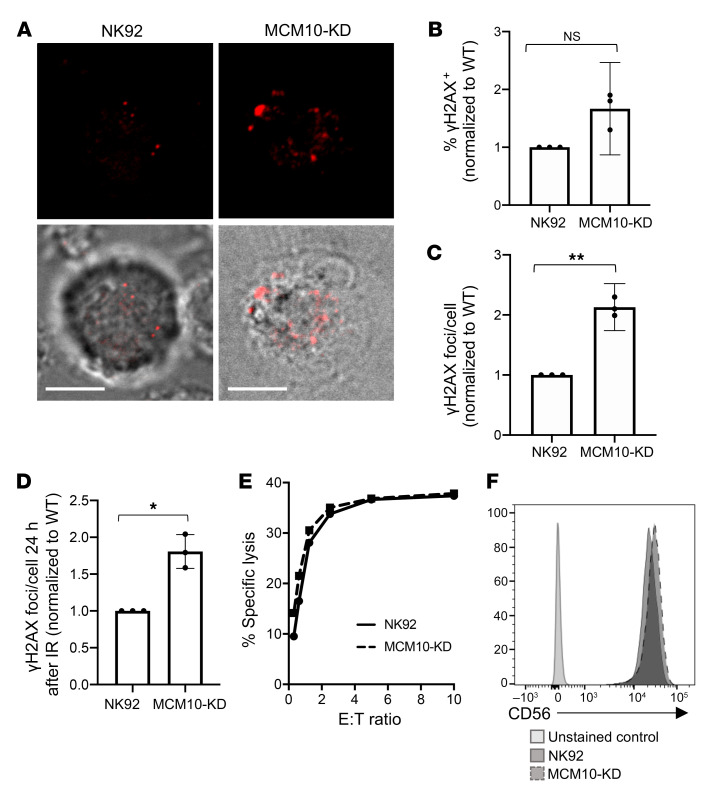
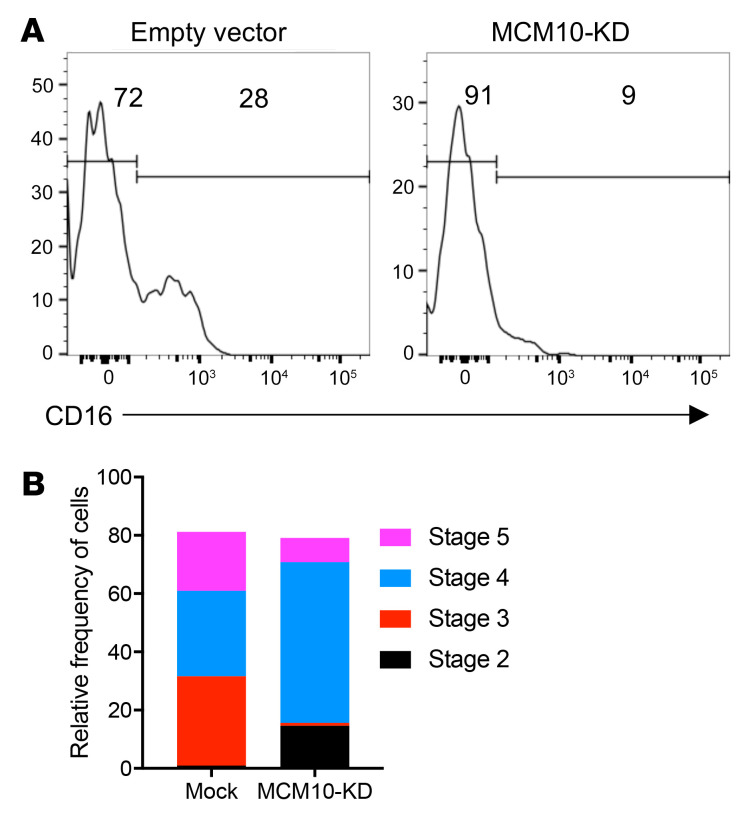
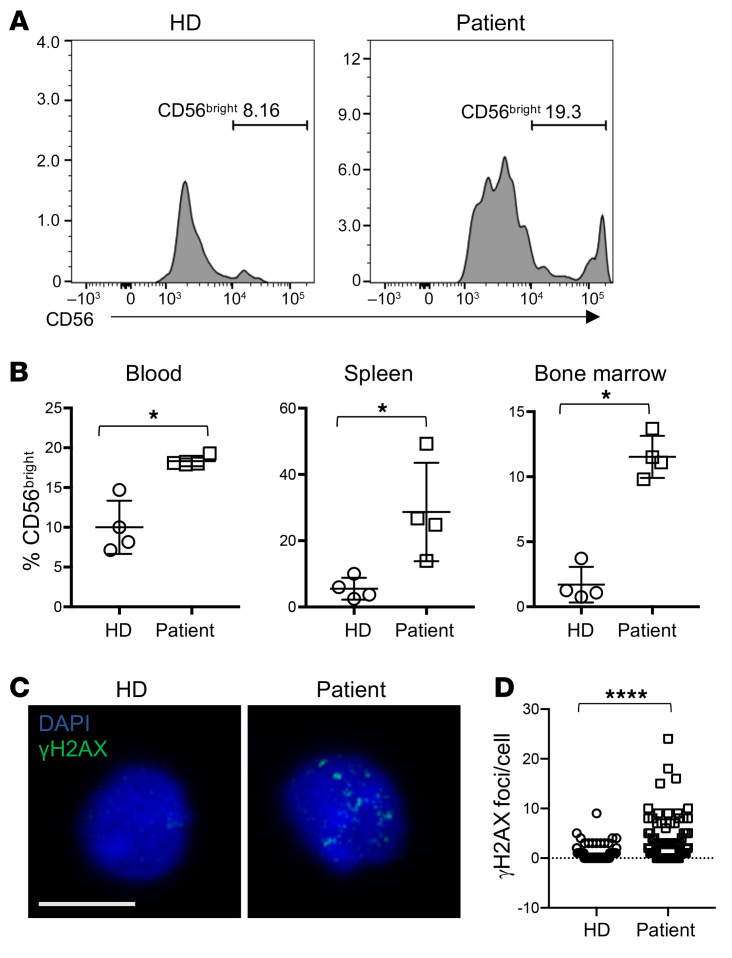
Human natural killer cell deficiency (NKD) arises from inborn errors of immunity that lead to impaired NK cell development, function, or both. Through the understanding of the biological perturbations in individuals with NKD, requirements for the generation of terminally mature functional innate effector cells can be elucidated. Here, we report a cause of NKD resulting from compound heterozygous mutations in minichromosomal maintenance complex member 10 (MCM10) that impaired NK cell maturation in a child with fatal susceptibility to CMV. MCM10 has not been previously associated with monogenic disease and plays a critical role in the activation and function of the eukaryotic DNA replisome. Through evaluation of patient primary fibroblasts, modeling patient mutations in fibroblast cell lines, and MCM10 knockdown in human NK cell lines, we have shown that loss of MCM10 function leads to impaired cell cycle progression and induction of DNA damage-response pathways. By modeling MCM10 deficiency in primary NK cell precursors, including patient-derived induced pluripotent stem cells, we further demonstrated that MCM10 is required for NK cell terminal maturation and acquisition of immunological system function. Together, these data define MCM10 as an NKD gene and provide biological insight into the requirement for the DNA replisome in human NK cell maturation and function.

Keywords: Genetic diseases; Immunology; NK cells.


Conflict of interest statement

Conflict of interest: Baylor College of Medicine and Miraca Holdings Inc. have formed a joint venture with shared ownership and governance of Baylor Genetics (BG), which performs clinical microarray analysis and clinical exome sequencing. JRL serves on the scientific advisory board of BG. JRL has stock ownership in 23andMe, is a paid consultant for Regeneron Pharmaceuticals, and is a coinventor on multiple US and European patents related to molecular diagnostics for inherited neuropathies, eye diseases, and bacterial genomic fingerprinting (US-8129353-B2, JP-2016025868-A, WO-02051981-A3, EP-0610396-B1, AU-633495-B2, US-5294533-A, AU-6538698-A, US-5306616-A, US-6132954-A, AU-2747802-A, AU-2226592-A, WO-9000624-A1).

Figures

Figure 1
Figure 1. Decreased frequency of peripheral blood NK cells with overrepresentation of the CD56bright subset in an individual with compound heterozygous mutations in MCM10.
Severe CMV infection in the male proband born to healthy parents led to evaluation of peripheral blood NK cells and whole exome sequencing of the proband and his immediate family. (A) Flow cytometric analysis of peripheral blood NK cells from a representative healthy donor (left) and the proband (right). NK cells are defined as CD56+CD3. The relative frequency of CD56bright NK cells within the NK cell subset is defined by density of CD56 staining (histograms). (B) Whole exome sequencing identified compound heterozygous mutations that were rare and predicted to be damaging with familial segregation. (C) Location of identified variants relative to MCM10 domains. Dashed line indicates previously defined NLS (32). NTD, N-terminal domain; ID, internal domain; CTD, C-terminal domain.
Figure 2
Figure 2. Expression and localization of MCM10 mutants.
(A) Primary fibroblasts from proband or healthy donor were lysed and probed for MCM10 (left). Intensity of MCM10 was normalized to loading control (actin, right). (B) Western blot of stable SFB-MCM10 expression in 293T whole cell extracts. Full-length SFB-MCM10 and truncation mutants were detected with anti-FLAG antibody (top) and with anti–α-tubulin antibody as a loading control (bottom). (C) Confocal imaging of SFB-MCM10 localization in stable 293T cell lines. Full-length SFB-MCM10 and truncation mutants were detected with anti-FLAG antibody (green) with DAPI staining (blue). Scale bars: 10 μm. (D) WT GFP-MCM10 or GFP-R582X MCM10 were transiently expressed in 293T cells and imaged by confocal microscopy with quantification of nuclear GFP (right). Mean ± 95% CI. ***P < 0.001, Kruskal-Wallis with Dunn’s multiple comparison test. n = 48 (WT); n = 55 (R426C); n = 40 (R582X). Scale bars: 10 μm. Data representative of 3 technical replicates.
Figure 3
Figure 3. Independent damaging effects of R426C and R582X mutations.
(A) WT MCM10-GFP or R426C MCM10-GFP constructs transiently expressed in 293T cells. GFP was immunoprecipitated and blots probed for POLA, MCM2, PCNA, CDC45. (B) Whole cell extract (WCE) of parental (WT), R426C homozygous patient mutation (R426C/R426C), and R582X heterozygous patient mutation (R582X/+) hTERT RPE-1 cell lines probed for MCM10. Data are representative of 3 technical replicates. (C) Parental (WT), R426C homozygous patient mutation (R426C/R426C), and 3 R582X heterozygous mutation clones (R582X/+ 1, 2 and 3) counted after 72 hours to calculate doubling time. Data are represented as mean ± 95% CI. n = 3–6 technical replicates. Symbols directly over bars indicate significance of mutant compared with WT. (D) γH2AX imaged by confocal microscopy. Scale bar: 10 μm. (E) Mean number of γH2AX foci counted from cells treated with 20J UV or untreated. Data are represented as mean ± 95% CI; each point represents an independent technical replicate. n = 35–68 cells per condition. *P < 0.05; **P < 0.01; ****P < 0.0001, parametric 1-way ANOVA with multiple comparisons.
Figure 4
Figure 4. Effect of compound heterozygous mutations.
Primary fibroblasts from the patient were generated by SV-40 large T antigen transformation. (A) Cells were fractionated as described in Methods, and nuclear and cytoplasmic fractions were probed for MCM10, lamin B1, and α-tubulin. (B) Chromatin fractionation was performed with increasing stringency of salt concentrations (0.15M, 0.3M) from patient fibroblasts immortalized by SV-40 large T antigen transduction. Lysates were probed for MCM10, lamin B1, or actin as a loading control. Intensity of bands from 0.3M condition is quantified relative to loading control. Data are represented as mean ± SD from 3 technical replicates performed on different days. MW, molecular weight marker; HD, healthy donor; Pt, patient.
Figure 5
Figure 5. R426C/R582X mutations lead to increased nuclear area and γH2AX staining in immortalized fibroblasts.
(A) Immortalized fibroblasts were fixed, permeabilized, and incubated with primary anti-MCM10 antibody followed by goat anti-mouse Alexa Fluor 488 secondary antibody and directly conjugated anti-γH2AX Alexa Fluor 647. Slides were mounted with ProLong Gold antifade media with DAPI and imaged by confocal microscopy. Scale bars: 10 μm. (B) MFI of γH2AX staining (left) and area of positive γH2AX signal (right) were measured in 28 to 35 cells per condition. ****P < 0.0001, unpaired t test (left) or Mann-Whitney U test (right). Data are represented as mean ± 95% CI. (C) Nuclear area was measured by positive DAPI staining in 31 (patient) and 46 (healthy donor) cells per condition. ****P < 0.0001, Mann-Whitney U test. Data are represented as mean ± 95% CI. (D) R426C or R582X variants were transiently overexpressed in 293T cells and prepared for microscopy, as described above. Nuclear area determined by DAPI staining was measured. *P < 0.05, Kruskal-Wallis with Dunn’s multiple comparison test. Data are represented as mean ± 95% CI. n = 69 (R426C); n = 95 (R582X, WT). (E) Healthy donor–derived (left) or patient-derived (right) immortalized fibroblast cells were labeled with BRDU and 7-AAD, and cell cycle was analyzed by FACS. All data shown are of 1 representative experiment of 3 technical replicates performed on different days.
Figure 6
Figure 6. Cell cycle arrest in a cell line model of MCM10 KD.
MCM10 expression in NK92 cells was reduced by CRISPR/Cas9 gene editing, as described in Methods. Single clones were expanded and validated, and 1 was selected for further analysis. (A) RNA was isolated from WT NK92 or MCM10-KD cells and qPCR measurement of MCM10 mRNA was performed. Pooled data from 4 independent experiments done in quadruplicate. (B) WT and MCM10-KD NK92 cells were lysed and probed for MCM10 protein and actin as a loading control. Quantification of MCM10 protein normalized to loading control is shown below each lane. Data are representative of 3 technical replicates performed on different days. (C) WT and MCM10-KD NK92 cells were labeled with BRDU and 7-AAD, and cell cycle was analyzed by FACS. (D) Quantification of the frequency of cells in early S phase relative to the WT control is shown from 3 technical replicates performed on different days. *P < 0.05, 1-sample t test and Wilcoxon’s test. (E) Cell-doubling time was calculated by enumerating cells in culture. Data show 6 technical replicates performed on different days. **P < 0.01, Mann-Whitney U test. Data are represented as mean ± 95% CI.
Figure 7
Figure 7. Increased replication stress in an MCM10-KD cell line.
WT or MCM10-KD NK92 cells were fixed, permeabilized, and incubated with anti-γH2AX Alexa Fluor 647. (A) Images were acquired by confocal microscopy. Scale bar: 5 μm. (B) The frequency of cells per field of view that were positive for γH2AX by microscopy was scored by manual counting. Shown are the means from 3 independent replicates performed on different days and normalized to WT NK92. NS, 1-sample t test and Wilcoxon’s test. Data are represented as mean ± 95% CI. (C) The number of γH2AX foci per cell were determined by manual counting of microscopy images. Shown are the means from 3 independent replicates performed on different days and normalized to WT NK92. n = 18–60 cells per condition. **P < 0.01, 1-sample t test and Wilcoxon’s test. Data are represented as mean ± 95% CI. (D) WT NK92 or NK92 MCM10-KD were irradiated with 2 Gy and allowed to recover for 24 hours before fixing and immunostaining for γH2AX. Images were acquired by confocal microscopy, and foci were enumerated by manual counting. Data shown are means from 3 technical replicates performed on different days normalized to WT NK92. n = 10–29 cells per condition. Data are represented as mean ± 95% CI. *P < 0.05, 1-sample t test and Wilcoxon’s test. (E) Cytotoxic function of WT NK92 or MCM10-KD cells against K562 targets was performed by 51Cr release assay. Representative data shown from 3 technical replicates performed on different days. E:T ratio, effector/target ratio. (F) CD56 expression on NK92 (solid line) or MCM10-KD (dashed line) NK92 cells was measured by FACS analysis. Data are representative of 3 technical replicates performed on different days.
Figure 8
Figure 8. MCM10-KD in primary cells impairs NK cell maturation from CD34+ HSCs.
CD34+ HSC precursors were isolated from apheresed peripheral blood and transfected with MCM10 CRISPR/Cas9-GFP. After 3 days of expansion, GFP+ or GFP cells were sorted and then cocultured with EL08.1D2 stromal cells in the presence of cytokines, including IL-15, as described in Methods. Cells were harvested at 28 days, and NK cell maturation was analyzed by FACS. (A) Representative histograms of CD16 expression as a marker of NK cell terminal maturation. (B) Relative frequency of cells according to defined stages of NK cell maturation: stage 1 (CD34+CD117CD94CD16); stage 2 (CD34+CD117+CD94CD16); stage 3 (CD34CD117+CD94CD16); stage 4 (CD34CD117+/−CD94+CD16); and stage 5 (CD34CD117CD94+/−CD16+) (45). Data are representative of 2 biological replicates.
Figure 9
Figure 9. iPS cell–derived NK cells from the proband have impaired terminal maturation and increased replication stress.
iPS cells reprogrammed from patient primary fibroblasts were differentiated by teratoma formation to CD34+ HSCs, purified, and transplanted into NSG mice as described in Methods. Organs were harvested 21 days following transplantation, and human CD45+CD56+CD3 cells were analyzed for density of CD56 expression. n = 4 mice per genotype (patient and healthy donor–derived iPS cells). (A) Representative FACS histograms of NK cells from bone marrow of mice reconstituted with human NK cells from healthy donor– or patient-derived CD34+ cells generated from iPS cells. (B) Frequency of CD56bright NK cells from 4 mice per genotype from blood, spleen, and bone marrow, as indicated. NK cells were identified as human CD45+CD56+CD3 (bone marrow: 93–979 NK cells; blood: 20–405 NK cells; spleen: 60–880 NK cells, all from >106 cells from each organ per mouse), and the frequency of CD56bright NK cells based on CD56 density within the human NK cell population is shown. *P < 0.05, Mann-Whitney U test. (C) Splenocytes from mice transplanted with HD or patient-specific iPS cell–derived CD34+ cells were fixed, permeabilized, and incubated with anti-γH2AX antibody. Images were acquired by confocal microscopy. Scale bar: 5 μm. (D) Frequency of γH2AX foci per cell were enumerated by manual counting of 109 (HD) and 119 (patient) cells. ****P < 0.0001, Mann-Whitney U test. Data were pooled from 4 mice per genotype and are represented as mean ± 95% CI.

References

    1. Orange JS. Human natural killer cell deficiencies. Curr Opin Allergy Clin Immunol. 2006;6(6):399–409. doi: 10.1097/ACI.0b013e3280106b65. - DOI - PubMed
    1. Orange JS. Natural killer cell deficiency. J Allergy Clin Immunol. 2013;132(3):515–525. doi: 10.1016/j.jaci.2013.07.020. - DOI - PMC - PubMed
    1. Ham H, Billadeau DD. Human immunodeficiency syndromes affecting human natural killer cell cytolytic activity. Front Immunol. 2014;5:2. - PMC - PubMed
    1. Voss M, Bryceson YT. Natural killer cell biology illuminated by primary immunodeficiency syndromes in humans. Clin Immunol. 2017;177:29–42. doi: 10.1016/j.clim.2015.11.004. - DOI - PubMed
    1. Gineau L, et al. Partial MCM4 deficiency in patients with growth retardation, adrenal insufficiency, and natural killer cell deficiency. J Clin Invest. 2012;122(3):821–832. doi: 10.1172/JCI61014. - DOI - PMC - PubMed

Publication types

MeSH terms

Substances