. 2021 Mar;70(3):633-656.
doi: 10.1007/s00262-020-02692-8. Epub 2020 Aug 31.

Anti-tumor and immune modulating activity of T cell induced tumor-targeting effectors (TITE)

Affiliations

Anti-tumor and immune modulating activity of T cell induced tumor-targeting effectors (TITE)

Archana Thakur et al. Cancer Immunol Immunother. 2021 Mar.

Abstract

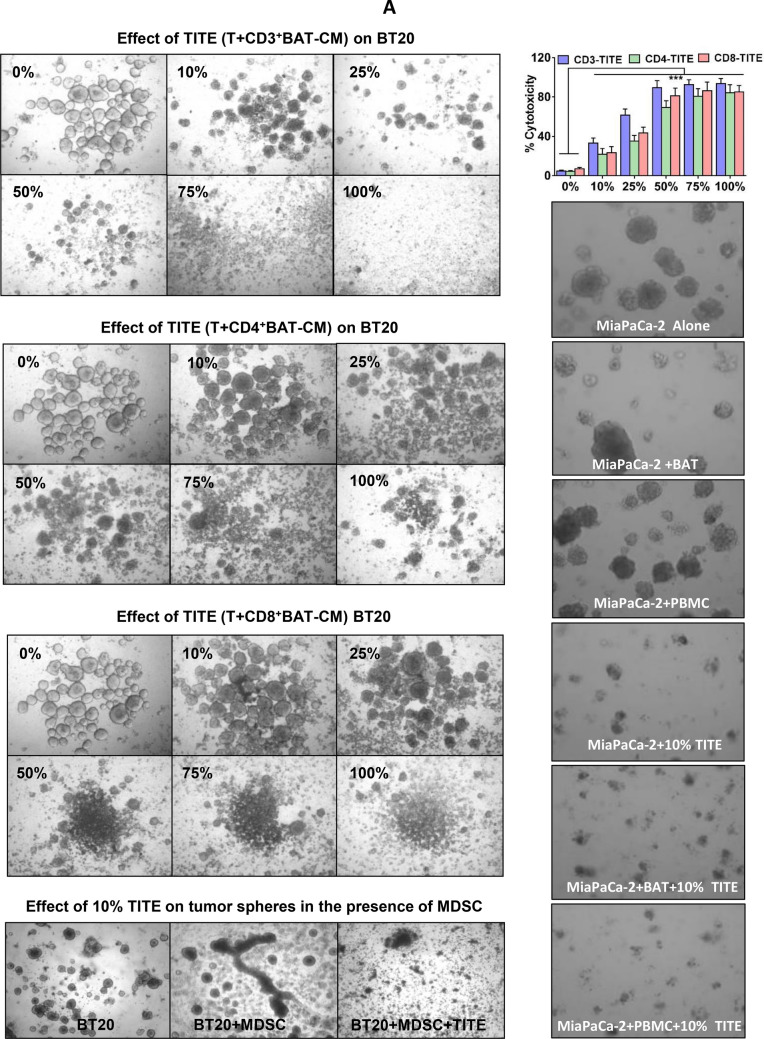
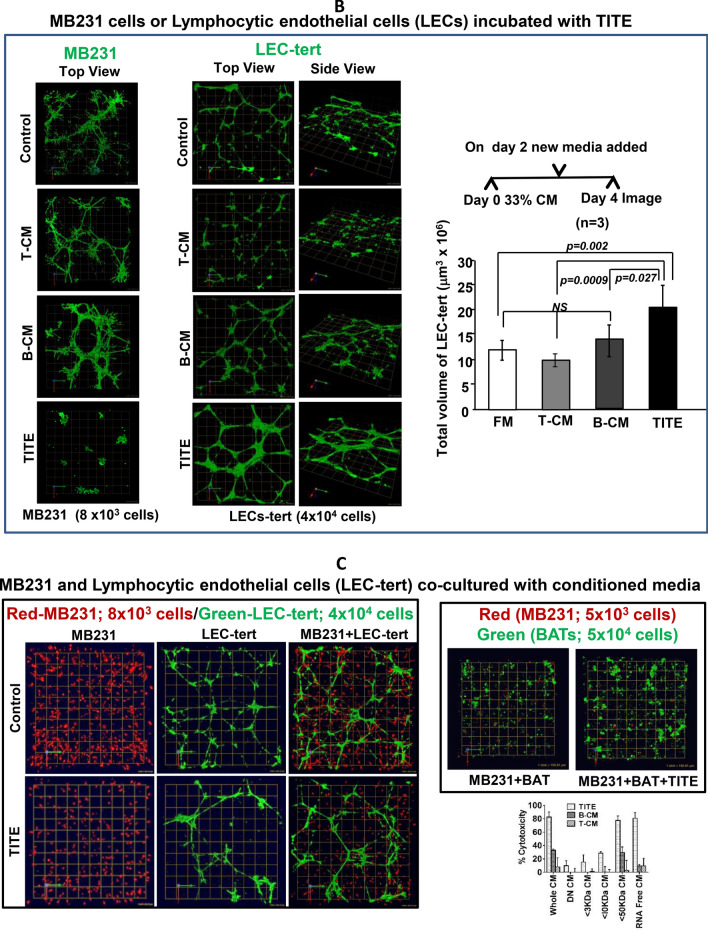
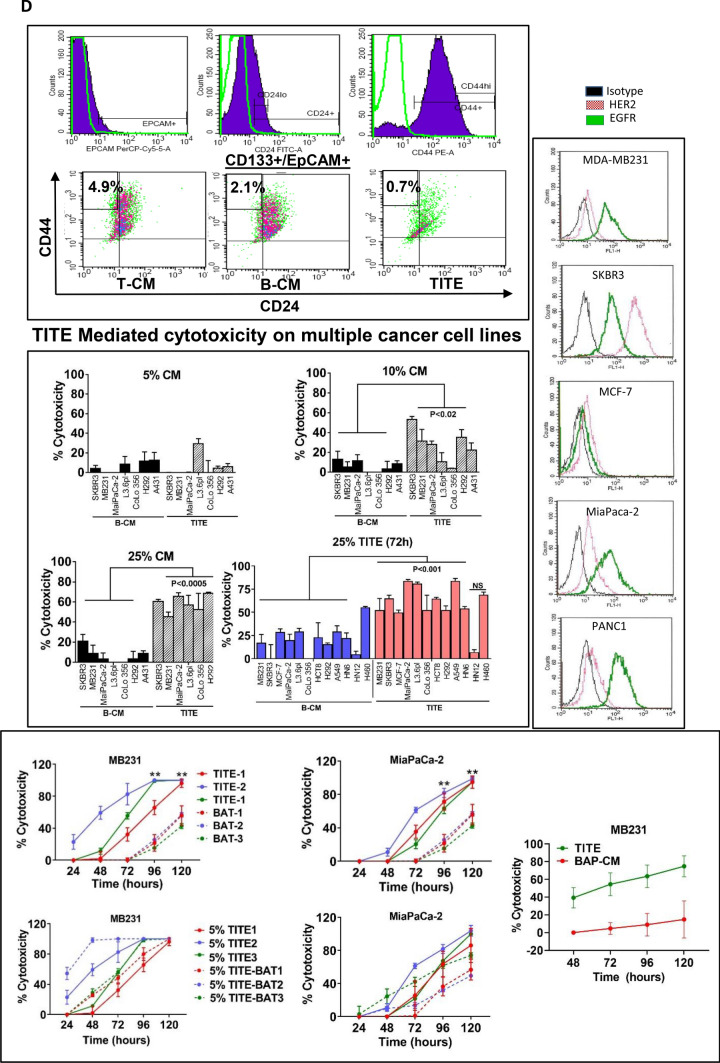
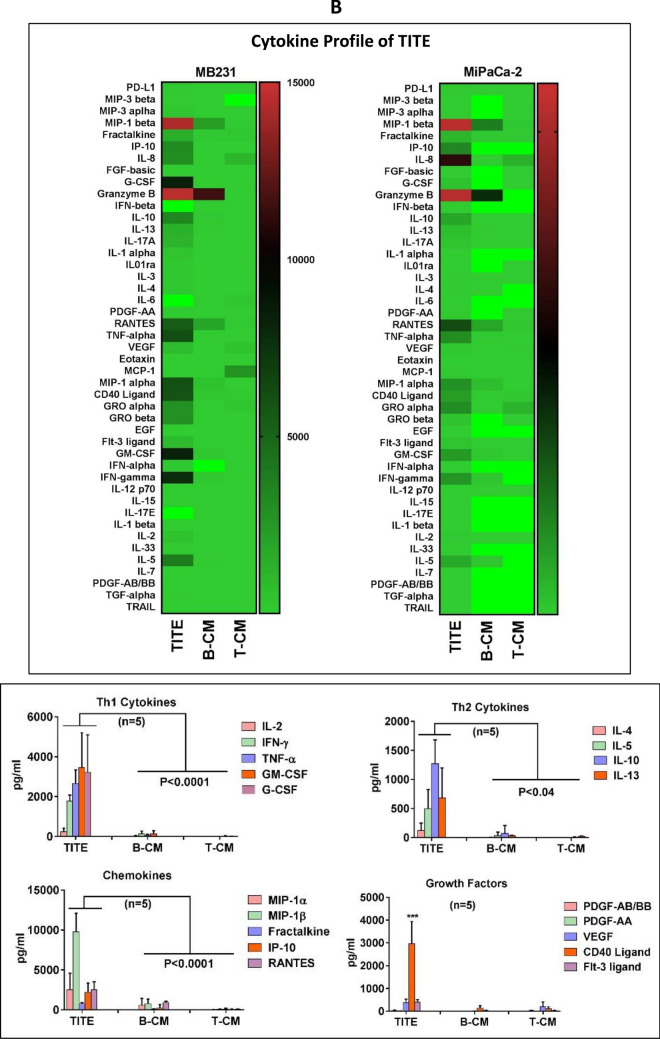
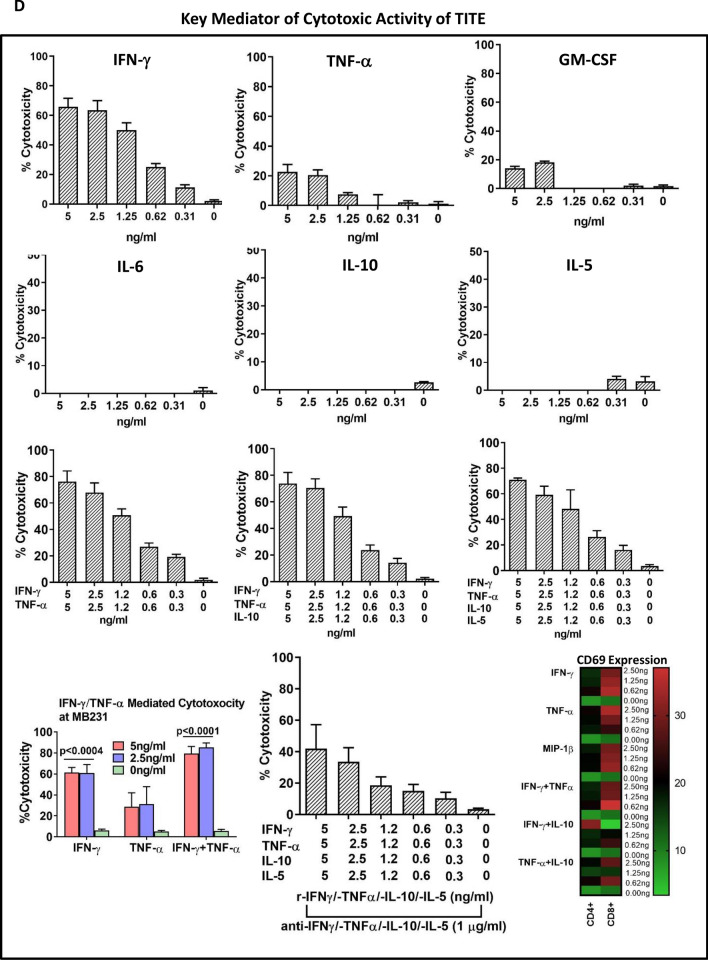
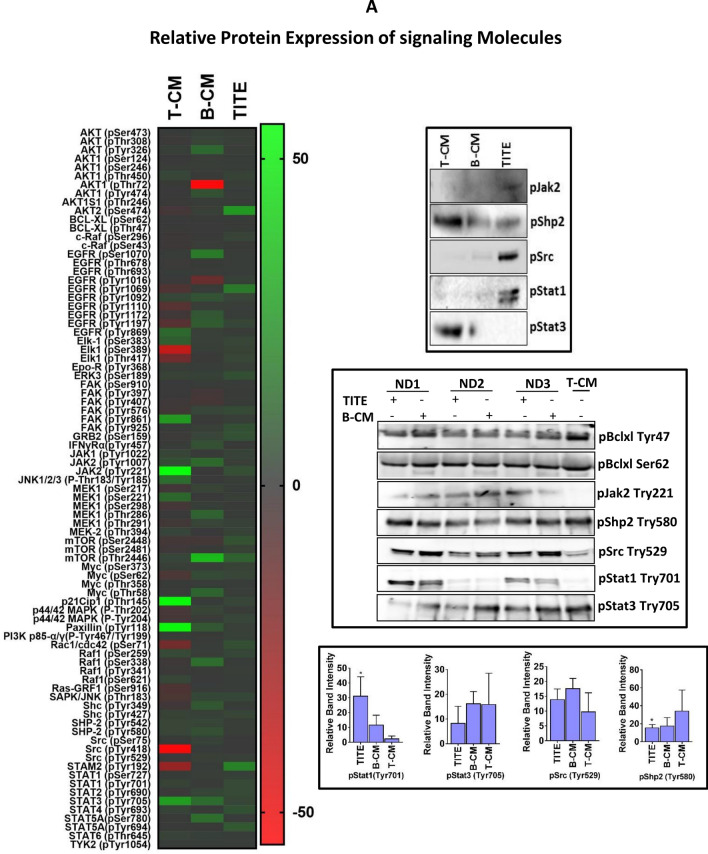
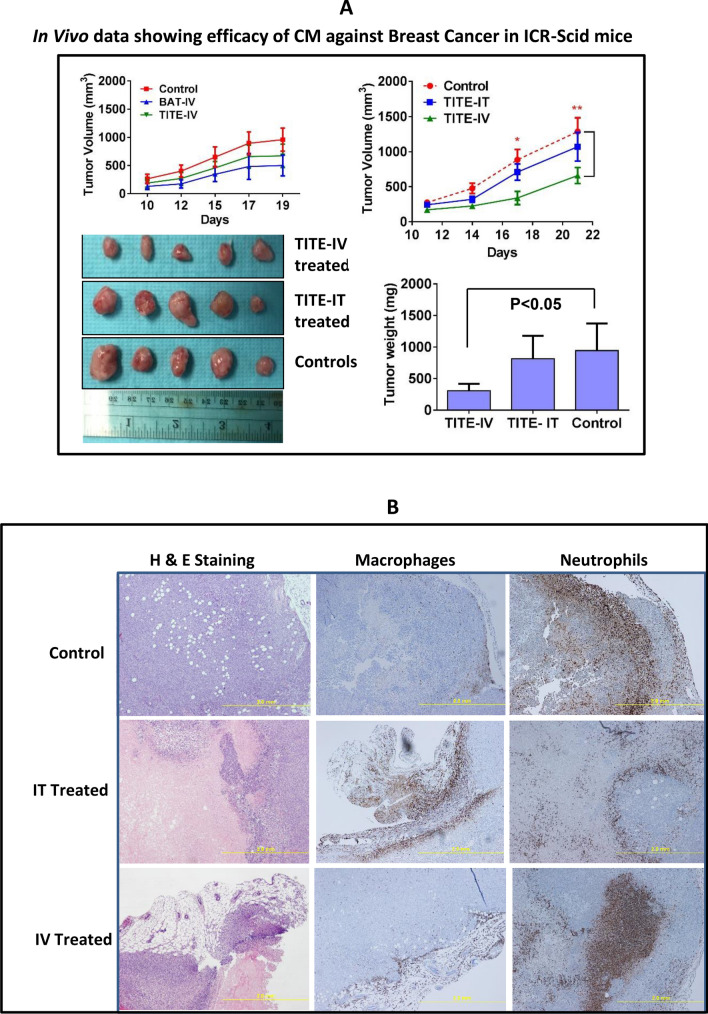
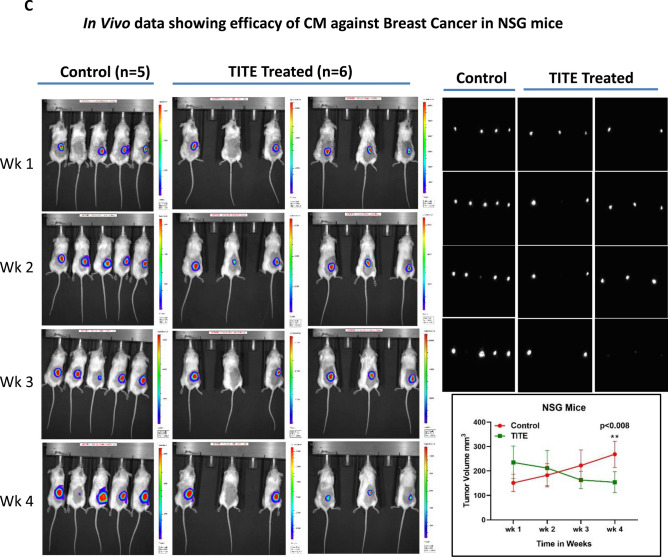
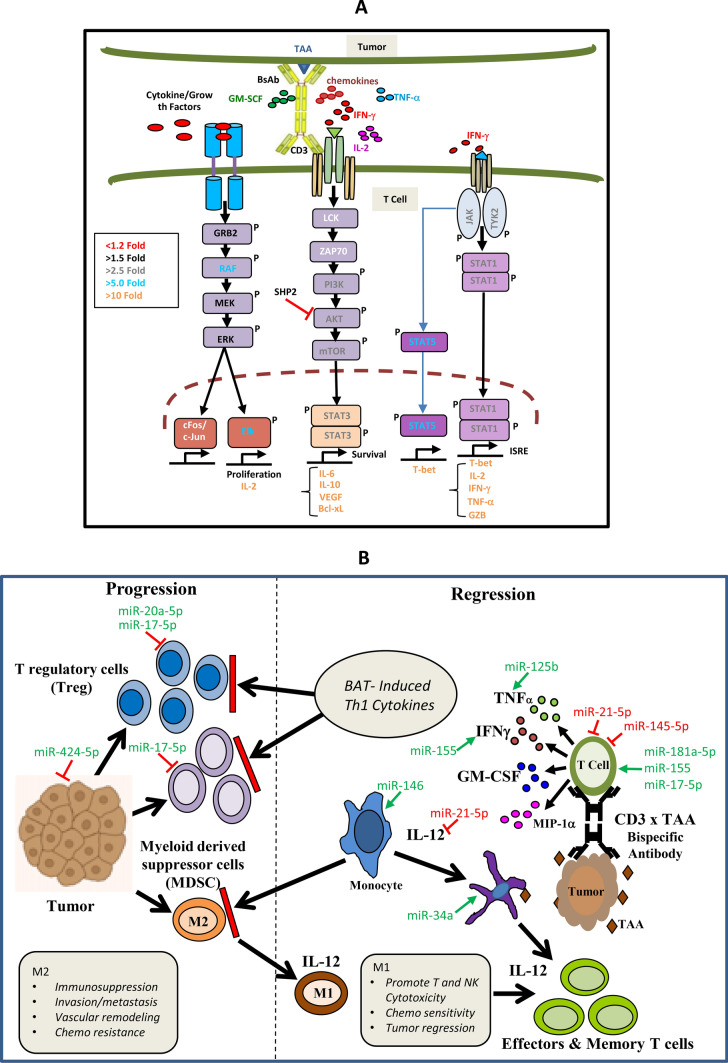
Adoptive transfer of Bispecific antibody Armed activated T cells (BATs) showed promising anti-tumor activity in clinical trials in solid tumors. The cytotoxic activity of BATs occurs upon engagement with tumor cells via the bispecific antibody (BiAb) bridge, which stimulates BATs to release cytotoxic molecules, cytokines, chemokines, and other signaling molecules extracellularly. We hypothesized that the release of BATs Induced Tumor-Targeting Effectors (TITE) by this complex interaction of T cells, bispecific antibody, and tumor cells may serve as a potent anti-tumor and immune-activating immunotherapeutic approach. In a 3D tumorsphere model, TITE showed potent cytotoxic activity against multiple breast cancer cell lines compared to control conditioned media (CM): Tumor-CM (T-CM), BATs-CM (B-CM), BiAb Armed PBMC-CM (BAP-CM) or PBMC-CM (P-CM). Multiplex cytokine analysis showed high levels of Th1 cytokines and chemokines; phospho-protein signaling array data suggest that the prominent JAK1/STAT1 pathway may be responsible for the induction and release of Th1 cytokines/chemokines in TITE. In xenograft breast cancer models, IV injections of 10× concentrated TITE (3×/week for 3 weeks; 150 μl TITE/injection) was able to inhibit tumor growth significantly (ICR/scid, p < 0.003; NSG p < 0.008) compared to the control mice. We tested the key components of the TITE for immune activating and anti-tumor activity individually and in combinations, the combination of IFN-γ, TNF-α and MIP-1β recapitulates the key activities of the TITE. In summary, master mix of active components of BATs-Tumor complex-derived TITE can provide a clinically controllable cell-free platform to target various tumor types regardless of the heterogeneous nature of the tumor cells and mutational tumor.

Keywords: 3D culture model; Activated T cells; Bispecific antibody; Breast cancer; Cancer stem cells; Myeloid-derived suppressor cells; Th1 cytokines.


Conflict of interest statement

AT is co-founder of Nova Immune Platform Inc.; LGL is co-founders of TransTarget, Inc; SVK, KJ, DLS, EB, JU, AA, EC and BFS have no conflict of interest. The data presented in this manuscript are original and have not been published elsewhere except in the form of abstracts and poster presentations at symposia and meetings.

Figures

Fig. 1
Fig. 1
a Effect of TITE on BT20 and MiaPaCa-2 cells. Representative images show cytotoxic activity at indicated dose levels (0–100%) of TITE against BT20 tumorspheres in 3D cultures after 5 days. TITE was prepared from CD3+, CD4+ and CD8+ T cell sub-populations: 1st left panel shows the cytotoxic activity of TITE prepared from CD3+ BATs + tumor, 2nd and 3rd left panel show the cytotoxic activity of TITE prepared from CD4+ BATs + Tumor, and CD8+ BATs + Tumor. The TITE prepared from unfractionated activated T cells (CD3+ cells) showed superior killing of tumorspheres (1st panel) compared to the TITE prepared from CD4+ or CD8+ T cell fractions; Bottom left panel shows the cytotoxicity against BT20 tumorspheres co-cultured with MDSC in the presence or absence of 25% TITE. Top right panel shows the cytotoxic activity of CD3-TITE, CD4-TITE and CD8-TITE at indicated dose levels; cytotoxic activity was highly significant (p < 0.0001; n = 6) at all dose levels compared to cultures without TITE (0%). Bottom right panel shows the cytotoxic activity against MiaPaCa-2 tumorspheres co-cultured with BATs or PBMC (at E/T 1:1) in the presence or absence of TITE for 5 days; incubation with 10% TITE shows noticeably higher cytotoxicity compared to MiaPaCa-2 + PBMC or MiaPaCa-2 + BATs without TITE. BATs bispecific antibody-armed T cells, TITE BAT cell induced tumor-targeting effectors, E/T effector to target ratio. b Confocal images of  MB231 cells or Lymphocytic endothelial cells (LECs) incubated with TITE. Representative confocal imaging shows growth inhibition of MB231 cells in 3D cultures in the presence of TITE compared to untreated control, T-CM or B-CM treated cells (Left panel); MB231 cells were plated on top of Cultrex (n = 5). Middle Panel shows top and side views of lymphatic endothelial cells (LEC)-tert, TITE shows enhanced nodal proliferation of LEC-tert. LEC-tert cells were plated on top of Cultrex, one grid represents 243.15 mm. Right panel shows that total volume of LEC-tert was increased significantly as indicated in the presence of TITE and B-CM compared to T-CM or untreated controls. c MB231 and Lymphocytic endothelial cells (LEC-tert) co-cultured with conditioned media show noticeably reduced growth of MB231 (red) and larger nodal junctions of LEC-tert (green) in a co-culture setting of MB231 and LEC-tert embedded into Cultrex, which is consistent with the observation when each is grown separately with TITE, suggesting a differential cell specific effect of TITE. One grid represents 243.15 mm. Top right panel shows enhanced proliferation of BATs when co-cultured with breast cancer cells (MB231) in the presence of TITE. Bottom right panel shows that cytotoxic activity is retain by soluble factor(s) with molecular weights between 10 and 50 kDa. d TITE Mediated cytotoxicity on multiple cancer cell lines. Top right panel shows the proportion of CD133+/ EpCAM+/CD44hi/CD24lo CSC were reduced to 0.7% in the presence of TITE compared to 4.9% in control culture without TITE or cultures containing B-CM (2.1%). Middle right panel shows the effect of TITE on multiple solid tumor cell lines at 5, 10 and 25% concentration. These findings were further confirmed in a larger panel of cancer cell lines (colored graph). At 10% and 25% concentration of TITE, highly significant cytotoxicity (p < 0.05 to p < 0.0005) was observed against MB231, MCF-7, SKBR3, MiaPaCa-2, L3.6pl, CoLo-356, HCT8, H292, A549, HN6 compared to B-CM at 72 h (n = 12). Left panel shows the relative expression of HER2 and EGFR in three breast cancer and two pancreatic cancer cell lines using anti-HER2 and anti-EGFR monoclonal antibodies by flow cytometry. Bottom panel shows the cytotoxicity by TITE and BATs against breast and pancreatic cancer cell lines (top graphs) using Real Time Cell Analysis (RTCA). Lower two graphs show enhanced cytotoxicity against MB231 and MiaPaCa-2 cells by BATs over 120 h after priming with TITE (n = 3). Far right graph shows the cytotoxicity at 25% concentration of TITE or BiAb Armed PBMC-CM (BAP-CM) against breast cell line MDA MB-231 at 48–120 h using Real Time Cell Analysis (RTCA)
Fig. 1
Fig. 1
a Effect of TITE on BT20 and MiaPaCa-2 cells. Representative images show cytotoxic activity at indicated dose levels (0–100%) of TITE against BT20 tumorspheres in 3D cultures after 5 days. TITE was prepared from CD3+, CD4+ and CD8+ T cell sub-populations: 1st left panel shows the cytotoxic activity of TITE prepared from CD3+ BATs + tumor, 2nd and 3rd left panel show the cytotoxic activity of TITE prepared from CD4+ BATs + Tumor, and CD8+ BATs + Tumor. The TITE prepared from unfractionated activated T cells (CD3+ cells) showed superior killing of tumorspheres (1st panel) compared to the TITE prepared from CD4+ or CD8+ T cell fractions; Bottom left panel shows the cytotoxicity against BT20 tumorspheres co-cultured with MDSC in the presence or absence of 25% TITE. Top right panel shows the cytotoxic activity of CD3-TITE, CD4-TITE and CD8-TITE at indicated dose levels; cytotoxic activity was highly significant (p < 0.0001; n = 6) at all dose levels compared to cultures without TITE (0%). Bottom right panel shows the cytotoxic activity against MiaPaCa-2 tumorspheres co-cultured with BATs or PBMC (at E/T 1:1) in the presence or absence of TITE for 5 days; incubation with 10% TITE shows noticeably higher cytotoxicity compared to MiaPaCa-2 + PBMC or MiaPaCa-2 + BATs without TITE. BATs bispecific antibody-armed T cells, TITE BAT cell induced tumor-targeting effectors, E/T effector to target ratio. b Confocal images of  MB231 cells or Lymphocytic endothelial cells (LECs) incubated with TITE. Representative confocal imaging shows growth inhibition of MB231 cells in 3D cultures in the presence of TITE compared to untreated control, T-CM or B-CM treated cells (Left panel); MB231 cells were plated on top of Cultrex (n = 5). Middle Panel shows top and side views of lymphatic endothelial cells (LEC)-tert, TITE shows enhanced nodal proliferation of LEC-tert. LEC-tert cells were plated on top of Cultrex, one grid represents 243.15 mm. Right panel shows that total volume of LEC-tert was increased significantly as indicated in the presence of TITE and B-CM compared to T-CM or untreated controls. c MB231 and Lymphocytic endothelial cells (LEC-tert) co-cultured with conditioned media show noticeably reduced growth of MB231 (red) and larger nodal junctions of LEC-tert (green) in a co-culture setting of MB231 and LEC-tert embedded into Cultrex, which is consistent with the observation when each is grown separately with TITE, suggesting a differential cell specific effect of TITE. One grid represents 243.15 mm. Top right panel shows enhanced proliferation of BATs when co-cultured with breast cancer cells (MB231) in the presence of TITE. Bottom right panel shows that cytotoxic activity is retain by soluble factor(s) with molecular weights between 10 and 50 kDa. d TITE Mediated cytotoxicity on multiple cancer cell lines. Top right panel shows the proportion of CD133+/ EpCAM+/CD44hi/CD24lo CSC were reduced to 0.7% in the presence of TITE compared to 4.9% in control culture without TITE or cultures containing B-CM (2.1%). Middle right panel shows the effect of TITE on multiple solid tumor cell lines at 5, 10 and 25% concentration. These findings were further confirmed in a larger panel of cancer cell lines (colored graph). At 10% and 25% concentration of TITE, highly significant cytotoxicity (p < 0.05 to p < 0.0005) was observed against MB231, MCF-7, SKBR3, MiaPaCa-2, L3.6pl, CoLo-356, HCT8, H292, A549, HN6 compared to B-CM at 72 h (n = 12). Left panel shows the relative expression of HER2 and EGFR in three breast cancer and two pancreatic cancer cell lines using anti-HER2 and anti-EGFR monoclonal antibodies by flow cytometry. Bottom panel shows the cytotoxicity by TITE and BATs against breast and pancreatic cancer cell lines (top graphs) using Real Time Cell Analysis (RTCA). Lower two graphs show enhanced cytotoxicity against MB231 and MiaPaCa-2 cells by BATs over 120 h after priming with TITE (n = 3). Far right graph shows the cytotoxicity at 25% concentration of TITE or BiAb Armed PBMC-CM (BAP-CM) against breast cell line MDA MB-231 at 48–120 h using Real Time Cell Analysis (RTCA)
Fig. 2
Fig. 2
T cell Activation by TITE. Immune cell modulation by TITE. a Normal donor PBMC (n = 3) incubated with 10% B-CM or 10% TITE show significant activation of T cells (CD4+/CD69+, p < 0.0004 and CD8+/CD69+, p < 0.0001) compared to untreated PBMC (left panel). The top right panel shows that normal donor PBMC when incubated with MB231 tumor cells also show significantly activated CD4+/CD69+ and CD8+/CD69+ T cells in the presence of TITE (p < 0.0001) or B-CM (p < 0.005), and significant reduction in both CD33+/HLA-DR MDSC (p < 0.004) and CD4+/CD25+/CD127lo Treg cells (p < 0.003) in the presence of TITE. Bottom Panel) Shows the expression of co-stimulatory (4-1BB, ICOS and OX40) or co-inhibitory (PD-1) markers on CD4+ (top panel) and CD8+ T cells (lower panel) in the co-cultures of PBMC with tumor cells either MB231 (left) or MCF-7 (right) for 48 h with various percentages of TITE (n = 3). Both co-stimulatory (4-1BB, ICOS and OX40) or co-inhibitory (PD-1) molecules showed significantly increased expression in the presence of all dose levels of TITE (MB231, p < 0.0002; MCF-7, p < 0.003 to p < 0.0002). b Cytokine Profile of TITE. Shows the quantitative cytokine profiles of TITE and control CM (T-CM and B-CM) using 45-panel Luminex multiplex technology (n = 5). Heat maps show the representative profiles of TITE, B-CM and T-CM. Left panel shows the profile of TITE prepared from MB231 + BATs, and right panel shows the heat map of TITE prepared from MiaPaCa-2 + BATs. Lower panel shows the quantitative data. TITE show the significant increase in Th1 cytokines (p < 0.0001), Th2 cytokines (p < 0.04), chemokines (p < 0.0001) and growth factor CD40L (p < 0.0001) compared to B-CM and T-CM; all values are presented as pg/ml. c. Cytokine Profile of TITE from Multiple Cell Lines. Shows individual Th1 cytokines, Th2 cytokines and chemokines levels as dot plots of TITEs prepared from five normal donor HER2 BATs and EGFR BATs co-cultured with four different cell lines, altogether representing 40 conditions for each cytokine. In all 40 conditions, Th1 cytokines (IFN-γ, TNF-α and GM-CSF) were significantly higher, p value ranging from p < 0.005 to p < 0.0002; consistently increased levels were also found for IL-10 (p < 0.05 to p < 0.0005) compared to B-CM. Similarly, the T cell recruiting chemokines showed significantly increased levels (p < 0.05 to p < 0.0005) across all cell lines and different TITEs compared to B-CM. d Key Mediator of Anti-Tumor and Immune Stimulating Activity of TITE. Representative data on dose titration for the cytotoxic effects of key cytokines individually or in combinations (IFN-γ, TNF-α, GM-CSF, IL-5, IL-10 and IL-6) is shown in top and two middle panels against MB231 cell line. Bottom panel shows significantly increased cytotoxicity by IFN-γ alone (p < 0.0004) or in combination with TNF-α (p < 0.0001) at 2.5 and 5 ng/ml concentrations compared to untreated control (0 ng/ml), middle graph of the bottom panel shows the effect of neutralizing antibodies to their corresponding cytokine on cytotoxicity. IL-6 and GM-CSF both showed no cytotoxic effects. The heat map shows the CD69 expression by flow cytometry following overnight incubation with IFN-γ, TNF-α, MIP-1β, IL-5 and IL-10 individually or combination of IFN-γ + TNF-α and IFN-γ + IL-10 and TNF-α, IL-10 at the indicated concentrations (d, bottom panel)
Fig. 2
Fig. 2
T cell Activation by TITE. Immune cell modulation by TITE. a Normal donor PBMC (n = 3) incubated with 10% B-CM or 10% TITE show significant activation of T cells (CD4+/CD69+, p < 0.0004 and CD8+/CD69+, p < 0.0001) compared to untreated PBMC (left panel). The top right panel shows that normal donor PBMC when incubated with MB231 tumor cells also show significantly activated CD4+/CD69+ and CD8+/CD69+ T cells in the presence of TITE (p < 0.0001) or B-CM (p < 0.005), and significant reduction in both CD33+/HLA-DR MDSC (p < 0.004) and CD4+/CD25+/CD127lo Treg cells (p < 0.003) in the presence of TITE. Bottom Panel) Shows the expression of co-stimulatory (4-1BB, ICOS and OX40) or co-inhibitory (PD-1) markers on CD4+ (top panel) and CD8+ T cells (lower panel) in the co-cultures of PBMC with tumor cells either MB231 (left) or MCF-7 (right) for 48 h with various percentages of TITE (n = 3). Both co-stimulatory (4-1BB, ICOS and OX40) or co-inhibitory (PD-1) molecules showed significantly increased expression in the presence of all dose levels of TITE (MB231, p < 0.0002; MCF-7, p < 0.003 to p < 0.0002). b Cytokine Profile of TITE. Shows the quantitative cytokine profiles of TITE and control CM (T-CM and B-CM) using 45-panel Luminex multiplex technology (n = 5). Heat maps show the representative profiles of TITE, B-CM and T-CM. Left panel shows the profile of TITE prepared from MB231 + BATs, and right panel shows the heat map of TITE prepared from MiaPaCa-2 + BATs. Lower panel shows the quantitative data. TITE show the significant increase in Th1 cytokines (p < 0.0001), Th2 cytokines (p < 0.04), chemokines (p < 0.0001) and growth factor CD40L (p < 0.0001) compared to B-CM and T-CM; all values are presented as pg/ml. c. Cytokine Profile of TITE from Multiple Cell Lines. Shows individual Th1 cytokines, Th2 cytokines and chemokines levels as dot plots of TITEs prepared from five normal donor HER2 BATs and EGFR BATs co-cultured with four different cell lines, altogether representing 40 conditions for each cytokine. In all 40 conditions, Th1 cytokines (IFN-γ, TNF-α and GM-CSF) were significantly higher, p value ranging from p < 0.005 to p < 0.0002; consistently increased levels were also found for IL-10 (p < 0.05 to p < 0.0005) compared to B-CM. Similarly, the T cell recruiting chemokines showed significantly increased levels (p < 0.05 to p < 0.0005) across all cell lines and different TITEs compared to B-CM. d Key Mediator of Anti-Tumor and Immune Stimulating Activity of TITE. Representative data on dose titration for the cytotoxic effects of key cytokines individually or in combinations (IFN-γ, TNF-α, GM-CSF, IL-5, IL-10 and IL-6) is shown in top and two middle panels against MB231 cell line. Bottom panel shows significantly increased cytotoxicity by IFN-γ alone (p < 0.0004) or in combination with TNF-α (p < 0.0001) at 2.5 and 5 ng/ml concentrations compared to untreated control (0 ng/ml), middle graph of the bottom panel shows the effect of neutralizing antibodies to their corresponding cytokine on cytotoxicity. IL-6 and GM-CSF both showed no cytotoxic effects. The heat map shows the CD69 expression by flow cytometry following overnight incubation with IFN-γ, TNF-α, MIP-1β, IL-5 and IL-10 individually or combination of IFN-γ + TNF-α and IFN-γ + IL-10 and TNF-α, IL-10 at the indicated concentrations (d, bottom panel)
Fig. 3
Fig. 3
Relative Protein Expression of Signaling Molecules. a Left panel shows the representative heat map of signaling array of TITE and controls (T-CM and B-CM), data is presented as relative fold-changes in TITE, T-CM and B-CM compared to internal control GAPDH. Top right panel shows the validation of selected phospho-signaling proteins by western blot of the same sample shown in the heat map. Middle right panel shows the western blot of selected phospho-signaling proteins in three different TITEs, B-CM and T-CM; Bottom right panel shows the measurement of relative band intensities; a significantly higher expression of pSTAT1 (tyr701) (p < 0.04) and significantly lower expression of pSHP-2 (tyr580) (p < 0.05) is displayed as asterisks. b Relative Expression of MicroRNA. The representative heat map (left panel) shows the normalized miRNA array data of TITE and control CMs (T-CM and B-CM). Right heat map shows an average fold-change in exosomal miRNA isolated from B-CM and TITE relative to T-CM prepared from three normal donor BATs and MB231 cell line. Lower right panel shows the fold regulation of some selected up- or down-regulated miRNAs in TITE and B-CM relative to T-CM. c Fold Change in miRNA. Shows the validation of miR-93, miR-155, miR-21, miR-let-7, miR-34a, miR-15a, miR-150 and miR-145a by qRT-PCR; data are presented as fold expression relative to T-CM
Fig. 3
Fig. 3
Relative Protein Expression of Signaling Molecules. a Left panel shows the representative heat map of signaling array of TITE and controls (T-CM and B-CM), data is presented as relative fold-changes in TITE, T-CM and B-CM compared to internal control GAPDH. Top right panel shows the validation of selected phospho-signaling proteins by western blot of the same sample shown in the heat map. Middle right panel shows the western blot of selected phospho-signaling proteins in three different TITEs, B-CM and T-CM; Bottom right panel shows the measurement of relative band intensities; a significantly higher expression of pSTAT1 (tyr701) (p < 0.04) and significantly lower expression of pSHP-2 (tyr580) (p < 0.05) is displayed as asterisks. b Relative Expression of MicroRNA. The representative heat map (left panel) shows the normalized miRNA array data of TITE and control CMs (T-CM and B-CM). Right heat map shows an average fold-change in exosomal miRNA isolated from B-CM and TITE relative to T-CM prepared from three normal donor BATs and MB231 cell line. Lower right panel shows the fold regulation of some selected up- or down-regulated miRNAs in TITE and B-CM relative to T-CM. c Fold Change in miRNA. Shows the validation of miR-93, miR-155, miR-21, miR-let-7, miR-34a, miR-15a, miR-150 and miR-145a by qRT-PCR; data are presented as fold expression relative to T-CM
Fig. 4
Fig. 4
a In Vivo Data Showing Efficacy of CM Against Breast Cancer. The MB231 breast cancer cell line was injected into the flanks of ICR-SCID mice (n = 5/group), a representative data from one experiment is shown. Tumor-bearing mice were treated with IV injections of BATs, TITE and vehicle 2 ×/week for 3 weeks (top left). Top right, tumor-bearing mice treated with IV vs. IT injections of TITE and vehicle 3 ×/week for 3 weeks show significant delay in tumor volume (p < 0.003) as well as tumor size (p < 0.05) in lower right panel, a representative data from one experiment is shown (n = 6). Lower left panel shows the gross tumor appearance (scale bar = 1 inch). b H&E and IHC Staining of TITE Treated and Untreated Murine Tumors. Shows representative tumor sections from control mice, mice treated with TITE-intratumorally (IT) or mice treated with TITE-intravenously (IV) stained for myeloperoxidase (for granulocytes) and F4/80 (for macrophages). Representative H&E staining in xenograft tumors (scale bar = 2 mm) treated with TITE-IV, TITE-IT and vehicle-IV are shown in the left panel. Staining for macrophages and neutrophils are shown in the middle and right panels. c Both bioluminescence images of NSG mice (Left panel) and tumors (Right panel), show reduced tumor growth in TITE treated mice. Tumor measurements (Lower right panel) show significantly reduced (p < 0.008) in tumor volume in TITE treated mice after 4 weeks compared to vehicle injected control mice (control group, n = 5; TITE treated group, n = 6)
Fig. 4
Fig. 4
a In Vivo Data Showing Efficacy of CM Against Breast Cancer. The MB231 breast cancer cell line was injected into the flanks of ICR-SCID mice (n = 5/group), a representative data from one experiment is shown. Tumor-bearing mice were treated with IV injections of BATs, TITE and vehicle 2 ×/week for 3 weeks (top left). Top right, tumor-bearing mice treated with IV vs. IT injections of TITE and vehicle 3 ×/week for 3 weeks show significant delay in tumor volume (p < 0.003) as well as tumor size (p < 0.05) in lower right panel, a representative data from one experiment is shown (n = 6). Lower left panel shows the gross tumor appearance (scale bar = 1 inch). b H&E and IHC Staining of TITE Treated and Untreated Murine Tumors. Shows representative tumor sections from control mice, mice treated with TITE-intratumorally (IT) or mice treated with TITE-intravenously (IV) stained for myeloperoxidase (for granulocytes) and F4/80 (for macrophages). Representative H&E staining in xenograft tumors (scale bar = 2 mm) treated with TITE-IV, TITE-IT and vehicle-IV are shown in the left panel. Staining for macrophages and neutrophils are shown in the middle and right panels. c Both bioluminescence images of NSG mice (Left panel) and tumors (Right panel), show reduced tumor growth in TITE treated mice. Tumor measurements (Lower right panel) show significantly reduced (p < 0.008) in tumor volume in TITE treated mice after 4 weeks compared to vehicle injected control mice (control group, n = 5; TITE treated group, n = 6)
Fig. 5
Fig. 5
a Shows the proposed intracellular signalining by BATs + tumor cell generated TITE. b Shows the mechanism of action of TITE in TME immune modulation, anti-tumor activity and likely generation of in situ immunization at the cellular and humoral level through cytokines/chemokines and microRNA. TAA tumor associated antigen; TME tumor microenvironment. BATs bispecific antibody-armed T cells, TITE BAT cell induced tumor-targeting effectors

Similar articles

Cited by

References

    1. Lum LG, et al. Targeted T-cell therapy in stage IV breast cancer: a phase I clinical trial. Clin Cancer Res. 2015;21(10):2305–2314. doi: 10.1158/1078-0432.CCR-14-2280. - DOI - PMC - PubMed
    1. Vaishampayan U, et al. Phase I study of anti-CD3 × anti-Her2 bispecific antibody in metastatic castrate resistant prostate cancer patients. Prostate Cancer. 2015;2015:285193. doi: 10.1155/2015/285193. - DOI - PMC - PubMed
    1. Thakur A, et al. Immune T cells can transfer and boost anti-breast cancer immunity. Oncoimmunology. 2018;7(12):e1500672. doi: 10.1080/2162402X.2018.1500672. - DOI - PMC - PubMed
    1. Thakur A, Lum LG. In Situ immunization by bispecific antibody targeted T cell therapy in breast cancer. Oncoimmunology. 2016;5(3):e1055061. doi: 10.1080/2162402X.2015.1055061. - DOI - PMC - PubMed
    1. Sen M, et al. Use of anti-CD3 × anti-HER2/neu bispecific antibody for redirecting cytotoxicity of activated T cells toward HER2/neu+ tumors. J Hematother Stem Cell Res. 2001;10(2):247–260. doi: 10.1089/15258160151134944. - DOI - PubMed

MeSH terms