. 2020 Dec;8(4):568-583.
doi: 10.1002/iid3.342. Epub 2020 Aug 31.

HPO iron chelator, CP655, causes the G1/S phase cell cycle block via p21 upregulation

Affiliations

HPO iron chelator, CP655, causes the G1/S phase cell cycle block via p21 upregulation

Damini Tewari et al. Immun Inflamm Dis. 2020 Dec.

Abstract

Iron is known not only for its importance in cellular and metabolic pathways but also for its role in causing cellular toxicities such as production of reactive oxygen species and growth of pathogens. The inability of the human body to physiologically excrete excess iron highlights the need to develop a cheap yet effective iron chelator. This study provides initial evidence of the therapeutic and prophylactic properties of 3-hydroxypyridin-4-one (HPO) chelators in murine collagen-induced arthritis. To determine whether these chelators would be effective on human cells, we tested a panel of different HPO chelators and identified 7-diethylamino-N-((5-hydroxy-6-methyl-4-oxo-1,4-dihydropyridin-3-yl)methyl)-N-methyl-2-oxo-chromen-3-carboxamide (CP655) as the most effective compound targeting human CD4+ T cells. Treatment with CP655 causes significant inhibition of cell proliferation and production of inflammatory cytokines such as interferon-γ and interleukin-17. Microarray analysis revealed dysregulation in cell cycle-related genes following CP655 treatment. This was validated by flow cytometry demonstrating a G1/S phase block caused by CP655. Finally, mechanistic experiments revealed that the chelator may be causing an upregulation of the cell cycle inhibitor protein CDKN1A (p21) as a possible mechanism of action. In conclusion, this study demonstrates that HPO chelators could prove to have therapeutic potential for diseases driven by excessive T cell proliferation.

Keywords: CP655; HPO chelators; T cell proliferation; cell cycle; iron chelation; iron metabolism; p21.


Conflict of interest statement

The authors declare that there are no conflict of interests.

Figures
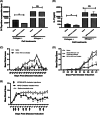
Figure 1
Figure 1
In vitro, prophylactic and therapeutic effect of iron chelation on collagen‐induced arthritis. Mice sensitized to type II collagen were killed 10 days later and spleens and lymph node cell suspensions were restimulated in vitro with type II collagen or Con A, alone or in the presence of 3‐hydroxypyridin‐4‐one (HPO) iron chelator CP28. Proliferation and interleukin‐17 production are shown in (A) and (B), respectively, n = 12. Prophylactic studies were carried out as detailed in the methods section. Briefly, prophylactic intraperitoneal (ip) injections of HPO iron chelator CP28 (C) and SF34 (D) or control compounds, either saline (C) and (D) or noniron‐chelating analog SF36 (D) were given at days −1, 0, and 1, and then twice weekly for 2 weeks. Disease was induced on day 0. Clinical symptoms were scored from day 20, three times a week until the end of the trial (5‐7 mice per treatment group). Therapeutic studies with CP28 were carried out by inducing disease at day 0 (as above) but delaying CP28 ip treatment until mice first demonstrated symptoms of arthritis. Treatment was repeated twice a week until the end of the trial. For (A) and (B), statistical test was a paired t test (*P < .05). Error bars denote standard error of the mean (SEM) of duplicate samples. For (C), (D), and (E), data represented as mean ± SEM. n = 7 for each group, *P < .05, **P < .01, and ***P < .001 calculated using Wilcoxon nonparametric test
Figure 2
Figure 2
CP655 (7‐diethylamino‐N‐((5‐hydroxy‐6‐methyl‐4‐oxo‐1,4‐dihydropyridin‐3‐yl)methyl)‐N‐methyl‐2‐oxo‐chromen‐3‐carboxamide) inhibits T cell proliferation and cytokine production. CD4+ (T cells) and CD14+ (monocytes) cells were isolated from fresh blood of healthy donors. Cells were mixed in a ratio of 2:1 (T cells: Monocytes), stimulated with tetanus toxoid and treated with or without CP655 (5 µM). After 6 days of incubation, cells were removed for measuring proliferation and the remaining cells were stimulated with 750 ng/mL Ionomycin and 50 ng/mL PMA for 4 hours. Proliferation was measured by incorporation of 3H‐thymidine (A). Cytokines were measured by enzyme‐linked immunosorbent assay (B, C). Each symbol represents an individual donor n = 8 to 10. *P < .05 calculated using Wilcoxon nonparametric matched‐pairs test
Figure 3
Figure 3
CP655 (7‐diethylamino‐N‐((5‐hydroxy‐6‐methyl‐4‐oxo‐1,4‐dihydropyridin‐3‐yl)methyl)‐N‐methyl‐2‐oxo‐chromen‐3‐carboxamide) effect on CD4+ T cell proliferation is iron‐dependent. CD4+ (T cells) and CD14+ (monocytes) cells were isolated from fresh blood of healthy donors. Cells were mixed in a ratio of 2:1 (T cells:monocytes), stimulated with tetanus toxoid, and treated with or without CP655 (5 μM) or the control compound CP655Ome (5 μM). Proliferation was measured by incorporation of 3H‐thymidine. Data represented as mean + standard error of the mean from n = 3 individual donors. **P < .01 between cultures with absence and presence of CP655 or CP655OMe calculated using the unpaired t test
Figure 4
Figure 4
CP655 (7‐diethylamino‐N‐((5‐hydroxy‐6‐methyl‐4‐oxo‐1,4‐dihydropyridin‐3‐yl)methyl)‐N‐methyl‐2‐oxo‐chromen‐3‐carboxamide) targets CD4+ T cells. A, CD4+ (T cells), and CD14+ (monocytes) cells were isolated from blood of healthy donors. Cells were incubated separately with or without CP655 or CP655OMe for 24 hours. The cells were washed and mixed in different combinations and stimulated with tetanus toxoid. Proliferation was measured by incorporation of 3H‐thymidine. Each symbol represents an individual donor n = 3 to 8. Dotted line represents control cultures where both CD4+ and CD14+ cells were untreated. Results expressed as a percentage of the control. *P < .05 calculated using the Mann‐Whitney test. B, CD4+ cells were isolated from fresh blood of healthy donors. Cells were stimulated with anti‐CD3/CD28 beads at the indicated ratios in the presence of 5 μM CP655 or 5 μM CP655OMe for 24 hours. Proliferation was measured by incorporation of 3H‐thymidine. Results represented as mean + standard error of the mean from n = 5 individual donors. **P < .01 and *P < .05 calculated using the Holm‐Sidak t test
Figure 5
Figure 5
Microarray analysis of CD4+ cells treated with CP655 (7‐diethylamino‐N‐((5‐hydroxy‐6‐methyl‐4‐oxo‐1,4‐dihydropyridin‐3‐yl)methyl)‐N‐methyl‐2‐oxo‐chromen‐3‐carboxamide) vs CP655OMe. Cells from five individual donors were either left unstimulated or stimulated with anti‐CD3/CD28 beads and left untreated or treated with either CP655 or CP655OMe for 18 hours. Extracted messenger RNA was used for microarray hybridization and analysis. A, Proliferation of CD4+ T‐cell samples used for microarray. CD4+ T cells were isolated from peripheral blood mononuclear cells of healthy donors. Cells were stimulated with either anti‐CD3/CD28 beads (1:20) and left untreated or treated with either CP655 (5 µM) or the control CP655OMe (5 µM) for 18 hours. Proliferation was measured by 3H‐thymidine incorporation. *P < .05 calculated using the paired t test. Data represented as mean ± standard error of the mean from n = 5 individual donors. B, Heat map prepared by GeneSpring Software shows hierarchical clustering using Pearson correlation. Each row represents results from an individual microarray chip (n = 15) showing three treatment conditions for each of the five donors. Each column represents an individual gene. Genes have been clustered according to similarities in patterns of expression as shown by the horizontal axis, as well as, by treatment condition in the vertical axis. Treatment conditions are color‐coded with red showing CP655‐treated cells, Orange bar showing CP655OMe‐treated and yellow showing untreated cells. Difference in expression level can be distinguished on the heat map based on color with high expression genes in red, intermediate expression in black and low expression genes in blue. C, Pi‐chart illustrating the most differentially modulated cellular pathways between CP655 and CP655OMe treatments. GO‐ontology software was used to determine pathways to which most of the differentially modulated genes belonged
Figure 6
Figure 6
Cell cycle arrest of CD4+ T cells following CP655 (7‐diethylamino‐N‐((5‐hydroxy‐6‐methyl‐4‐oxo‐1,4‐dihydropyridin‐3‐yl)methyl)‐N‐methyl‐2‐oxo‐chromen‐3‐carboxamide) treatment. CD4+ T cells were isolated from fresh peripheral blood mononuclear cells of healthy donors. Cells were either left unstimulated or stimulated with 1:5 bead:cells ratio of anti‐CD3/CD28 beads in the presence or absence of either CP655 (5 µM) or CP655OMe (5 µM) for 48 hours. Cells were lysed with cold 100% ethanol and stained with propidium iodide and ribonuclease A, before analysis by flow cytometry. A, Representative Fluorescence‐activated cell sorting results from one experiment. B, Cumulative data showing cell cycle arrest of CD4+ T cells from n = 4 donor. Results shown as mean ± standard error of the means. *P < .05 calculated using the paired t test
Figure 7
Figure 7
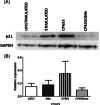
Effect of CP655 (7‐diethylamino‐N‐((5‐hydroxy‐6‐methyl‐4‐oxo‐1,4‐dihydropyridin‐3‐yl)methyl)‐N‐methyl‐2‐oxo‐chromen‐3‐carboxamide) treatment on p21 protein expression in CD4+ T cells. CD4+ T cells were isolated from peripheral blood mononuclear cells of healthy donors and either left unstimulated (USUT) or stimulated with anti‐CD3/CD28 beads (1:20) in the presence or absence of either CP655 (5 µM) or CP655OMe (5 µM). After 4 hours of culture, p21 expression was analyzed by Western blot analysis. A, Results from one representative experiment. B, Results represented as mean ± standard error of the mean from n = 4 individual donors

Similar articles

Cited by

References

    1. Abbaspour N, Hurrell R, Kelishadi R. Review on iron and its importance for human health. J Med Sci. 2014;19(2):164‐174. - PMC - PubMed
    1. Puig S, Ramos‐Alonso L, Romero AM, Martínez‐Pastor MT. The elemental role of iron in DNA synthesis and repair. Metallomics. 2017;9(11):1483‐1500. - PubMed
    1. Cao LL, Liu H, Yue Z, et al. Iron chelation inhibits cancer cell growth and modulates global histone methylation status in colorectal cancer. BioMetals. 2018;31(5):797‐805. - PubMed
    1. Chao A, Sieminski PJ, Owens CP, Goulding CW. Iron acquisition in mycobacterium tuberculosis. Chem Rev. 2018;119(2):1193‐1220. - PMC - PubMed
    1. Casciola‐Rosen L, Wigley F, Rosen A. Scleroderma autoantigens are uniquely fragmented by metal‐catalyzed oxidation reactions: implications for pathogenesis. J Exp Med. 1997;185(1):71‐80. - PMC - PubMed

Publication types