Observational Study
. 2020 Dec 1;202(11):1509-1519.
doi: 10.1164/rccm.202005-1885OC.

Uncontrolled Innate and Impaired Adaptive Immune Responses in Patients with COVID-19 Acute Respiratory Distress Syndrome

Affiliations
Observational Study

Uncontrolled Innate and Impaired Adaptive Immune Responses in Patients with COVID-19 Acute Respiratory Distress Syndrome

Sophie Hue et al. Am J Respir Crit Care Med. .

Abstract

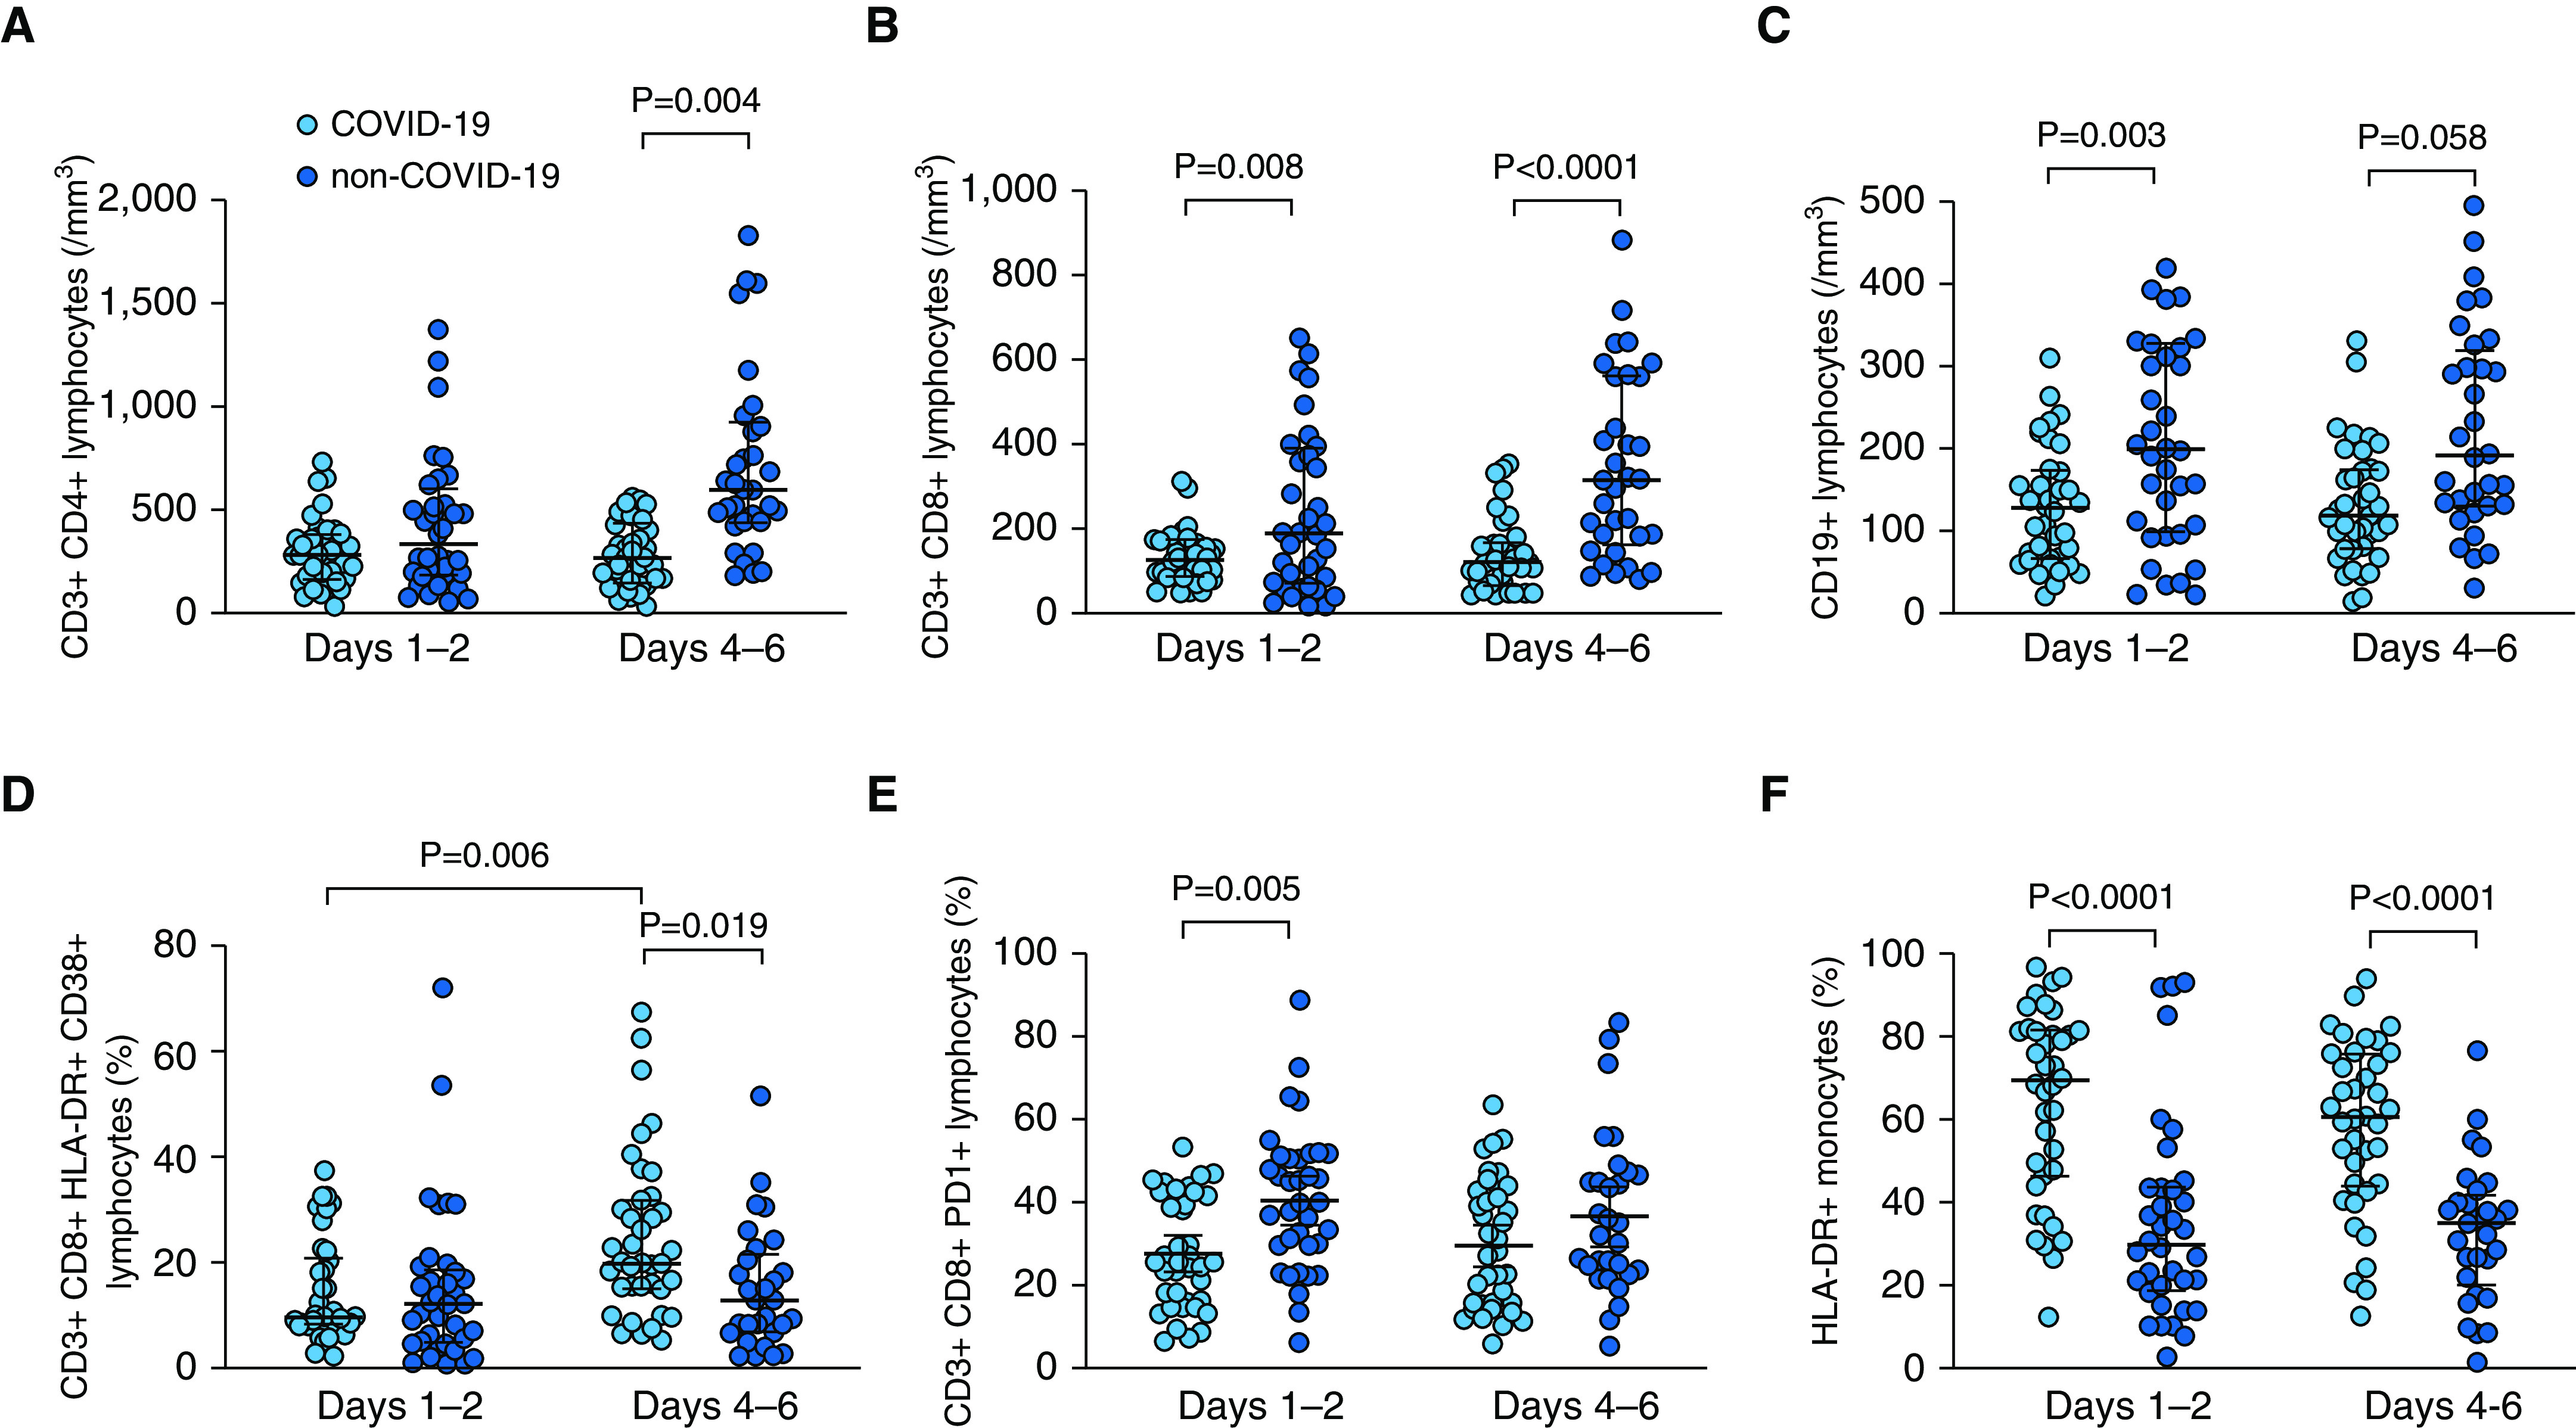
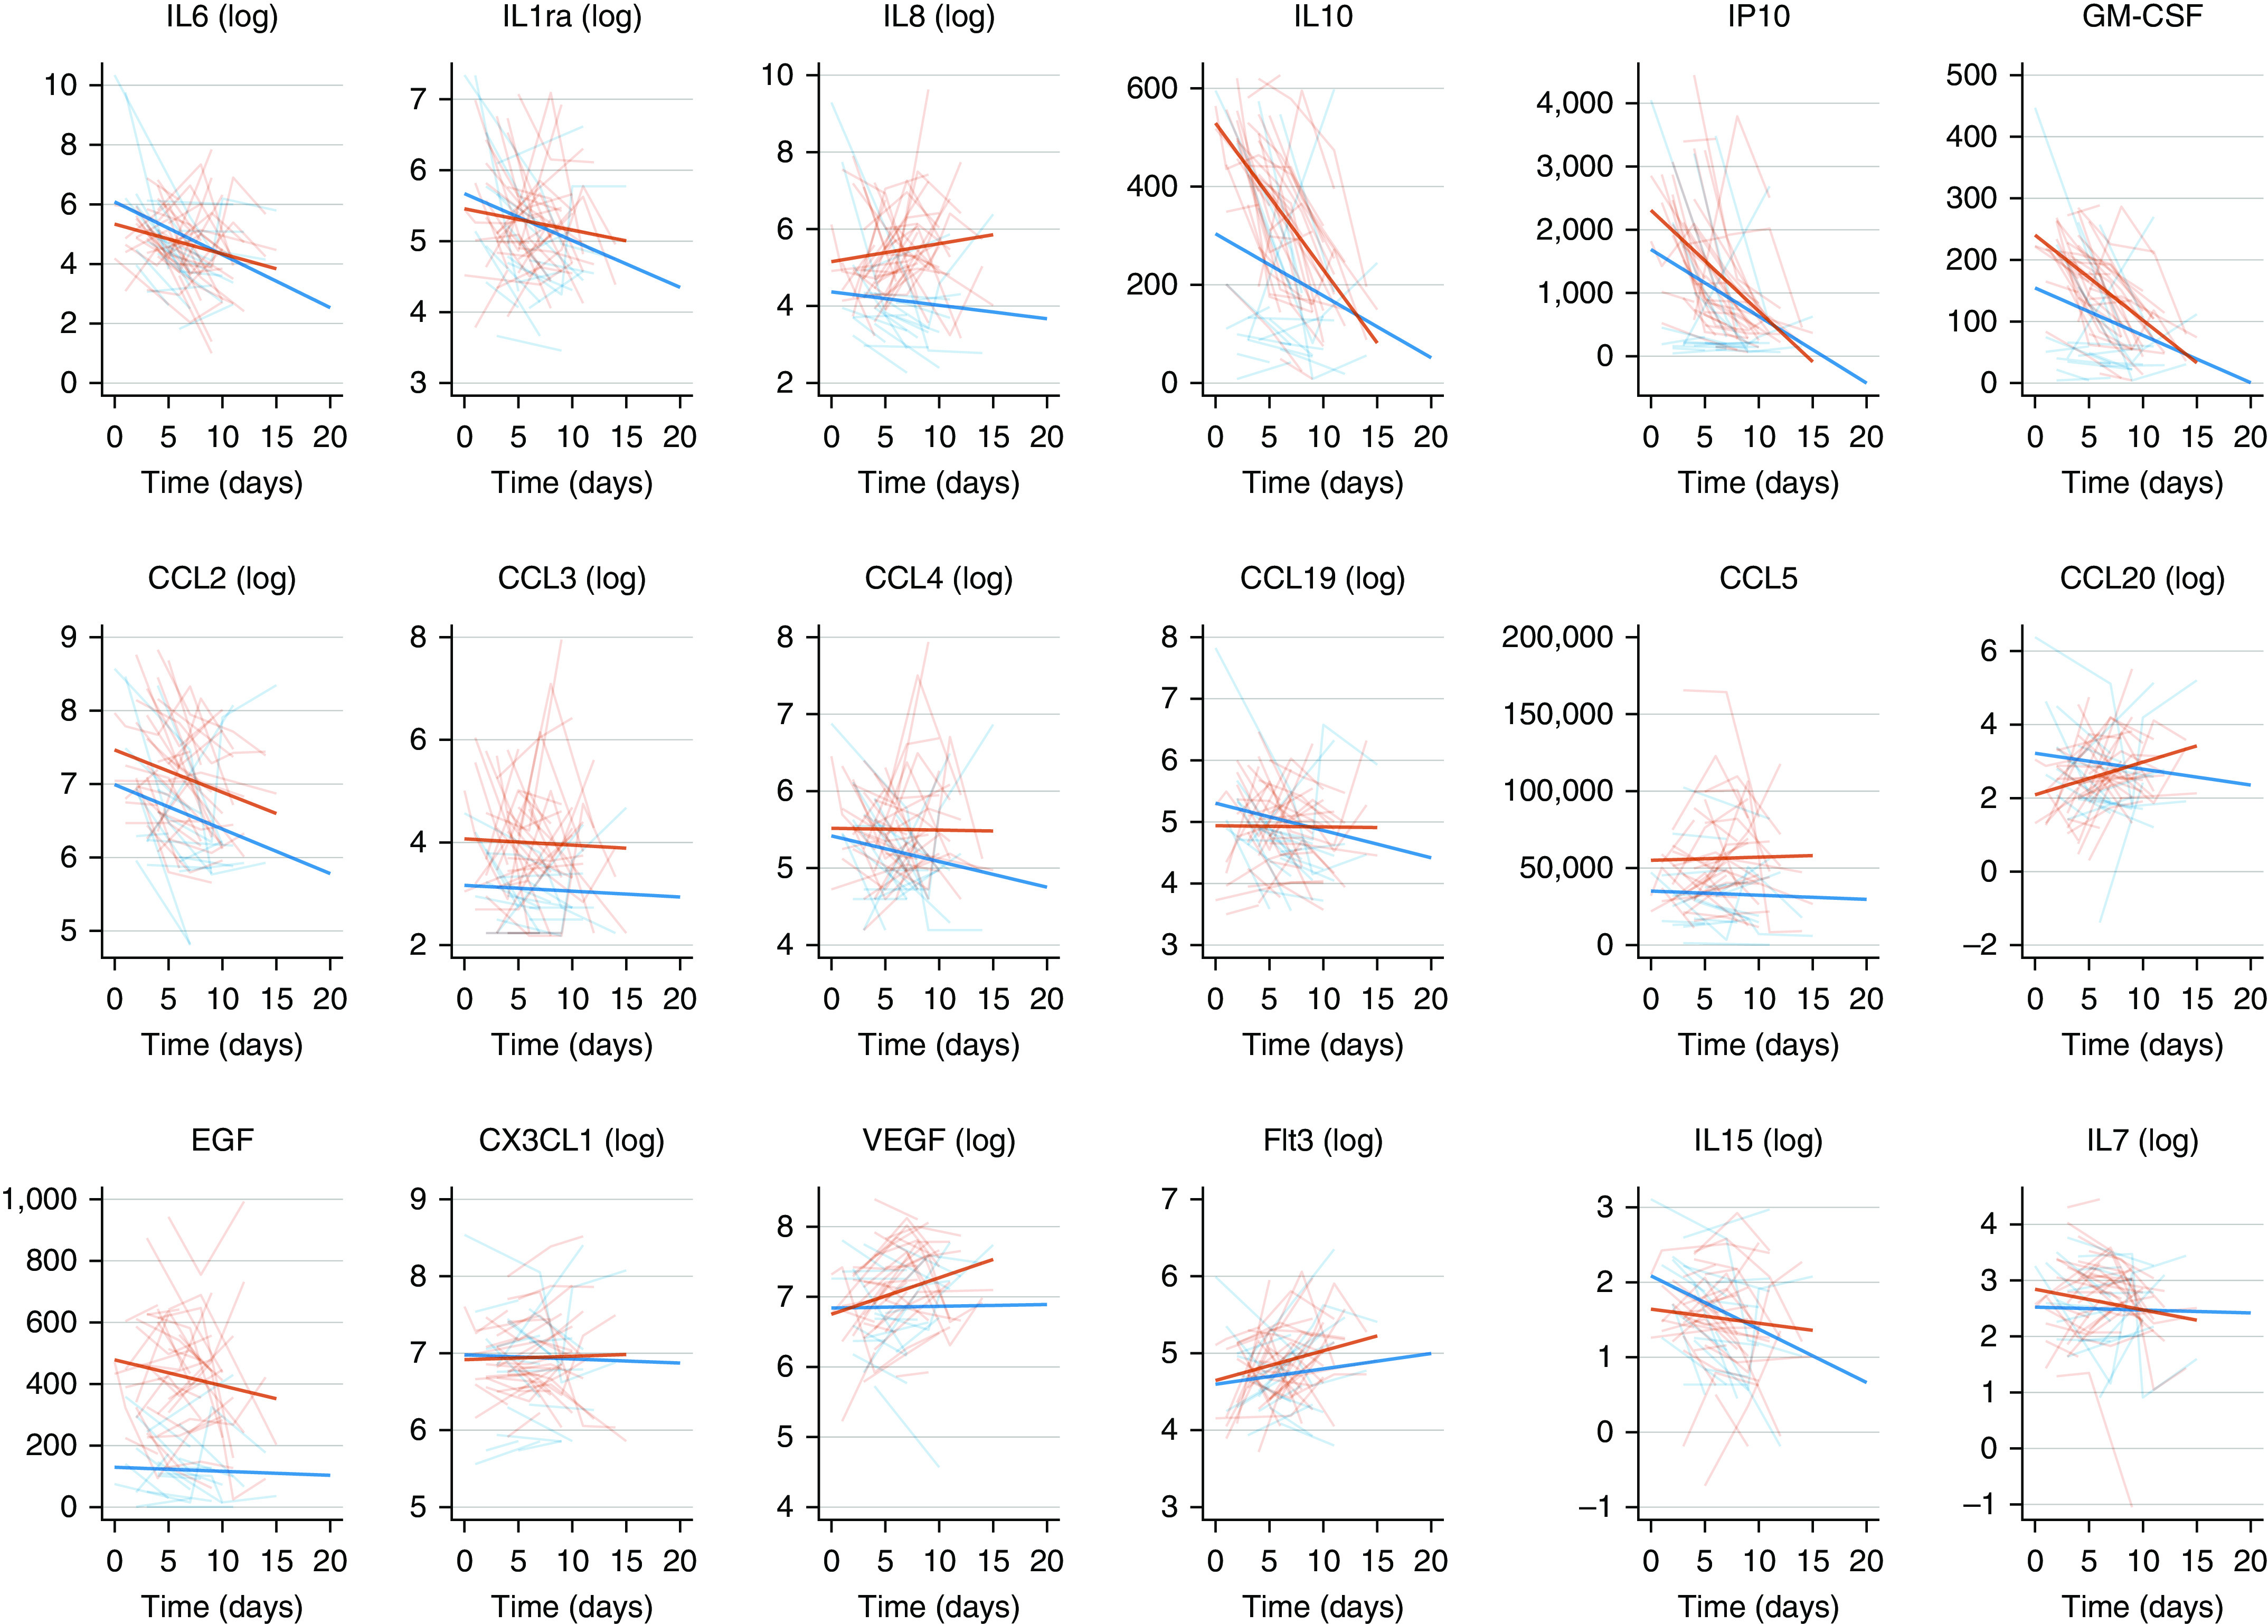
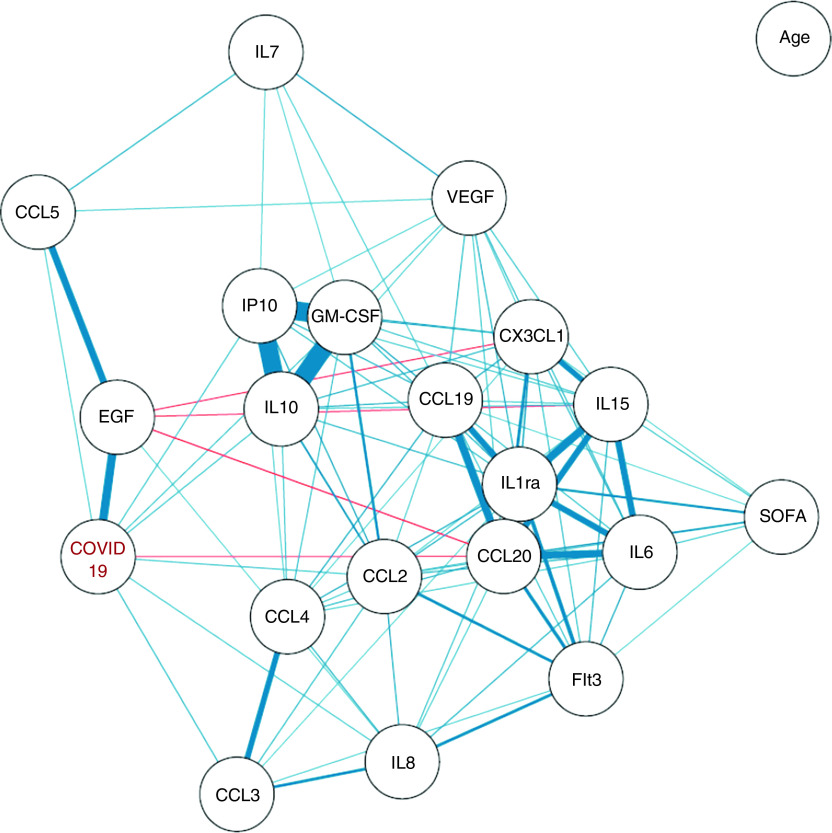
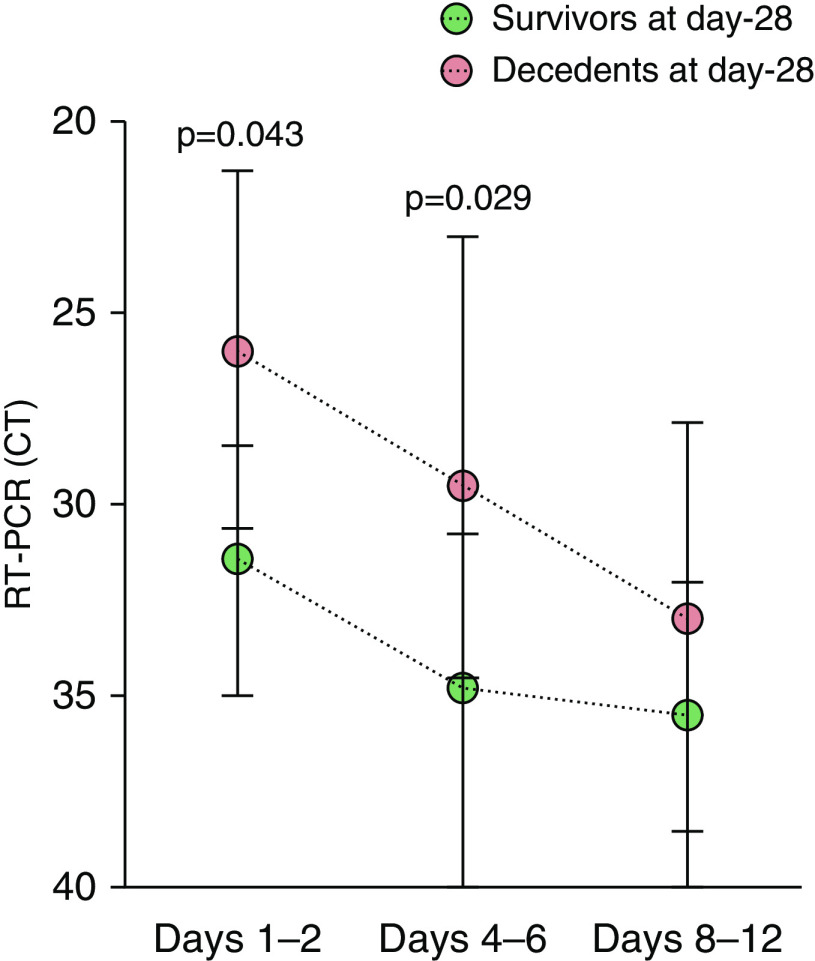
Rationale: Uncontrolled inflammatory innate response and impaired adaptive immune response are associated with clinical severity in patients with coronavirus disease (COVID-19).Objectives: To compare the immunopathology of COVID-19 acute respiratory distress syndrome (ARDS) with that of non-COVID-19 ARDS, and to identify biomarkers associated with mortality in patients with COVID-19 ARDS.Methods: Prospective observational monocenter study. Immunocompetent patients diagnosed with RT-PCR-confirmed severe acute respiratory syndrome coronavirus 2 (SARS-CoV-2) infection and ARDS admitted between March 8 and March 30, 2020, were included and compared with patients with non-COVID-19 ARDS. The primary clinical endpoint of the study was mortality at Day 28. Flow cytometry analyses and serum cytokine measurements were performed at Days 1-2 and 4-6 of ICU admission.Measurements and Main Results: As compared with patients with non-COVID-19 ARDS (n = 36), those with COVID-19 (n = 38) were not significantly different regarding age, sex, and Sequential Organ Failure Assessment and Simplified Acute Physiology Score II scores but exhibited a higher Day-28 mortality (34% vs. 11%, P = 0.030). Patients with COVID-19 showed profound and sustained T CD4+ (P = 0.002), CD8+ (P < 0.0001), and B (P < 0.0001) lymphopenia, higher HLA-DR expression on monocytes (P < 0.001) and higher serum concentrations of EGF (epithelial growth factor), GM-CSF, IL-10, CCL2/MCP-1, CCL3/MIP-1a, CXCL10/IP-10, CCL5/RANTES, and CCL20/MIP-3a. After adjusting on age and Sequential Organ Failure Assessment, serum CXCL10/IP-10 (P = 0.047) and GM-CSF (P = 0.050) were higher and nasopharyngeal RT-PCR cycle threshold values lower (P = 0.010) in patients with COVID-19 who were dead at Day 28.Conclusions: Profound global lymphopenia and a "chemokine signature" were observed in COVID-19 ARDS. Increased serum concentrations of CXCL10/IP-10 and GM-CSF, together with higher nasopharyngeal SARS-CoV-2 viral load, were associated with Day-28 mortality.

Keywords: ARDS; COVID-19; SARS-CoV-2; chemokines; cytokines.


Figures

Figure 1.
Figure 1.
Flow cytometry analysis of lymphocyte subsets and monocytes in patients with (light blue) and without (dark blue) coronavirus disease (COVID-19) at Days 1–2 and Days 4–6 of ICU admission. (A) Blood T CD4+ lymphocyte counts; there was a significant effect of COVID-19 status (P = 0.002) but not of time point (P = 0.091) and no significant interaction (COVID-19 status × time point, P = 0.074) by two-way ANOVA. (B) Blood T CD8+ lymphocyte counts; there was a significant effect of COVID-19 status (P < 0.0001) but not of time point (P = 0.108) and no significant interaction (COVID-19 status × time point, P = 0.162) by two-way ANOVA. (C) Blood B (CD19+) lymphocyte counts; there was a significant effect of COVID-19 status (P < 0.0001) but not of time point (P = 0.578) and no significant interaction (COVID-19 status × time point, P = 0.540) by two-way ANOVA. (D) Percentage of T CD8+CD38+HLA-DR+ lymphocytes; there was a significant effect of COVID-19 status (P = 0.046) but not of time point (P = 0.025), with a significant interaction (COVID-19 status × time point, P = 0.024) by two-way ANOVA. (E) Percentage of T CD8+PD1+ lymphocytes; there was a significant effect of COVID-19 status (P < 0.001) but not of time point (P = 0.753) and no significant interaction (COVID-19 status × time point, P = 0.293) by two-way ANOVA. (F) Percentage of HLA-DR+ monocytes; there was a significant effect of COVID-19 status (P < 0.0001) but not of time point (P = 0.252) and no significant interaction (COVID-19 status × time point, P = 0.630) by two-way ANOVA. P values indicated on the figure come from the Sidak post hoc test.
Figure 2.
Figure 2.
Evolution of serum concentrations of cytokines over time in patients with coronavirus disease (COVID-19) (thick red lines) and non–COVID-19 (thick blue lines) acute respiratory distress syndrome. The y-axis represents serum concentrations expressed in log ng/ml. Individual trajectories of patients with (thin red lines) and without (thin blue lines) COVID-19 are represented in the background. The x-axis represents the time elapsed since hospital admission (Day 0).
Figure 3.
Figure 3.
Correlation network between cytokines and coronavirus disease (COVID-19) status. The correlation network is constructed from all pairwise correlations between cytokines and the COVID-19 status, computing Spearman and biserial correlation coefficients for continuous–continuous and binary–continuous variables correlations, respectively. Variables are represented by nodes and connected by edges. Red and blue lines represent negative and positive correlations, respectively, with line width, color saturation, and variable proximity on the graph being proportional to the strength of the correlation. Shown edges are all based on statistically significant correlation coefficients at the P < 0.05 level after Benjamini-Hochberg correction for test multiplicity. SOFA = Sequential Organ Failure Assessment.
Figure 4.
Figure 4.
Severe acute respiratory syndrome coronavirus 2 (SARS-CoV-2) RT-PCR CT kinetics measured in nasopharyngeal swabs obtained at Days 1–2, Days 4–6, and Days 8–12 of ICU admission in Day-28 survivors (green circles, n = 25) and decedents (red circles, n = 13). Note that the y-axis is inverted so as to reflect that the RT-PCR CT is inversely correlated with RNA viral load. By two-way ANOVA with repeated measures, there was a significant effect of time (P = 0.002) of outcome (survivors vs. decedents, P = 0.0003) with no significant interaction (time × outcome, P = 0.831). P values indicated on the figure come from the Sidak’s multiple comparisons test. Circles represent median values, and error bars show the interquartile ranges. CT = cycle threshold.

Comment in

References

    1. Wu C, Chen X, Cai Y, Xia J, Zhou X, Xu S, et al. Risk factors associated with acute respiratory distress syndrome and death in patients with coronavirus disease 2019 pneumonia in Wuhan, China. JAMA Intern Med. 2020;180:1–11. - PMC - PubMed
    1. Qin C, Zhou L, Hu Z, Zhang S, Yang S, Tao Y, et al. Dysregulation of immune response in patients with coronavirus 2019 (COVID-19) in Wuhan, China. Clin Infect Dis. 2020;71:762–768. - PMC - PubMed
    1. Huang C, Wang Y, Li X, Ren L, Zhao J, Hu Y, et al. Clinical features of patients infected with 2019 novel coronavirus in Wuhan, China. Lancet. 2020;395:497–506. - PMC - PubMed
    1. Ruan Q, Yang K, Wang W, Jiang L, Song J. Clinical predictors of mortality due to COVID-19 based on an analysis of data of 150 patients from Wuhan, China. Intensive Care Med. 2020;46:846–848. - PMC - PubMed
    1. Giamarellos-Bourboulis EJ, Netea MG, Rovina N, Akinosoglou K, Antoniadou A, Antonakos N, et al. Complex immune dysregulation in COVID-19 patients with severe respiratory failure. Cell Host Microbe. 2020;27:992–1000, e3. - PMC - PubMed

Publication types

MeSH terms