. 2020 Aug 31;15(8):e0238316.
doi: 10.1371/journal.pone.0238316. eCollection 2020.

Plasma metabolomic study in perinatally HIV-infected children using 1H NMR spectroscopy reveals perturbed metabolites that sustain during therapy

Affiliations

Plasma metabolomic study in perinatally HIV-infected children using 1H NMR spectroscopy reveals perturbed metabolites that sustain during therapy

Urvinder Kaur S et al. PLoS One. .

Abstract

Background: Perinatally HIV-infected children on anti-retroviral treatment (ART) are reported to have metabolic abnormalities such as dyslipidemia, lipodystrophy, and insulin resistance which potentially increase the risk of diabetes, kidney, liver and cardiovascular disease.

Objective: To elucidate HIV-mediated metabolic complications that sustain even during ART in perinatally HIV-infected children.

Method: We have carried out metabolic profiling of the plasma of treatment-naïve and ART-suppressed perinatally HIV-infected children and uninfected controls using 1H nuclear magnetic resonance (NMR) spectroscopy followed by statistical analysis and annotation.

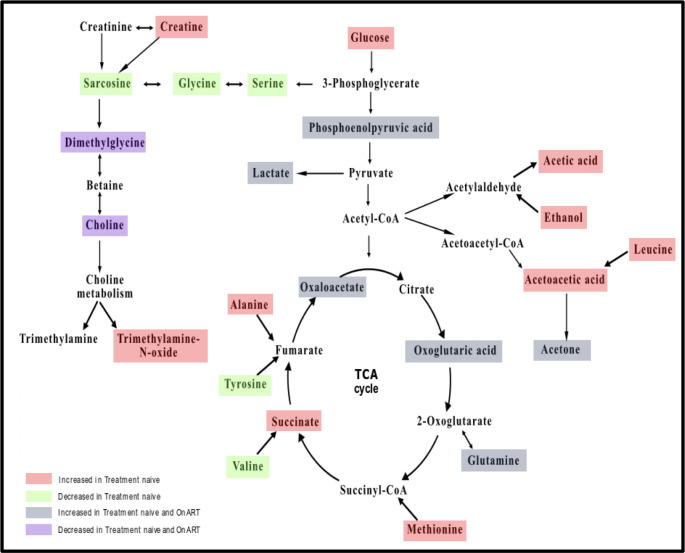
Result: Validated multivariate analysis showed clear distinction among our study groups. Our results showed elevated levels of lactate, glucose, phosphoenolpyruvic acid, propionic acid, 2-ketobutyric acid and tricarboxylic acid (TCA) cycle metabolites in untreated HIV-infected children compared to uninfected controls. ART normalized the levels of several metabolites, however the level of lactate, phosphoenolpyruvic acid, oxoglutaric acid, oxaloacetic acid, myoinositol and glutamine remained upregulated despite ART in HIV-infected children. Pathway analysis revealed perturbed propanoate metabolism, amino acid metabolism, glycolysis and TCA cycle in untreated and ART-suppressed HIV-infected children.

Conclusion: Developing therapeutic strategies targeting metabolic abnormalities may be beneficial for preventing diabetes, cardiovascular disease or other associated complications in perinatally HIV-infected children.


Conflict of interest statement

The authors have declared that no competing interests exist.

Figures

Fig 1
Fig 1. Representative 500‐MHz 1H nuclear magnetic resonance spectra of serum from treatment naïve (green), ART-suppressed (green) perinatally HIV-infected child and uninfected control (blue).
1‐ Leucine, 2- valine, 3–2-Ketobutyric acid, 4- ethanol, 5- β-hydroxybutyrate, 6- lactate, 7- dimethylmalonic acid, 8- alanine, 9–2-ethyl-2-Hydroxybutyric acid, 10- acetate, 11- n-acetyl-L-alanine, 12- methionine, 13- acetone, 14- acetoacetate, 15- oxalacetic acid, 16- succinic acid, 17- glutamine, 18- pyridoxal, 19- citrate, 20- sarcosine, 21- aspartate, 22- dimethylglycine, 23- oxoglutaric acid, 24- creatine, 25- choline, 26- trimetylamine N‐oxide, 27- theophylline, 28- methylguanidine, 29- taurine, 30- cis-aconitic acid, 31- β−glucose, 32- glycine, 33- myo-inositol, 34- glucono-1,5-lactone, 35- N-methyl-a-aminoisobutyric acid, 36- mannitol, 37- serine, 38- isopropyl alcohol, 39- fructose, 40- glyceric acid, 41- tyrosine, 42–2-furoylglycine, 43- formic acid. Broken lines indicate excluded spectral region.
Fig 2
Fig 2
A. PCA B. PLS-DA C. OPLS-DA score plots developed from 1H NMR spectra of plasma of treatment-naïve (red), ART-suppressed (green), perinatally HIV-infected children and uninfected controls (blue). Each dot represents individual samples.
Fig 3
Fig 3. Unsupervised hierarchical clustering of top 75 metabolites that distinguish treatment-naïve, ART-suppressed perinatally HIV infected children from uninfected controls.
Each cell in the heat map denotes relative level of metabolites, with samples in column and metabolites in the row. Red and blue indicate increased and decreased levels, respectively.
Fig 4
Fig 4. Box plots illustrating the levels of representatives metabolites in the plasma of treatment-naïve (red), ART-suppressed (green) perinatally HIV infected subjects and uninfected controls (blue).
The y-axis shows the normalized concentrations of the metabolites. Each box represents interquartile range (IQR) between 25% and the 75% percentiles while the error bar represents 5% and 95% percentiles. Horizontal line within box denotes the median value. Circles indicate the single data points. * = p < 0.05, ** = p<0.005, *** = p <0.00005, **** = p >0.00005. p < 0.05 was statistically significant.
Fig 5
Fig 5. Perturbed metabolic pathways in treatment-naïve and ART-suppressed perinatally HIV infected children.

References

    1. UNAIDS DATA 2019. 2019. Available: https://www.unaids.org/sites/default/files/media_asset/2019-UNAIDS-data_...
    1. Tobin NH, Aldrovandi GM. Immunology Of Pediatric HIV Infection. Immunol Rev. 2013;254: 143–169. 10.1111/imr.12074 - DOI - PMC - PubMed
    1. Gona P, Van Dyke RB, Williams PL, Dankner WM, Chernoff MC, Nachman SA, et al. Incidence of opportunistic and other infections in HIV-infected children in the HAART era. J Am Med Assoc. 2006;296: 292–300. 10.1001/jama.296.3.292 - DOI - PubMed
    1. Fortuny C, Deyà-Martínez Á, Chiappini E, Galli L, de Martino M, Noguera-Julian A. Metabolic and renal adverse effects of antiretroviral therapy in HIV-infected children and adolescents. Pediatr Infect Dis J. 2015;34: S36–43. 10.1097/INF.0000000000000663 - DOI - PubMed
    1. Dapena M, Jiménez B, Noguera-Julian A, Soler-Palacín P, Fortuny C, Lahoz R, et al. Metabolic disorders in vertically HIV-infected children: future adults at risk for cardiovascular disease. J Pediatr Endocrinol Metab. 2012;25: 529–35. 10.1515/jpem-2012-0005 - DOI - PubMed

Publication types

Substances