

Applicability of hiPSC-Derived Neuronal Cocultures and Rodent Primary Cortical Cultures for In Vitro Seizure Liability Assessment
- PMID: 32866265
- PMCID: PMC7657345
- DOI: 10.1093/toxsci/kfaa136
Applicability of hiPSC-Derived Neuronal Cocultures and Rodent Primary Cortical Cultures for In Vitro Seizure Liability Assessment
Abstract
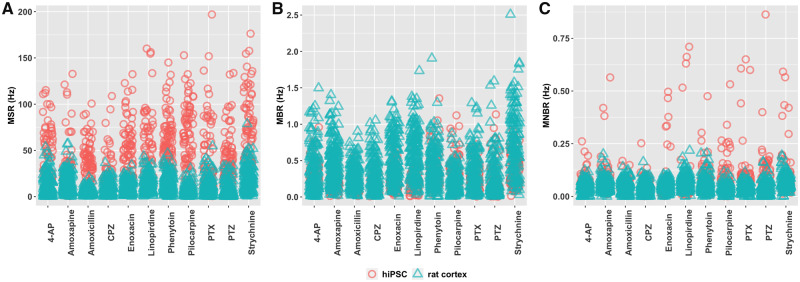
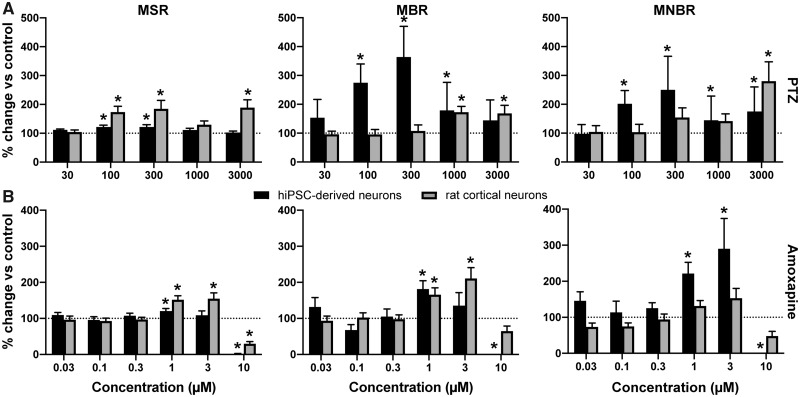
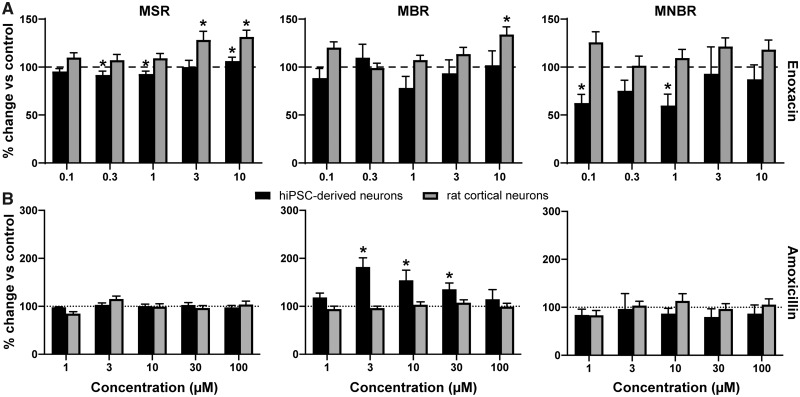
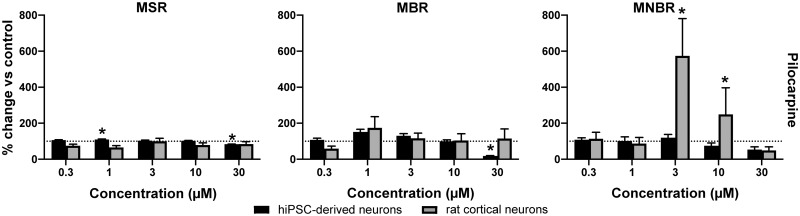
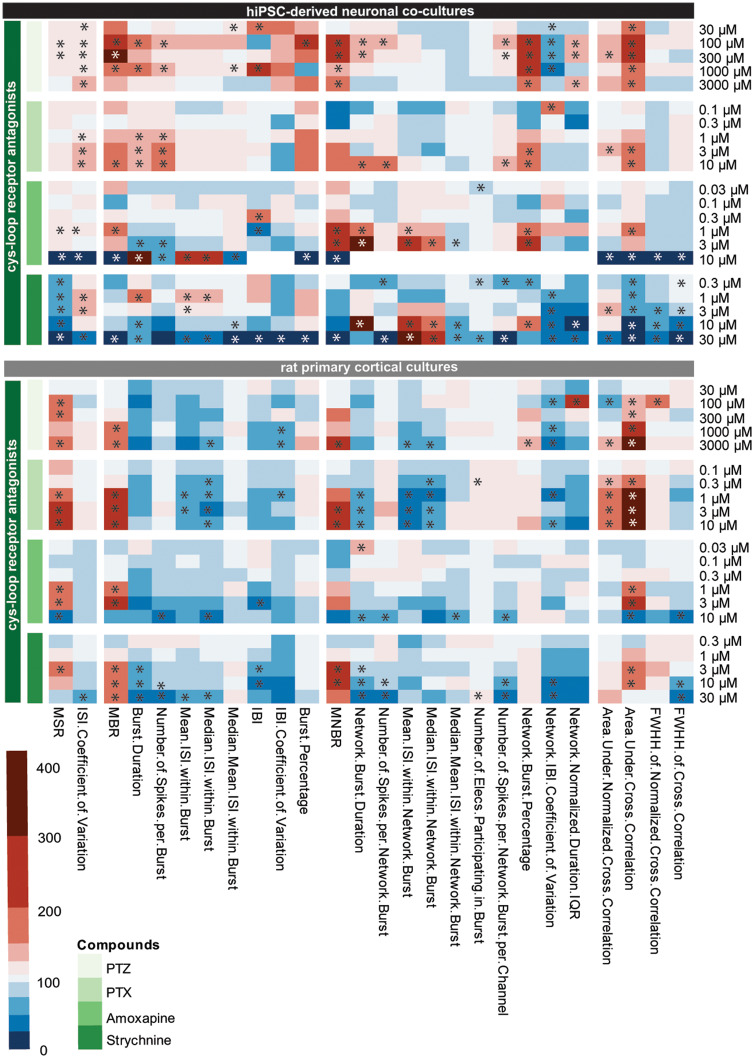
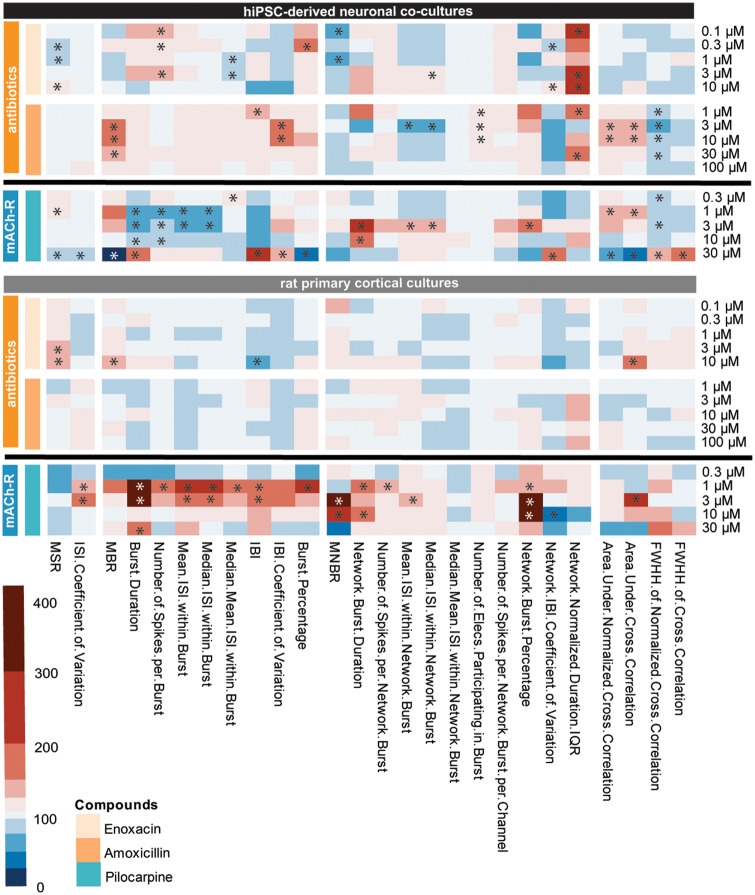
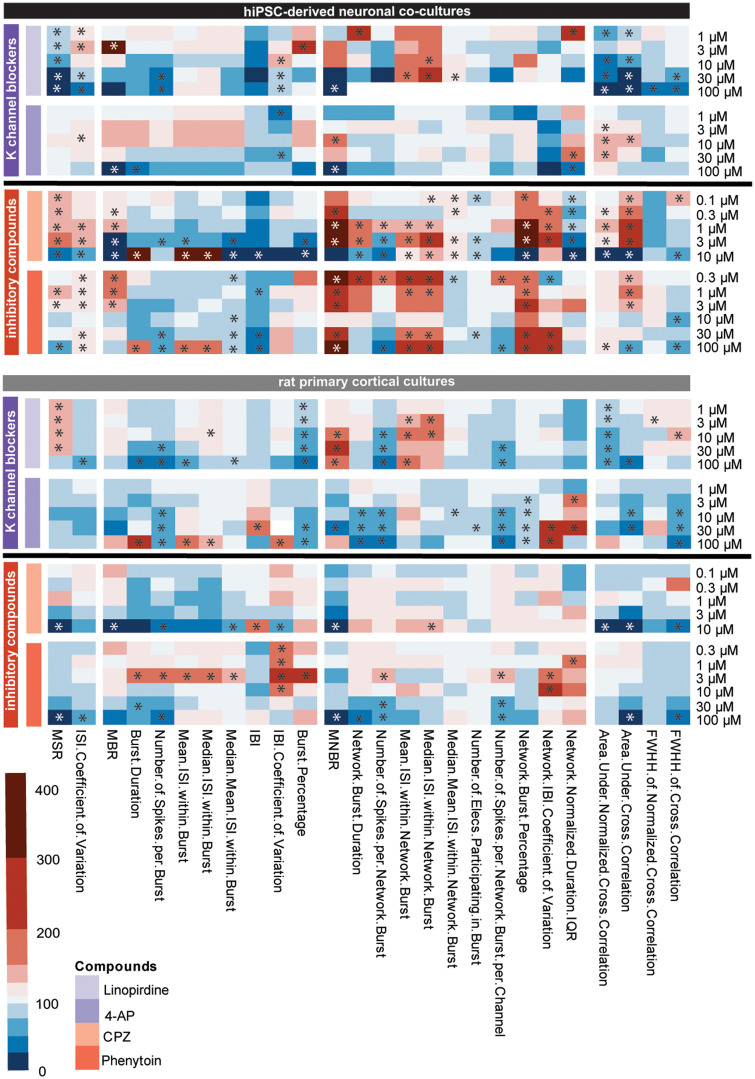
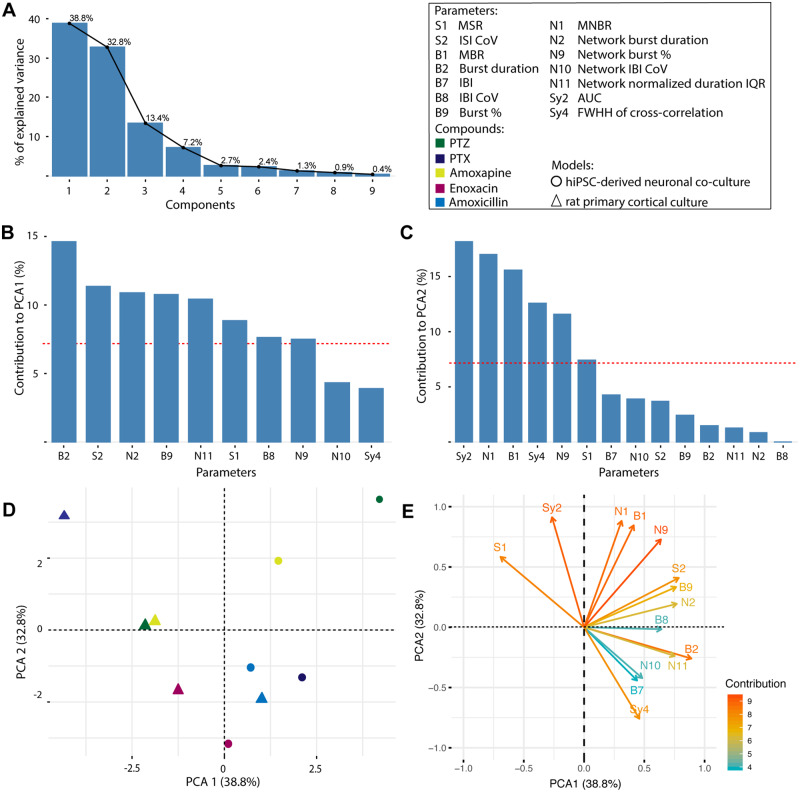
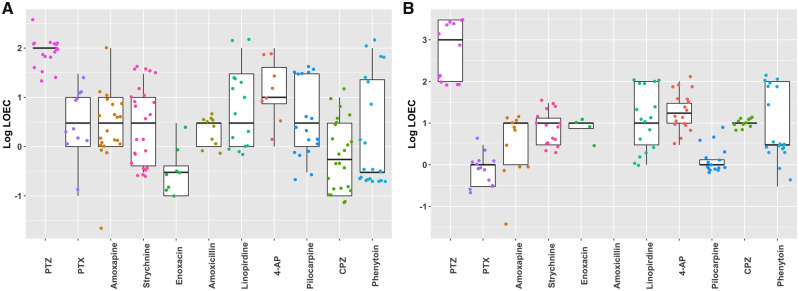
Seizures are life-threatening adverse drug reactions which are investigated late in drug development using rodent models. Consequently, if seizures are detected, a lot of time, money and animals have been used. Thus, there is a need for in vitro screening models using human cells to circumvent interspecies translation. We assessed the suitability of cocultures of human-induced pluripotent stem cell (hiPSC)-derived neurons and astrocytes compared with rodent primary cortical cultures for in vitro seizure liability assessment using microelectrode arrays. hiPSC-derived and rodent primary cortical neuronal cocultures were exposed to 9 known (non)seizurogenic compounds (pentylenetetrazole, amoxapine, enoxacin, amoxicillin, linopirdine, pilocarpine, chlorpromazine, phenytoin, and acetaminophen) to assess effects on neuronal network activity using microelectrode array recordings. All compounds affect activity in hiPSC-derived cocultures. In rodent primary cultures all compounds, except amoxicillin changed activity. Changes in activity patterns for both cell models differ for different classes of compounds. Both models had a comparable sensitivity for exposure to amoxapine (lowest observed effect concentration [LOEC] 0.03 µM), linopirdine (LOEC 1 µM), and pilocarpine (LOEC 0.3 µM). However, hiPSC-derived cultures were about 3 times more sensitive for exposure to pentylenetetrazole (LOEC 30 µM) than rodent primary cortical cultures (LOEC 100 µM). Sensitivity of hiPSC-derived cultures for chlorpromazine, phenytoin, and enoxacin was 10-30 times higher (LOECs 0.1, 0.3, and 0.1 µM, respectively) than in rodent cultures (LOECs 10, 3, and 3 µM, respectively). Our data indicate that hiPSC-derived neuronal cocultures may outperform rodent primary cortical cultures with respect to detecting seizures, thereby paving the way towards animal-free seizure assessment.
Keywords: alternatives to animal testing; human-induced pluripotent stem cell (hiPSC)-derived neuronal models; microelectrode array (MEA); rodent primary cortical cultures; seizure liability assessment.
© The Author(s) 2020. Published by Oxford University Press on behalf of the Society of Toxicology.
Figures


Similar articles
-
Towards animal-free neurotoxicity screening: Applicability of hiPSC-derived neuronal models for in vitro seizure liability assessment.ALTEX. 2020;37(1):121-135. doi: 10.14573/altex.1907121. Epub 2019 Nov 2. ALTEX. 2020. PMID: 31686111
-
Human iPSC-derived neuronal models for in vitro neurotoxicity assessment.Neurotoxicology. 2018 Jul;67:215-225. doi: 10.1016/j.neuro.2018.06.007. Epub 2018 Jun 19. Neurotoxicology. 2018. PMID: 29909083
-
Human induced pluripotent stem cell (hiPSC)-derived neurons respond to convulsant drugs when co-cultured with hiPSC-derived astrocytes.Toxicology. 2017 Aug 15;389:130-138. doi: 10.1016/j.tox.2017.06.010. Epub 2017 Jun 28. Toxicology. 2017. PMID: 28666936
-
Novel test strategies for in vitro seizure liability assessment.Expert Opin Drug Metab Toxicol. 2021 Aug;17(8):923-936. doi: 10.1080/17425255.2021.1876026. Epub 2021 Feb 17. Expert Opin Drug Metab Toxicol. 2021. PMID: 33595380 Free PMC article. Review.
-
[Method for MEA Data Analysis of Drug-treated Rat Primary Neurons and Human iPSC-derived Neurons to Evaluate the Risk of Drug-induced Seizures].Yakugaku Zasshi. 2018;138(6):823-828. doi: 10.1248/yakushi.17-00213-3. Yakugaku Zasshi. 2018. PMID: 29863054 Review. Japanese.
Cited by
-
Current status and future directions for a neurotoxicity hazard assessment framework that integrates in silico approaches.Comput Toxicol. 2022 May;22:100223. doi: 10.1016/j.comtox.2022.100223. Epub 2022 Mar 17. Comput Toxicol. 2022. PMID: 35844258 Free PMC article.
-
A human stem cell-derived test system for agents modifying neuronal N-methyl-D-aspartate-type glutamate receptor Ca2+-signalling.Arch Toxicol. 2021 May;95(5):1703-1722. doi: 10.1007/s00204-021-03024-0. Epub 2021 Mar 13. Arch Toxicol. 2021. PMID: 33713149 Free PMC article.
-
Hyperexcitability and Pharmacological Responsiveness of Cortical Neurons Derived from Human iPSCs Carrying Epilepsy-Associated Sodium Channel Nav1.2-L1342P Genetic Variant.J Neurosci. 2021 Dec 8;41(49):10194-10208. doi: 10.1523/JNEUROSCI.0564-21.2021. Epub 2021 Oct 29. J Neurosci. 2021. PMID: 34716231 Free PMC article.
-
Using Human-Induced Pluripotent Stem Cell Derived Neurons on Microelectrode Arrays to Model Neurological Disease: A Review.Adv Sci (Weinh). 2023 Nov;10(33):e2301828. doi: 10.1002/advs.202301828. Epub 2023 Oct 20. Adv Sci (Weinh). 2023. PMID: 37863819 Free PMC article. Review.
-
Considerations in the Preclinical Assessment of the Safety of Antisense Oligonucleotides.Nucleic Acid Ther. 2023 Jan;33(1):1-16. doi: 10.1089/nat.2022.0061. Epub 2022 Dec 28. Nucleic Acid Ther. 2023. PMID: 36579950 Free PMC article. Review.
References
-
- Accardi M. V., Huang H., Authier S. (2018). Seizure liability assessments using the hippocampal tissue slice: Comparison of non-clinical species. J. Pharmacol. Toxicol. Methods 93, 59–68 - PubMed
-
- Alachkar A., Łażewska D., Latacz G., Frank A., Siwek A., Lubelska A., Honkisz-Orzechowska E., Handzlik J., Stark H., Kieć-Kononowicz K., et al. (2018). Studies on anticonvulsant effects of novel histamine h3r antagonists in electrically and chemically induced seizures in rats. Int. J. Mol. Sci. 19, 3386Available at: http://www.mdpi.com/1422-0067/19/11/3386. Accessed September 17, 2019. - PMC - PubMed
-
- Arrowsmith J., Miller P. (2013). Phase II and Phase III attrition rates 2011–2012. Nat. Rev. Drug Discov. 12, 569–569. Available at: http://www.nature.com/articles/nrd4090. Accessed September 4, 2019 - PubMed
Publication types
MeSH terms
Grants and funding
LinkOut - more resources
Full Text Sources
Medical
