. 2020 Aug 3;61(10):55.
doi: 10.1167/iovs.61.10.55.

Reduced Dendritic Spines in the Visual Cortex Contralateral to the Optic Nerve Crush Eye in Adult Mice

Affiliations

Reduced Dendritic Spines in the Visual Cortex Contralateral to the Optic Nerve Crush Eye in Adult Mice

Zongyi Zhan et al. Invest Ophthalmol Vis Sci. .

Abstract

Purpose: To determine alteration of dendritic spines and associated changes in the primary visual cortex (V1 region) related to unilateral optic nerve crush (ONC) in adult mice.

Methods: Adult unilateral ONC mice were established. Retinal nerve fiber layer (RNFL) thickness was measured by spectral-domain optical coherence tomography. Visual function was estimated by flash visual evoked potentials (FVEPs). Dendritic spines were observed in the V1 region contralateral to the ONC eye by two-photon imaging in vivo. The neurons, reactive astrocytes, oligodendrocytes, and activated microglia were assessed by NeuN, glial fibrillary acidic protein, CNPase, and CD68 in immunohistochemistry, respectively. Tropomyosin receptor kinase B (TrkB) and the markers in TrkB trafficking were estimated using western blotting and co-immunoprecipitation. Transmission electron microscopy and western blotting were used to evaluate autophagy.

Results: The amplitude and latency of FVEPs were decreased and delayed at 3 days, 1 week, 2 weeks, and 4 weeks after ONC, and RNFL thickness was decreased at 2 and 4 weeks after ONC. Dendritic spines were reduced in the V1 region contralateral to the ONC eye at 2, 3, and 4 weeks after ONC, with an unchanged number of neurons. Reactive astrocyte staining was increased at 2 and 4 weeks after ONC, but oligodendrocyte and activated microglia staining remained unchanged. TrkB was reduced with changes in the major trafficking proteins, and enhanced autophagy was observed in the V1 region contralateral to the ONC eye.

Conclusions: Dendritic spines were reduced in the V1 region contralateral to the ONC eye in adult mice. Reactive astrocytes and decreased TrkB may be associated with the reduced dendritic spines.


Conflict of interest statement

Disclosure: Z. Zhan, None; Y. Wu, None; Z. Liu, None; Y. Quan, None; D. Li, None; Y. Huang, None; S. Yang, None; K. Wu, None; L. Huang, None; M. Yu, None

Figures

Figure 1.
Figure 1.
Illustration of regions that were selected for neuronal cell examinations. (A) The brain tissues between the red-dashed lines were divided into histologic sections according to the stereo-position of the V1 region, which began above the hippocampus and terminated at the end of the occipital lobe. (B) This Nissl staining section was first matched with information in Paxinos and Franklin's the Mouse Brain in Stereotaxic Coordinates, 4th Edition (bregma, –2.53 mm; interaural, 1.26 mm). The neuronal cells at layer 2-6b in the V1 region (red-dashed-line rectangle) were then examined. Scale bar: 500 µm.
Figure 2.
Figure 2.
Alterations in FVEPs and RNFL after ONC. (A) Experimental timeline over the course of the experiment. FVEPs and SD-OCT were examined on day 0, 3 days after ONC, 1 week after ONC, 2 weeks after ONC, and 4 weeks after ONC. ONC surgery was performed at day 0 immediately after FVEP and SD-OCT examinations. (B) Example of FVEPs from a single mouse at day 0 and 4 weeks after ONC. Scale bar: 10 µV, 50 ms. (C) N1 latency change over 4 weeks following ONC surgery. (D) P1 latency change over 4 weeks following ONC surgery. (E) N1–P1 amplitude change over 4 weeks following ONC surgery. (F) Schematic showing partitions in the SD-OCT examinations. (G) RNFL thickness changes in various areas over 4 weeks following ONC surgery. Summary data are presented as mean ± SEM. *P < 0.05, **P < 0.001 compared with day 0 (n = 5 animals per group).
Figure 3.
Figure 3.
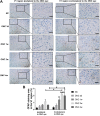
NeuN staining in the bilateral V1 region after unilateral ONC. (A) NeuN expression in the NC 3 days after ONC, 1 week after ONC, 2 weeks after ONC, and 4 weeks after ONC at the bilateral V1 region as shown by IHC. (B) The counts of NeuN stained cells and densitometric analysis of IHC. Scale bar: 50 µm. Summary data are presented as mean ± SEM. *P < 0.05, **P < 0.001, ***P < 0.0001 compared with NC group (n = 5 animals per group).
Figure 4.
Figure 4.
Change in dendritic spines in the V1 region contralateral to the ONC eye. (A) Experimental timeline acquired over the course of the experiment. The NC group and ONC group were observed by TPM at day 0, 7, 14, 21, and 28. At day 0, the ONC group received contralateral ONC surgery immediately after two-photon imaging. (B) Schematic showing the V1 region contralateral to the ONC eye in the two-photon microcopy examination. Scale bar: 1 mm. (C) Illustration of spines selected for the data analysis (red-dashed-line rectangles). Scale bar: 50 µm. (D) Images of the dendritic spines in layer 2/3 pyramidal neurons in adult NC and ONC mice over 4 weeks. Red arrowheads indicate eliminated dendritic spines, white arrowheads indicate newly formed spines, and white stars indicate filopodia. Scale bar: 2 µm. (E) Percentage of dendritic spines eliminated and formed over 1 week in the V1 region contralateral to the ONC eye compared with day 0. (F) Percentage of dendritic spines eliminated and formed in the V1 region contralateral to the ONC eye compared with day 7. (G) Percentage of dendritic spines eliminated and formed over 3 weeks in the V1 region contralateral to the ONC eye compared with day 14. (H) Percentage of dendritic spines eliminated and formed over 2 weeks in the V1 region contralateral to the ONC eye compared with day 28. Summary data are presented as mean ± SEM. *P < 0.05, **P < 0.001, ***P < 0.0001 (n = 4 animals per groups).
Figure 5.
Figure 5.
GFAP staining at the bilateral V1 region after unilateral ONC. (A) GFAP expression in the NC and groups representing 3 days after ONC, 1 week after ONC, 2 weeks after ONC, and 4 weeks after ONC at the bilateral V1 region as shown by IHC. Scale bar: 50 µm. (B) GFAP staining area and densitometric analysis of IHC. Summary data are presented as mean ± SEM. *P < 0.05, **P < 0.001, ***P< 0.0001 compared with the NC group (n = 5 animals per groups).
Figure 6.
Figure 6.
CNPase staining at the bilateral V1 region after unilateral ONC. (A) CNPase expression in the NC and groups representing 3 days after ONC, 1 week after ONC, 2 weeks after ONC, and 4 weeks after ONC at the bilateral V1 region as shown by IHC. Scale bar: 50 µm. (B) CNPase staining area and densitometric analysis of IHC. Summary data are presented as mean ± SEM. *P < 0.05, **P < 0.001, ***P< 0.0001 compared with the NC group (n = 5 animals per groups).
Figure 7.
Figure 7.
CD68 staining at the bilateral V1 region after unilateral ONC. (A) CD68 expression in the NC and groups representing 3 days after ONC, 1 week after ONC, 2 weeks after ONC, and 4 weeks after ONC at the bilateral V1 region as shown by frozen section IHC. Scale bar: 50 µm. (B) CD68 staining area and densitometric analysis of IHC. Summary data are presented as mean ± SEM. *P < 0.05, **P < 0.001, ***P < 0.0001 compared with the NC group (n = 5 animals per groups).
Figure 8.
Figure 8.
TrkB and related major TrkB trafficking proteins expression in the V1 region contralateral to the ONC eye (AE) TrkB, Ndfip1, Rab5, Rab7, and Rab11 expression in the NC and groups representing 3 days after ONC, 1 week after ONC, 2 weeks after ONC, and 4 weeks after ONC in the V1 region contralateral to the ONC eye as shown by western blotting and densitometric analysis of western blotting analysis. (F) Interaction between TrkB and Rab11 in the NC and at 4 weeks after ONC in the V1 region contralateral to the ONC eye as shown by co-IP. Summary data are presented as mean ± SEM. *P < 0.05, **P < 0.001, ***P < 0.0001 compared with the NC group (n = 5 animals per groups).
Figure 9.
Figure 9.
Autophagy in the V1 region contralateral to the ONC eye. (A) Representative electron microphotographs of ultrastructural changes in neurons at the V1 region contralateral to the ONC eye and quantitative analysis of the NC and groups representing 3 days after ONC, 1 week after ONC, 2 weeks after ONC, and 4 weeks after ONC. Scale bar: 1 µm. N, nucleus; Nu, nucleolus; M, mitochondria; G, Golgi complex; RER, rough endoplasmic reticulum; SL, secondary lysosome; AP, initial autophagic compartment; AC, late autophagic compartments. (BD) Beclin1 and LC3 expression in the NC and groups representing 3 days after ONC, 1 week after ONC, 2 weeks after ONC, and 4 weeks after ONC in the V1 region contralateral to the ONC eye as shown by western blotting and densitometric analysis of the western blotting results. Summary data are presented as mean ± SEM. *P < 0.05, **P < 0.001, ***P < 0.0001, compared with the NC group (n = 5 animals per groups).

References

    1. Gilbert CD, Wiesel TN. Receptive field dynamics in adult primary visual cortex. Nature. 1992; 356: 150–152. - PubMed
    1. Hofer SB, Mrsic-Flogel TD, Bonhoeffer T, Hubener M. Lifelong learning: ocular dominance plasticity in mouse visual cortex. Curr Opin Neurobiol. 2006; 16: 451–459. - PubMed
    1. Zhou Y, Lai B, Gan WB. Monocular deprivation induces dendritic spine elimination in the developing mouse visual cortex. Sci Rep. 2017; 7: 4977. - PMC - PubMed
    1. Bavelier D, Levi DM, Li RW, Dan Y, Hensch TK. Removing brakes on adult brain plasticity: from molecular to behavioral interventions. J Neurosci. 2010; 30: 14964–14971. - PMC - PubMed
    1. Sengpiel F. Plasticity of the visual cortex and treatment of amblyopia. Curr Biol. 2014; 24: R936–R940. - PubMed

Publication types

MeSH terms