

Thermal Imaging of Root Caries In Vivo
- PMID: 32866422
- PMCID: PMC7684841
- DOI: 10.1177/0022034520951157
Thermal Imaging of Root Caries In Vivo
Abstract
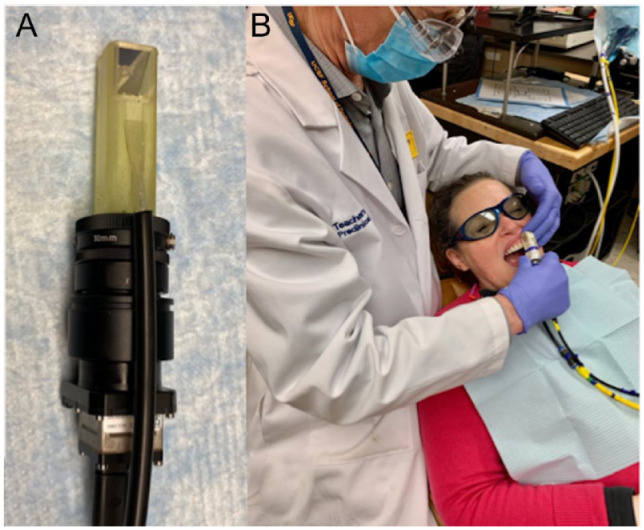
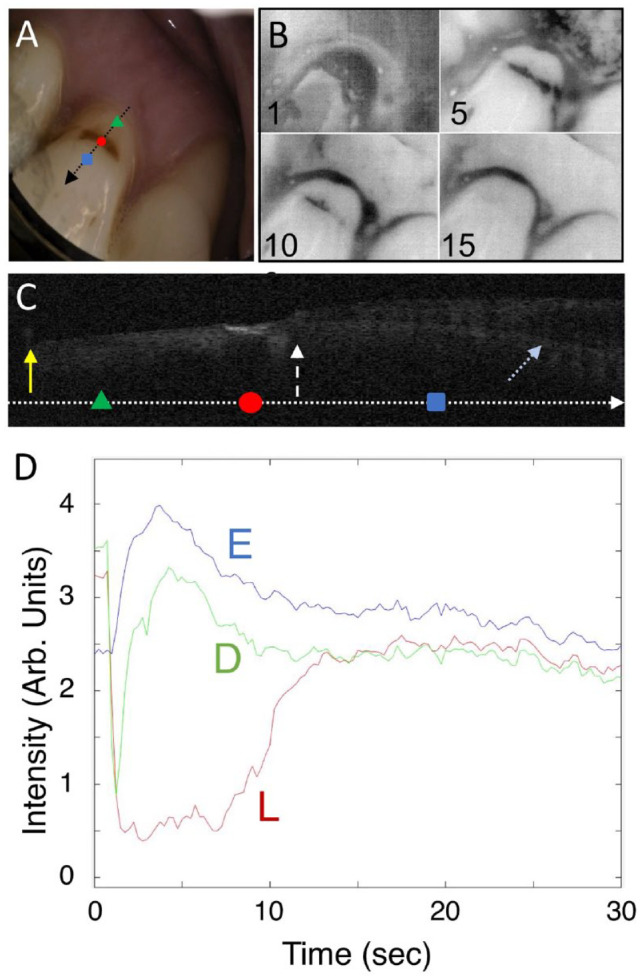
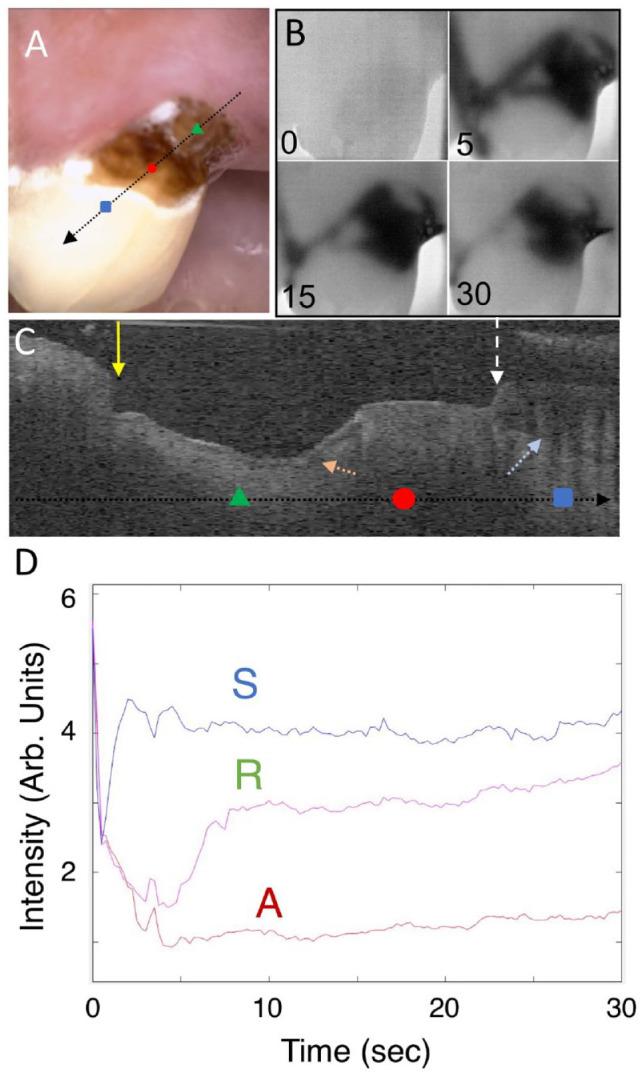
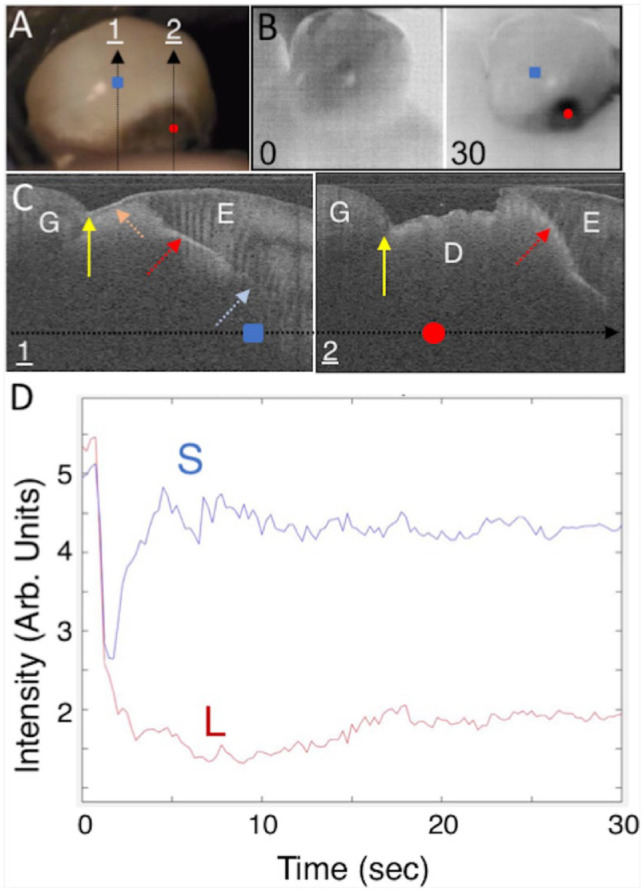
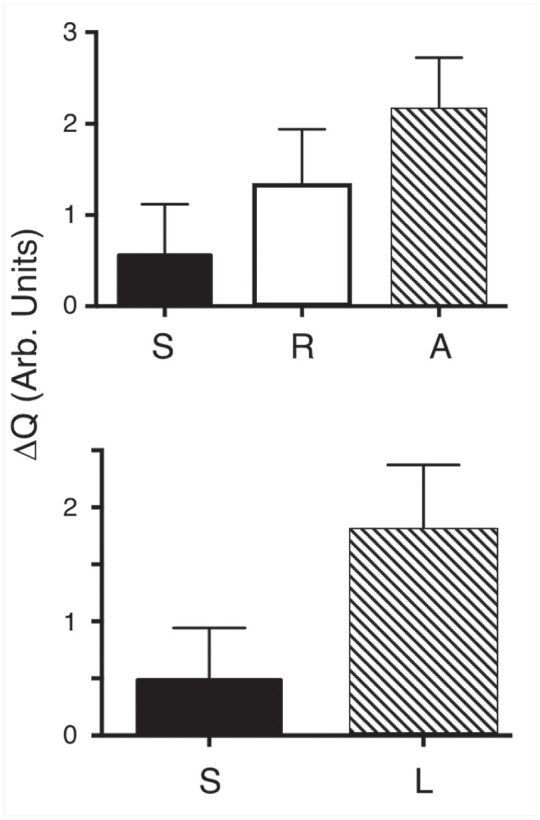
Improved methods are needed to assess the structure and activity of lesions on root surfaces in order to improve clinical decision making. Conventional visual and tactile methods for assessing lesion activity are not reliable, and the clinician is often unable to evaluate if the lesion is progressing or has remineralized. An important marker of an arrested lesion is a highly mineralized surface zone that forms when mineral is deposited in the outer layer of the lesion. In vitro studies have shown that a mineralized surface zone influences the kinetics of water evaporation and the surface temperature while drying. Temperature changes can be monitored by measuring the thermal emission with thermal imaging. Studies have also shown that the depth and severity of demineralization and the thickness of the highly mineralized transparent surface zone on arrested lesions can be measured nondestructively with optical coherence tomography (OCT). Thermal imaging at 8-µm to 13-µm wavelengths was completed on 30 test subjects with a suspected active root caries lesion by monitoring thermal emission from the tooth surfaces during 30 s of air drying. Lesions were also evaluated using cross-polarization OCT (CP-OCT) during lesion dehydration to identify transparent surface zones indicative of arrested lesions and determine if shrinkage occurred during drying. The overall thermal emission recorded during drying was significantly different (P < 0.001) when comparing sound tooth surfaces, lesion areas identified as arrested, and lesion areas identified as active, demonstrating that thermal imaging is a promising approach for the clinical assessment of lesion activity on root surfaces. Ten of the lesions in this study had distinct areas with transparent surface zones that were visible in CP-OCT images. Shrinkage was detected with CP-OCT during drying for 12 lesions. This study confirms that these novel approaches for assessing lesion activity on root surfaces can be implemented in vivo.
Keywords: active lesions; arrested lesions; caries diagnosis; lesion activity; lesion shrinkage; optical coherence tomography.
Conflict of interest statement
The authors declare no potential conflicts of interest with respect to the authorship and/or publication of this article.
Figures
Similar articles
-
Active Surveillance of Root Caries in Vivo with CP-OCT.Diagnostics (Basel). 2023 Jan 27;13(3):465. doi: 10.3390/diagnostics13030465. Diagnostics (Basel). 2023. PMID: 36766570 Free PMC article.
-
Measurement of the shrinkage of natural and simulated lesions on root surfaces using CP-OCT.J Dent. 2019 Nov;90:103213. doi: 10.1016/j.jdent.2019.103213. Epub 2019 Oct 14. J Dent. 2019. PMID: 31622647 Free PMC article.
-
Assessment of the activity of root caries lesions using short wavelength infrared imaging - an in vitro pilot study.J Dent. 2025 Jun;157:105769. doi: 10.1016/j.jdent.2025.105769. Epub 2025 Apr 17. J Dent. 2025. PMID: 40252948
-
Lesion activity assessment.Monogr Oral Sci. 2009;21:63-90. doi: 10.1159/000224213. Epub 2009 Jun 3. Monogr Oral Sci. 2009. PMID: 19494676 Review.
-
Root caries histopathology and chemistry.Am J Dent. 1994 Oct;7(5):261-5. Am J Dent. 1994. PMID: 7986449 Review.
Cited by
-
Assessing lesion activity of secondary lesions on extracted teeth by thermal dehydration measurement and optical coherence tomography.Proc SPIE Int Soc Opt Eng. 2022 Jan-Feb;11942:1194204. doi: 10.1117/12.2608291. Epub 2022 Mar 4. Proc SPIE Int Soc Opt Eng. 2022. PMID: 35450401 Free PMC article.
-
High contrast reflectance imaging at 1950 nm for the assessment of lesion activity on extracted teeth.Proc SPIE Int Soc Opt Eng. 2021 Mar;11627:116270P. doi: 10.1117/12.2584909. Epub 2021 Mar 5. Proc SPIE Int Soc Opt Eng. 2021. PMID: 33762796 Free PMC article.
-
In vitro Assessment of lesion activity using simultaneous time-resolved reflectance imaging at 1300 and 1950 nm.Lasers Med Sci. 2024 Aug 27;39(1):223. doi: 10.1007/s10103-024-04168-y. Lasers Med Sci. 2024. PMID: 39191998
-
Active Surveillance of Root Caries in Vivo with CP-OCT.Diagnostics (Basel). 2023 Jan 27;13(3):465. doi: 10.3390/diagnostics13030465. Diagnostics (Basel). 2023. PMID: 36766570 Free PMC article.
-
Emissivity evaluation of human enamel and dentin.Front Physiol. 2022 Oct 24;13:993674. doi: 10.3389/fphys.2022.993674. eCollection 2022. Front Physiol. 2022. PMID: 36353375 Free PMC article.
References
-
- Ando M, Ferreira-Zandona AG, Eckert GJ, Zero DT, Stookey GK. 2017. Pilot clinical study to assess caries lesion activity using quantitative light-induced fluorescence during dehydration. J Biomed Opt. 22(3):35005. - PubMed
-
- Ando M, Sharp N, Adams D. 2012. Pulse thermography for quantitative nondestructive evaluation of sound, de-mineralized and re-mineralized enamel. In: Proceedings of SPIE Volume 8348, Health Monitoring of Structural and Biological Systems; San Diego (CA): SPIE Smart Structures and Materials + Nondestructive Evaluation and Health Monitoring. p. 83480S.
-
- Banting DW. 1993. Diagnosis and prediction of root caries. Adv Dent Res. 7(2):80–86. - PubMed
-
- Banting DW. 2001. Diagnosis of root caries. J Dent Educ. 65(10):991–996. - PubMed
Publication types
MeSH terms
Grants and funding
LinkOut - more resources
Full Text Sources
Medical
Miscellaneous
