

Epidemiology of male breast cancer
- PMID: 32866903
- PMCID: PMC7476060
- DOI: 10.1016/j.breast.2020.08.010
Epidemiology of male breast cancer
Abstract
Background: Due to its rarity, few studies have characterized the epidemiology of male breast cancer. The purpose of this study was to determine survival and risk factors for male breast cancer in a large U.S.
Methods: In this study, 19,795 male patients with breast cancer were identified from the National Cancer Database (2004-2014). Patient demographics, tumor characteristics and treatments were analyzed by using descriptive statistics. We used multivariate Cox regression and Kaplan Meier analysis.
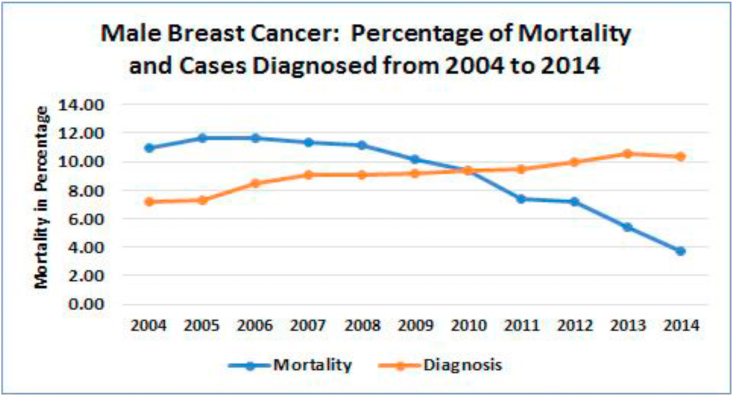
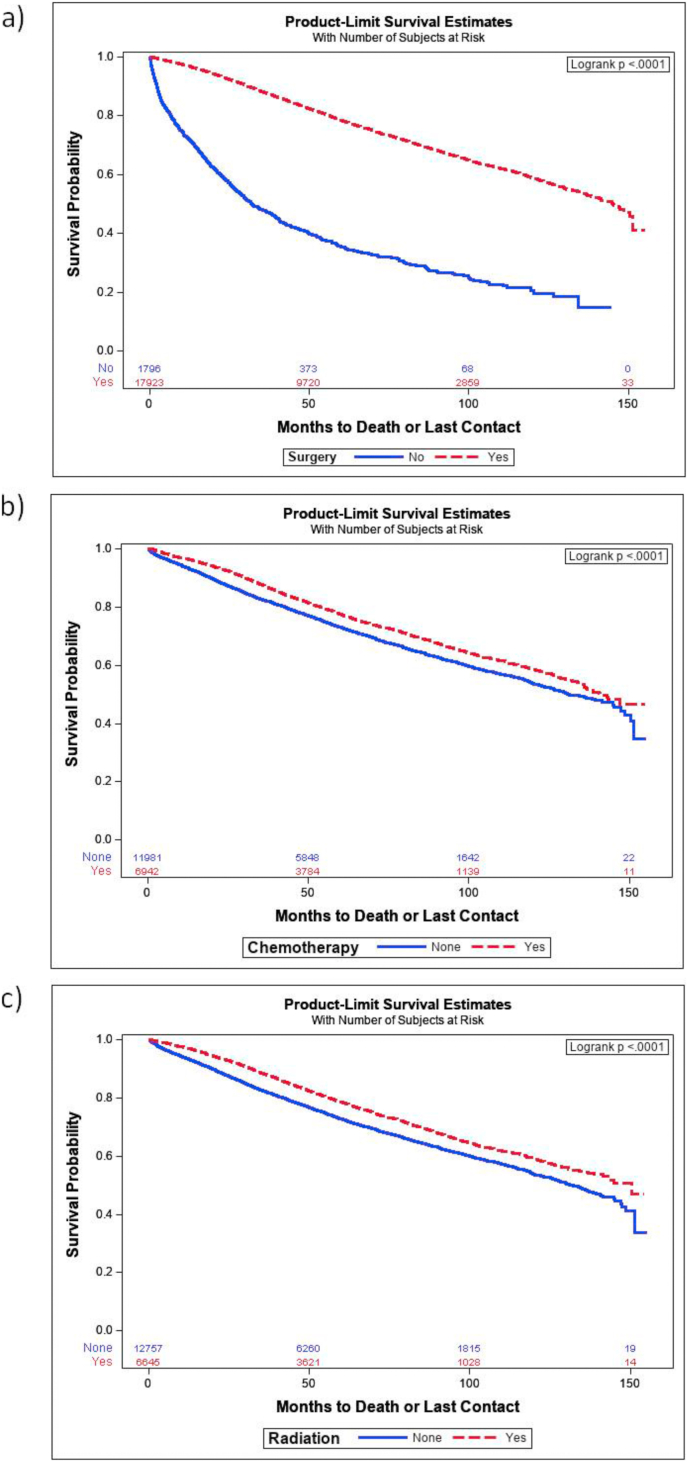
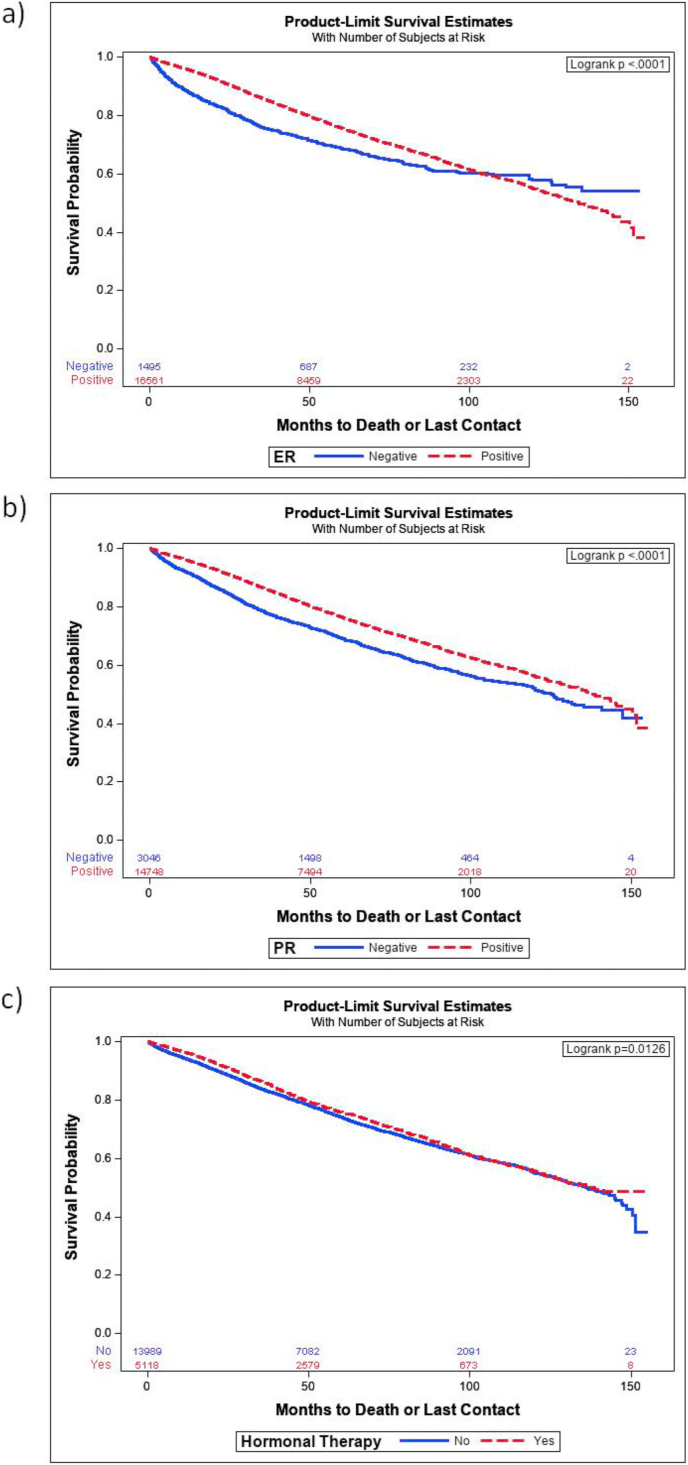
Results: Over 10 years, the incidence of male breast cancer increased from 7.2% to 10.3%, while mortality decreased from 11% to 3.8%. Socioeconomic factors predicting mortality included income medium, and high vs low (HR = 0.78; 0.68), private vs no insurance (HR = 0.73) and the academic research facility vs community cancer center (HR = 0.79). Significant predictors of all-cause mortality included age (HR = 1.04), tumor size (HR = 1.01), hormone receptor expression (HR = 0.8) and cancer stage I vs II, III, and IV at the time of diagnosis (HR = 1.5, 2.7, 4.4, 9.9 respectively). Other predictors of mortality include surgery (HR = 0.4), chemotherapy (HR = 0.8), radiation (HR = 0.8), and hormonal therapy (HR-0.8).
Conclusions: Socioeconomic factors, cancer stage, tumor characteristics (size and grade), and high Charlson-Dayo score contributed to higher mortality among male patients diagnosed with breast cancer. Surgery was most effective, followed by radiation, chemotherapy, and hormonal therapy. Patients with positive ER or PR expression demonstrated better survival. Adjusting for socioeconomic factors, biomarker identification and timely, appropriately chosen treatment are likely to reduce the risk for mortality.
Keywords: Epidemiology; Male breast; Mortality; NCBD database; Survival.
Copyright © 2020. Published by Elsevier Ltd.
Conflict of interest statement
Declaration of competing interest None.
Figures
References
-
- Miao H., Verkooijen H.M., Chia K.S. Incidence and outcome of male breast cancer: an international population-based study. J Clin Oncol. 2011;29(33):4381–4386. - PubMed
-
- Noone A.M., Howlader N., Krapcho M. SEER web site. National Cancer Institute; Bethesda, MD: April 2018. SEER cancer statistics review; pp. 1975–2015.https://seercancergov/csr/1975_2015/ Based on November 2017 SEER data submission.
-
- DeSantis C.E., Ma J., Gaudet M.M. Breast cancer statistics. CA A Cancer J Clin. 2019;69(6):438–451. 2019. - PubMed
-
- Giordano S.H. Breast cancer in men. N Engl J Med. 2018;378(24):2311–2320. - PubMed
MeSH terms
Substances
LinkOut - more resources
Full Text Sources
Medical
Research Materials
