. 2020 Dec;588(7838):459-465.
doi: 10.1038/s41586-020-2709-7. Epub 2020 Aug 31.

Neurotoxic microglia promote TDP-43 proteinopathy in progranulin deficiency

Affiliations

Neurotoxic microglia promote TDP-43 proteinopathy in progranulin deficiency

Jiasheng Zhang et al. Nature. 2020 Dec.

Abstract

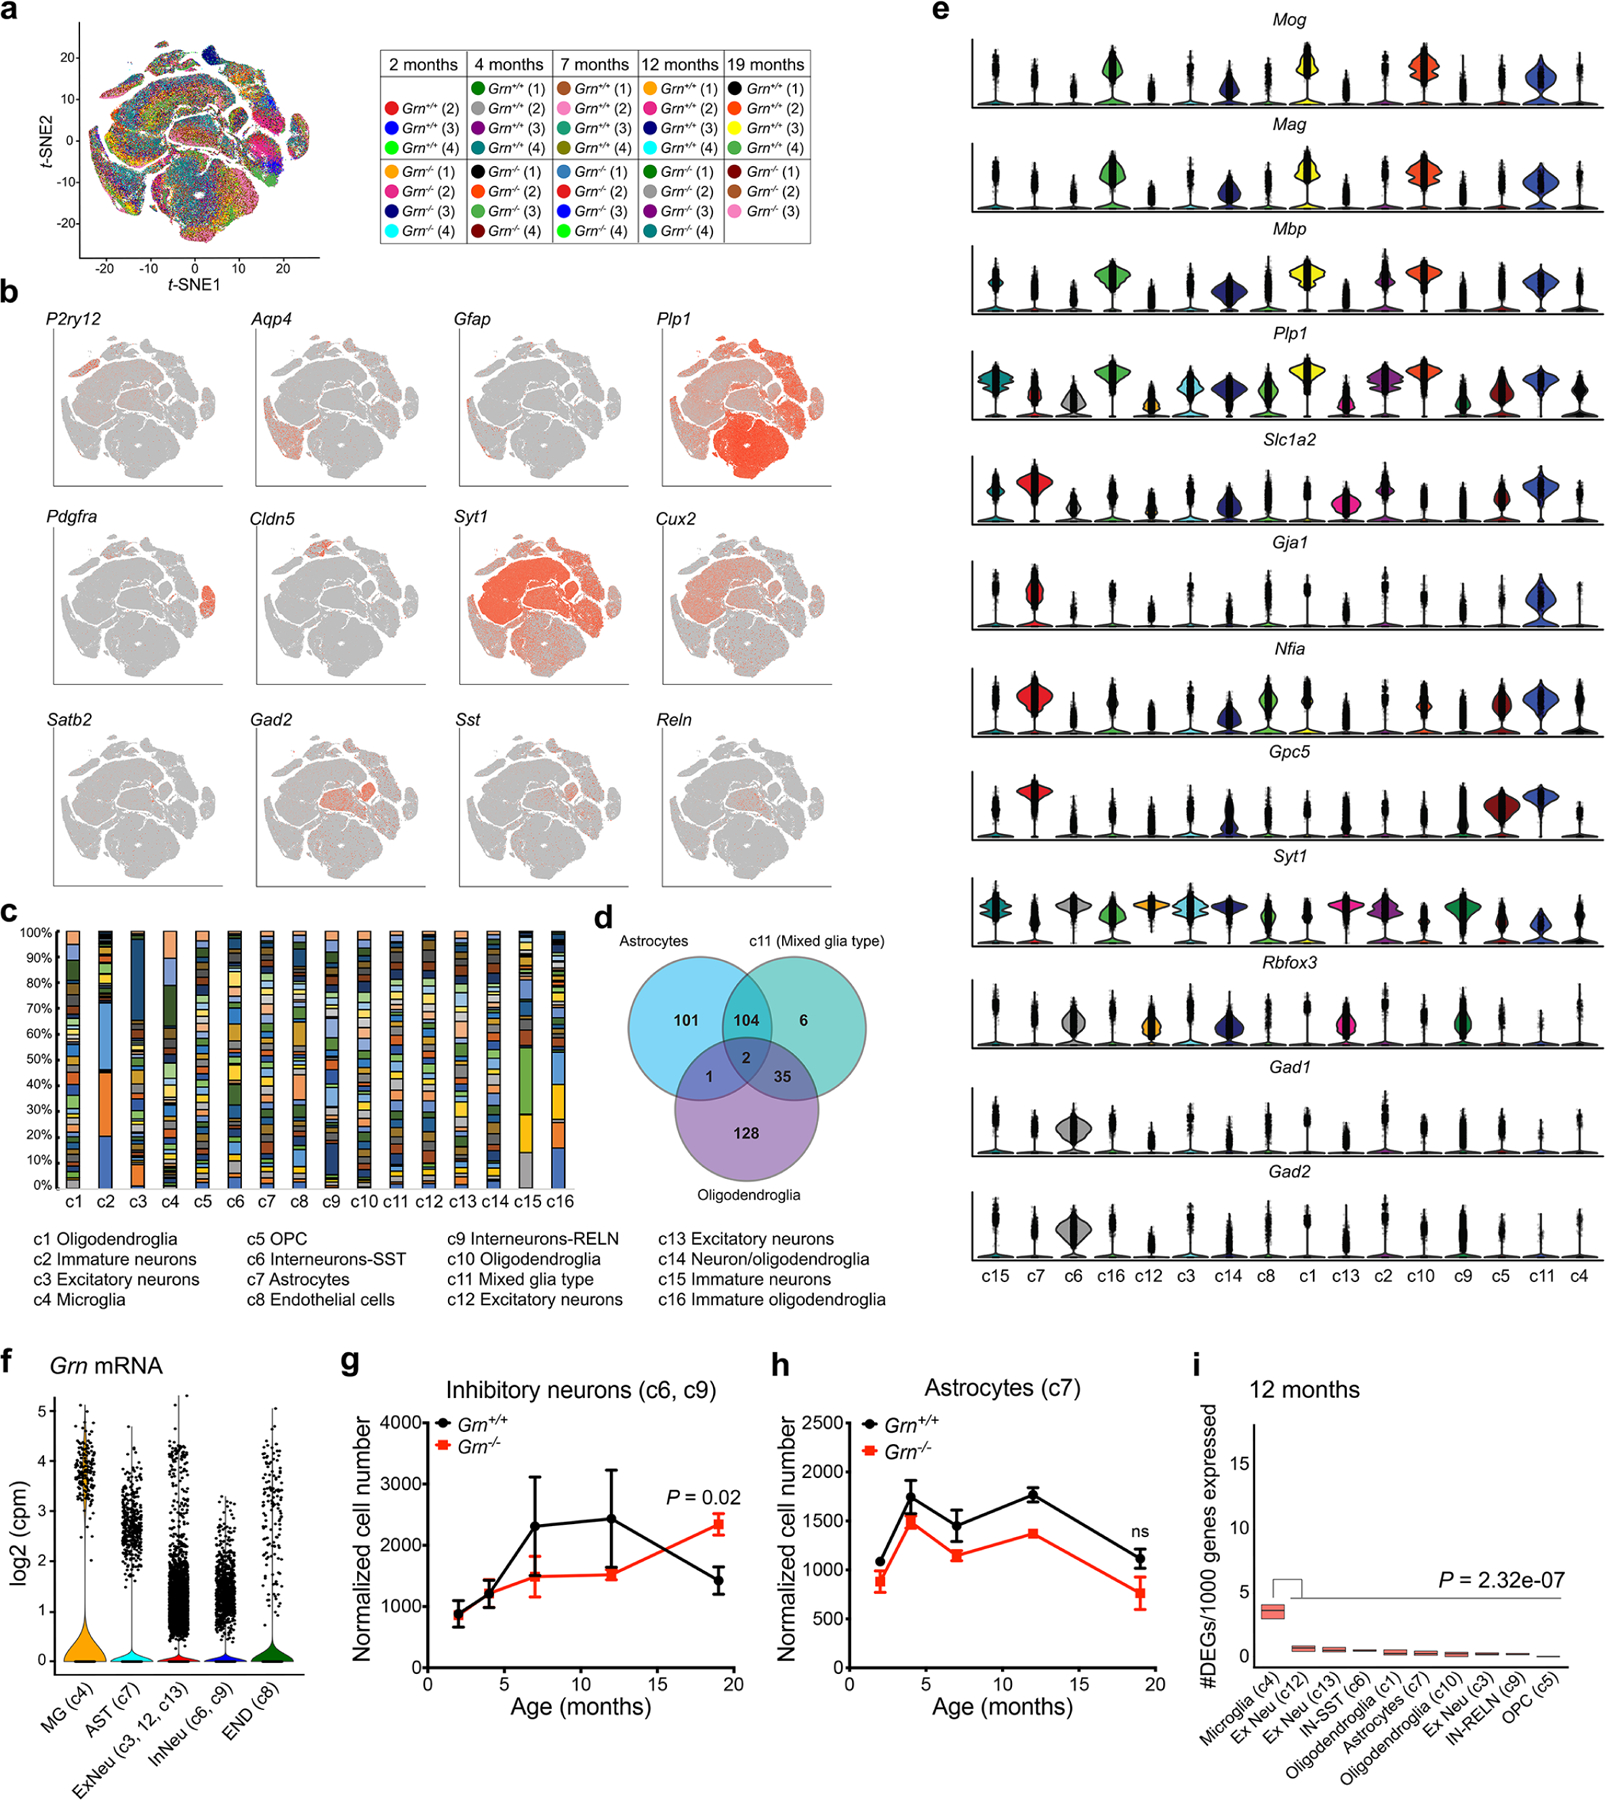
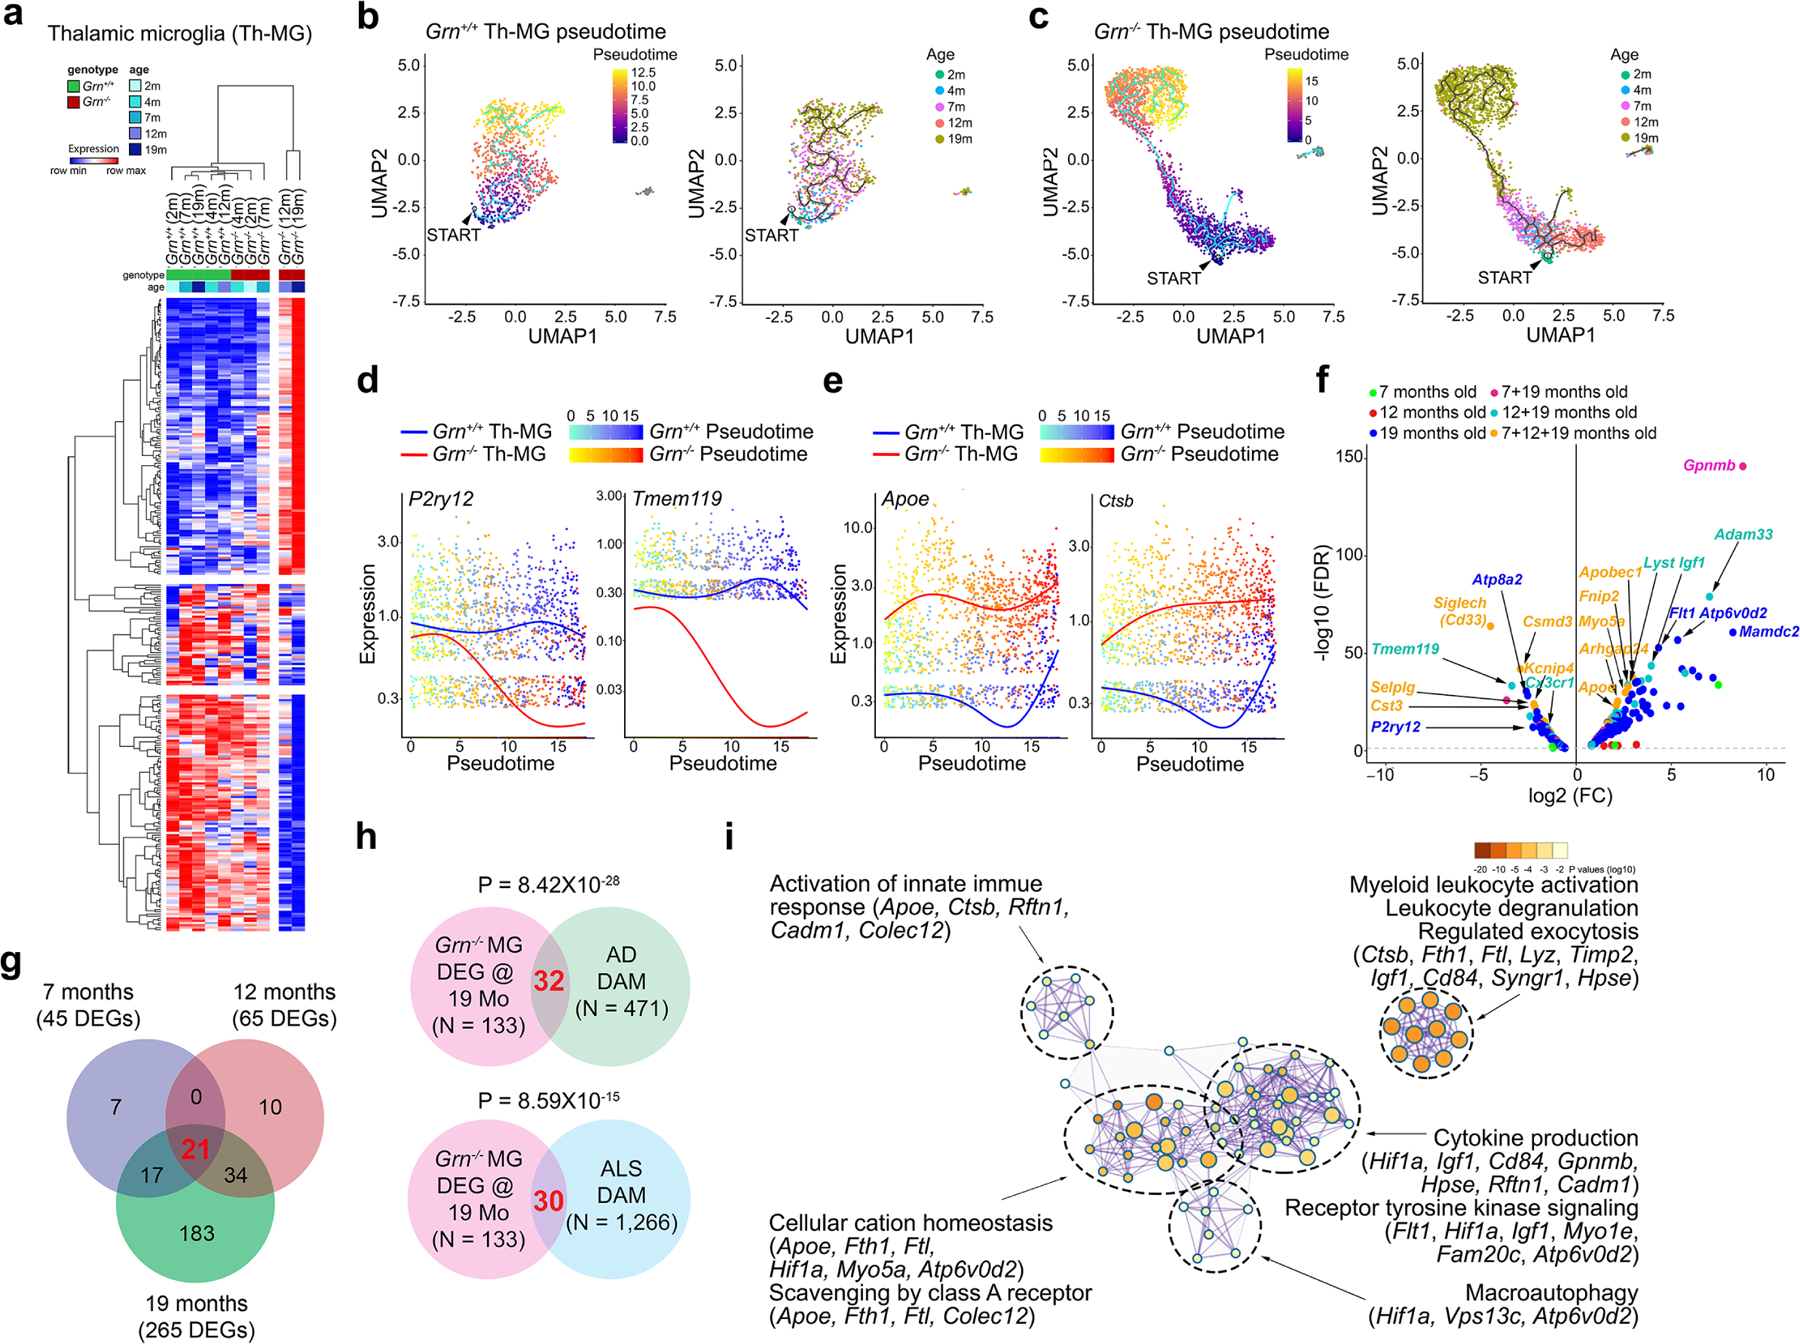
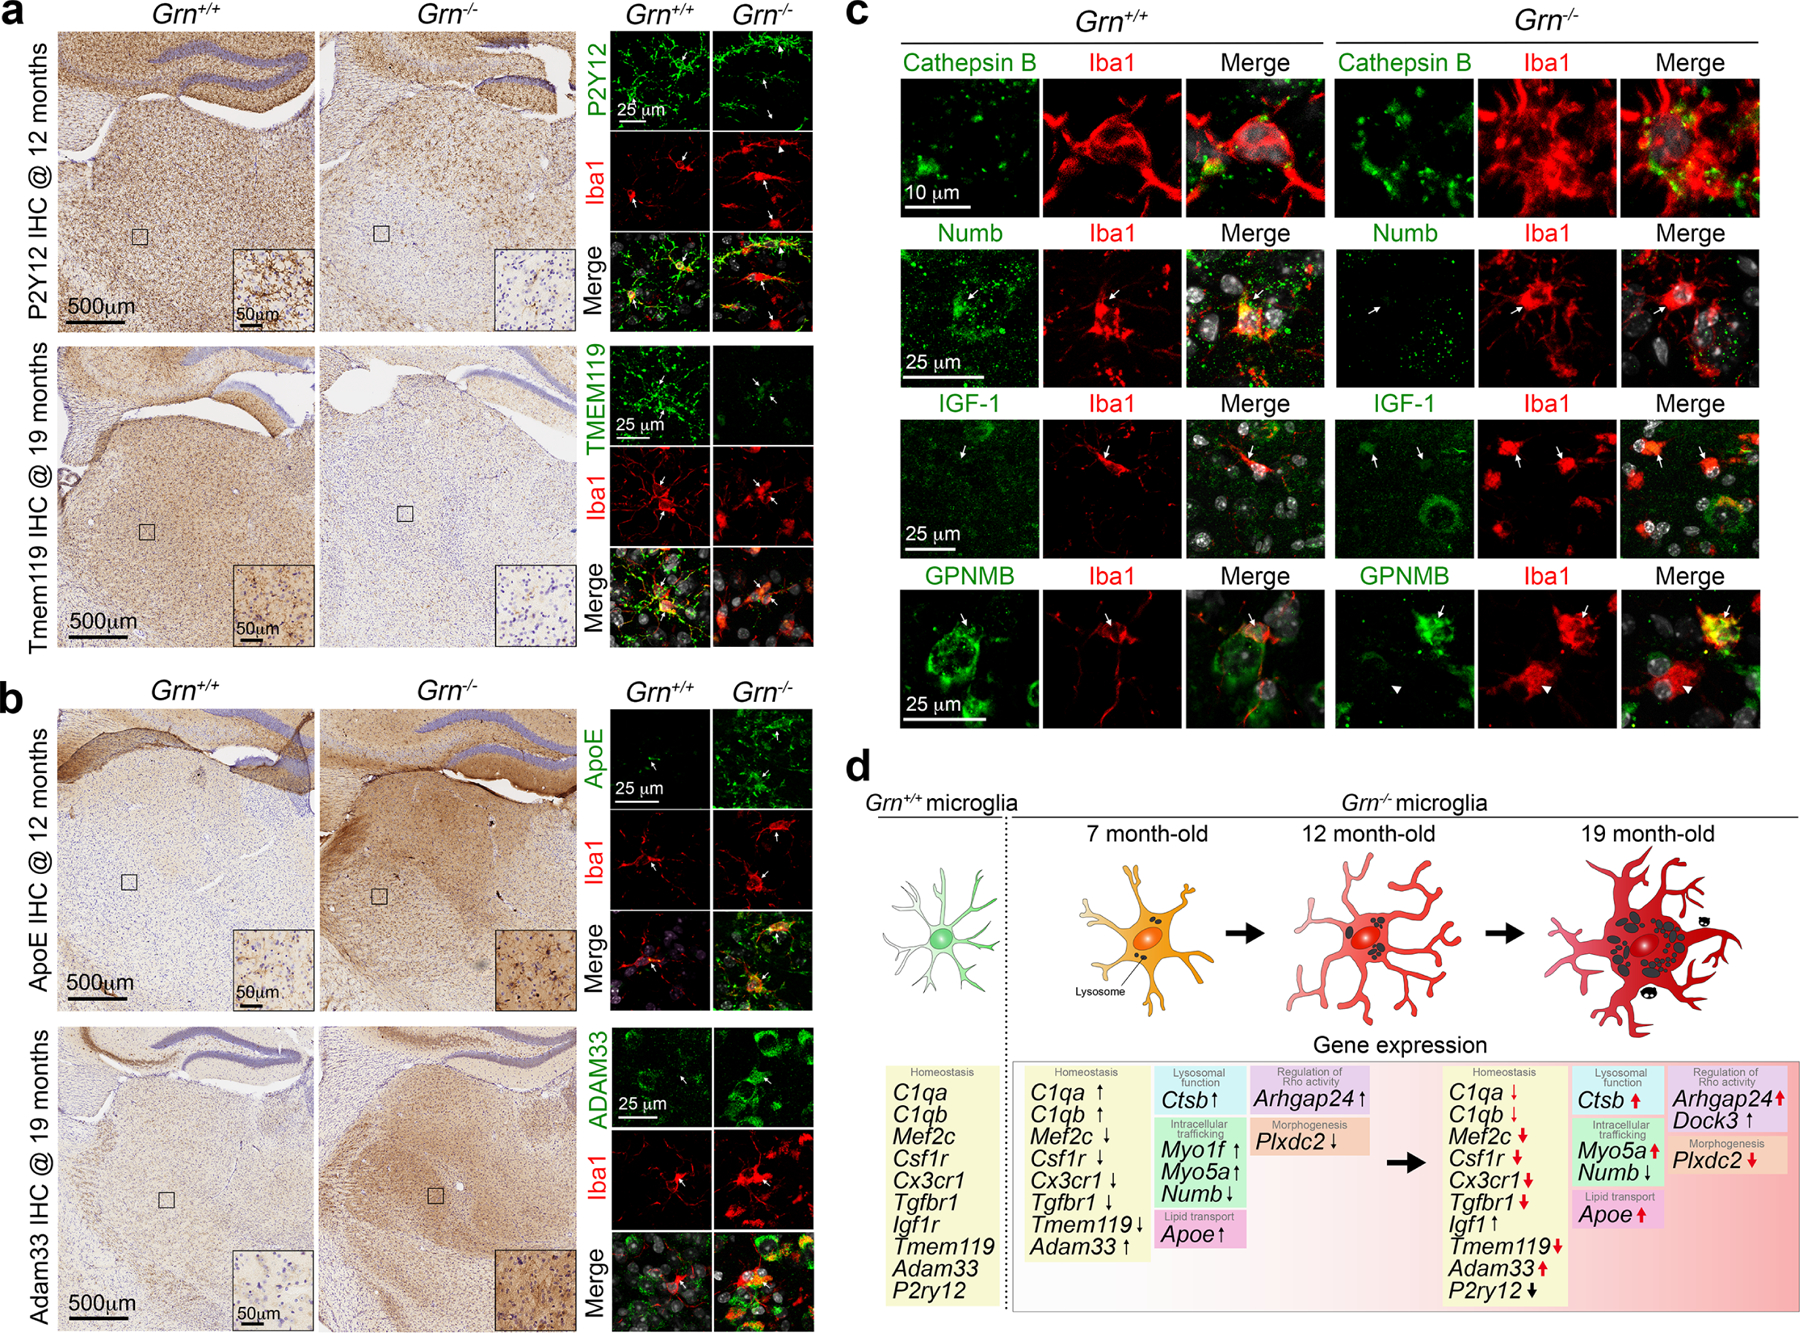
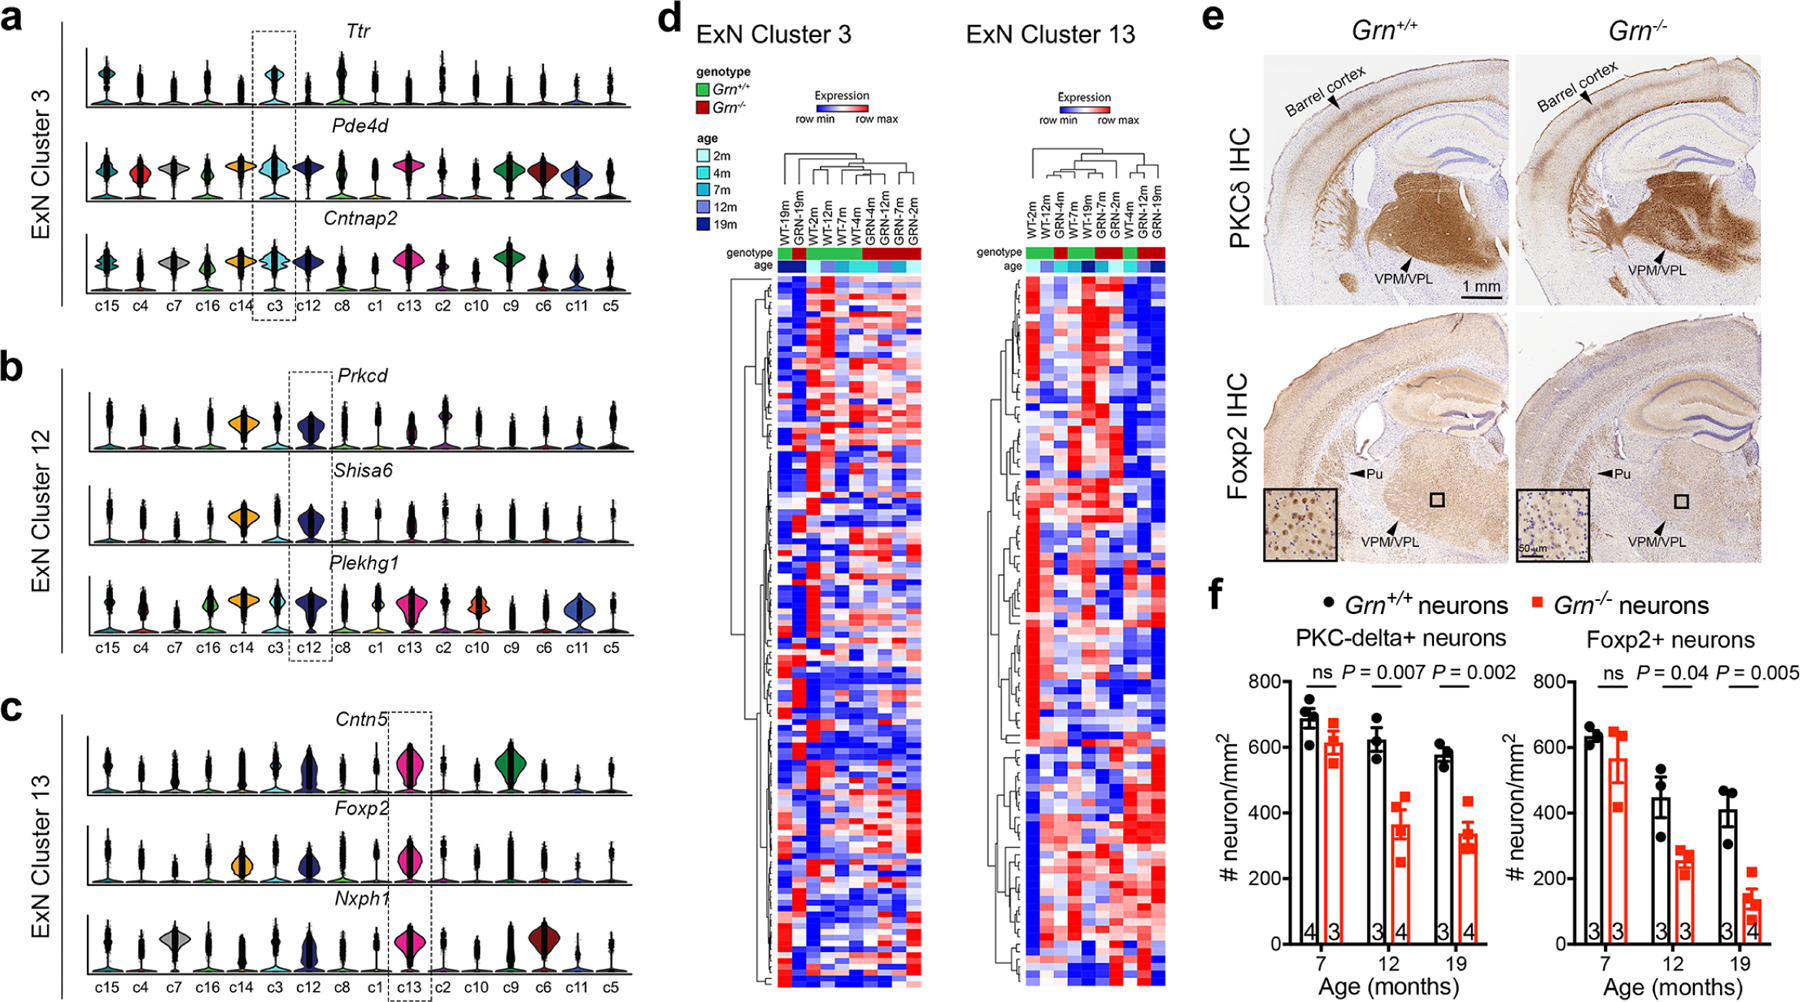
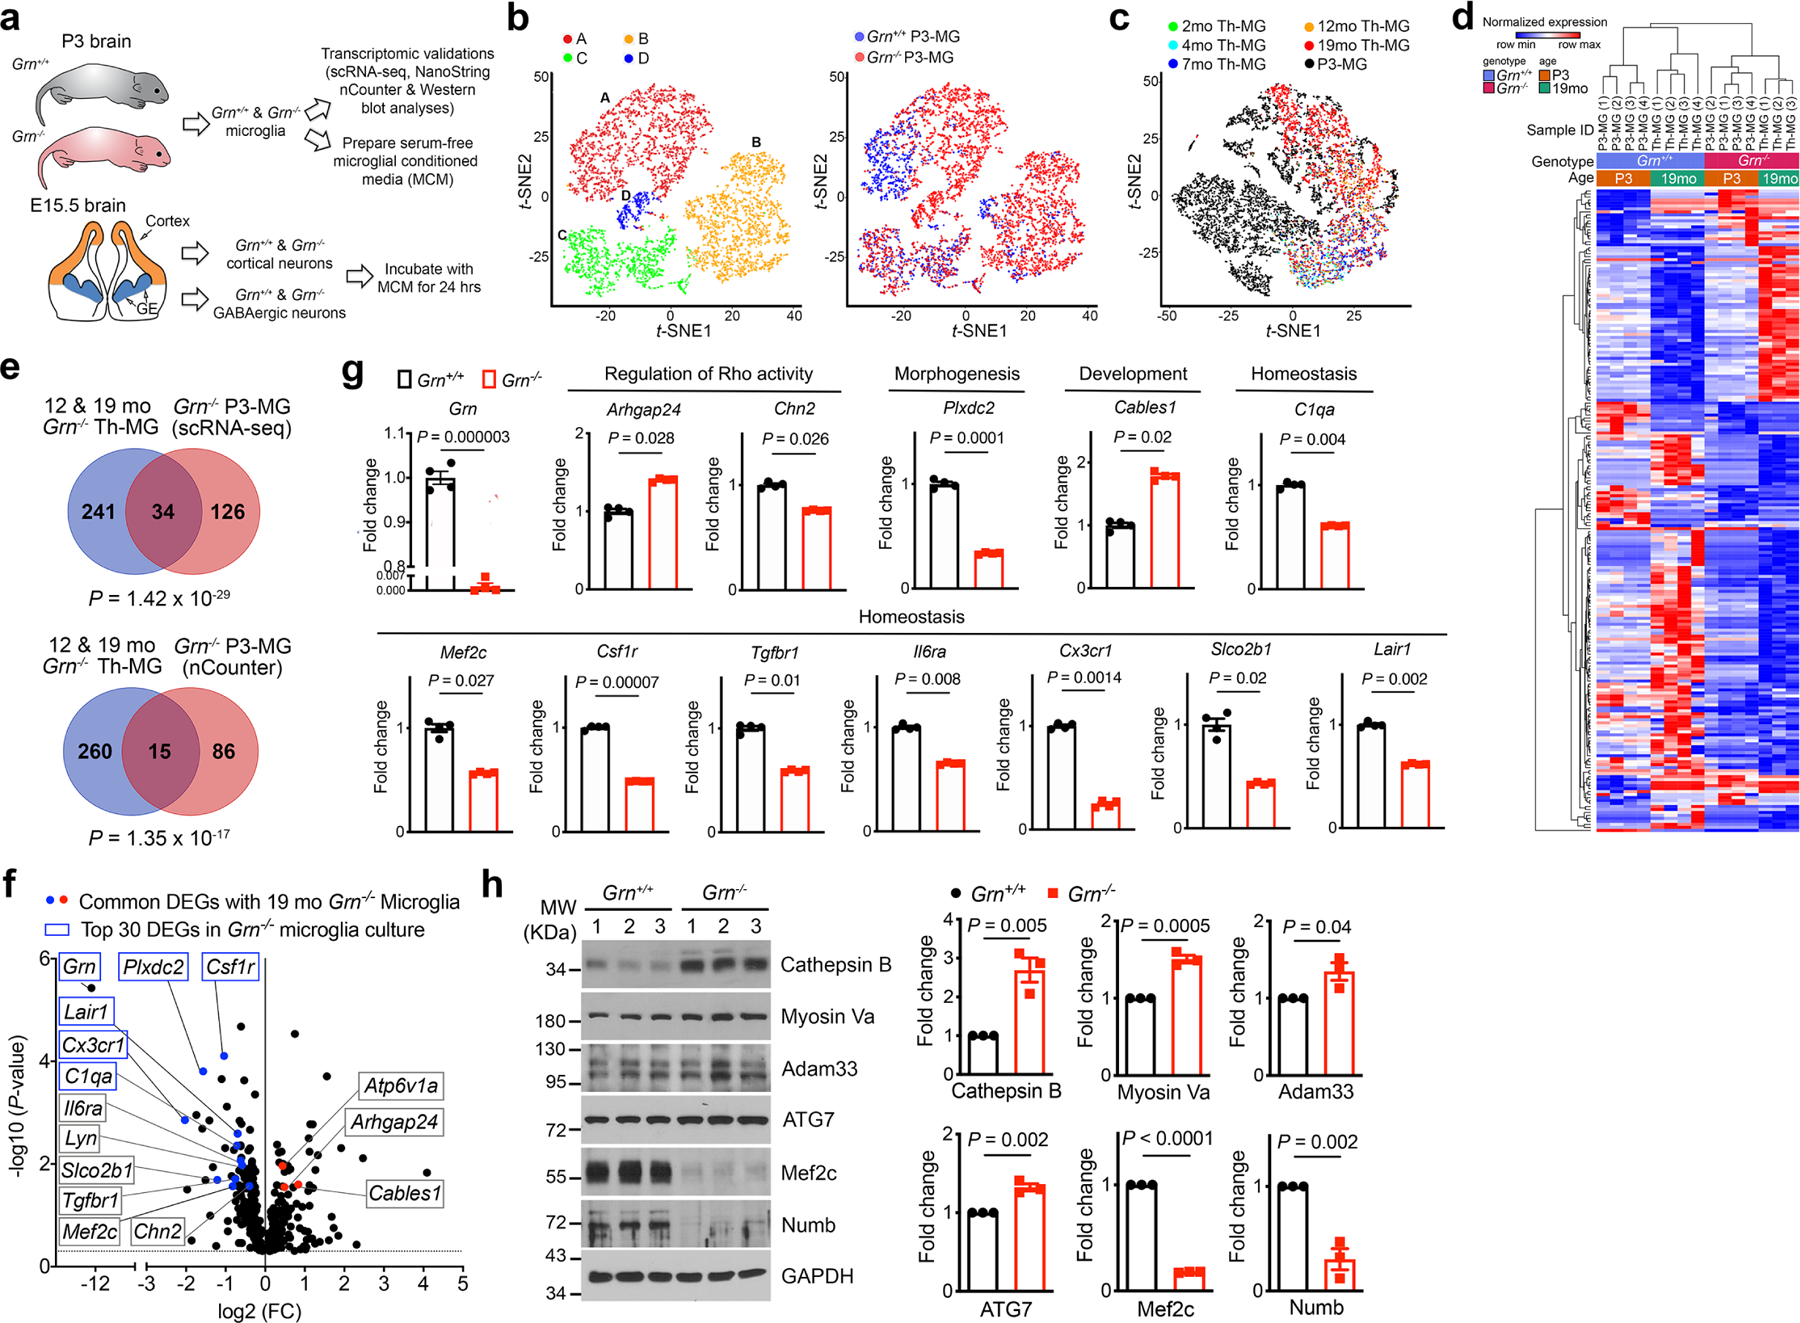
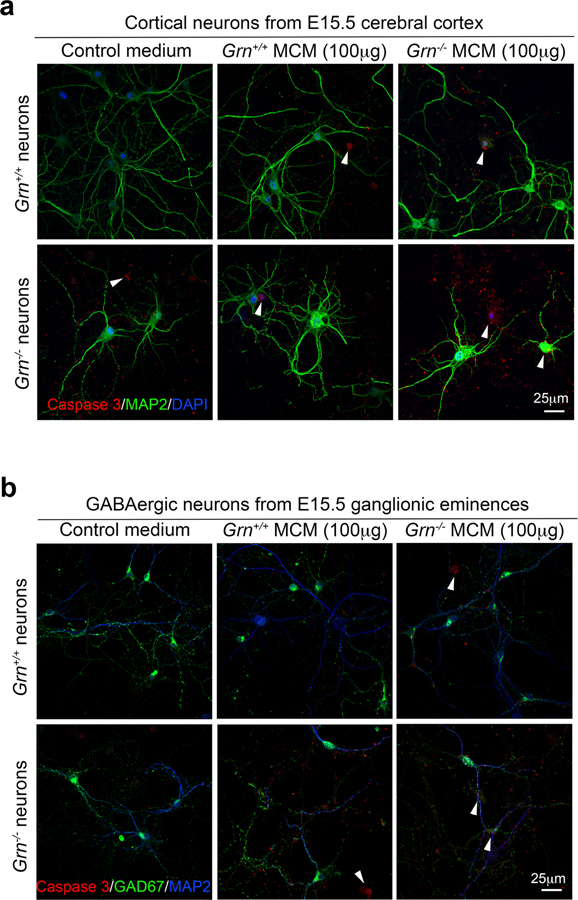
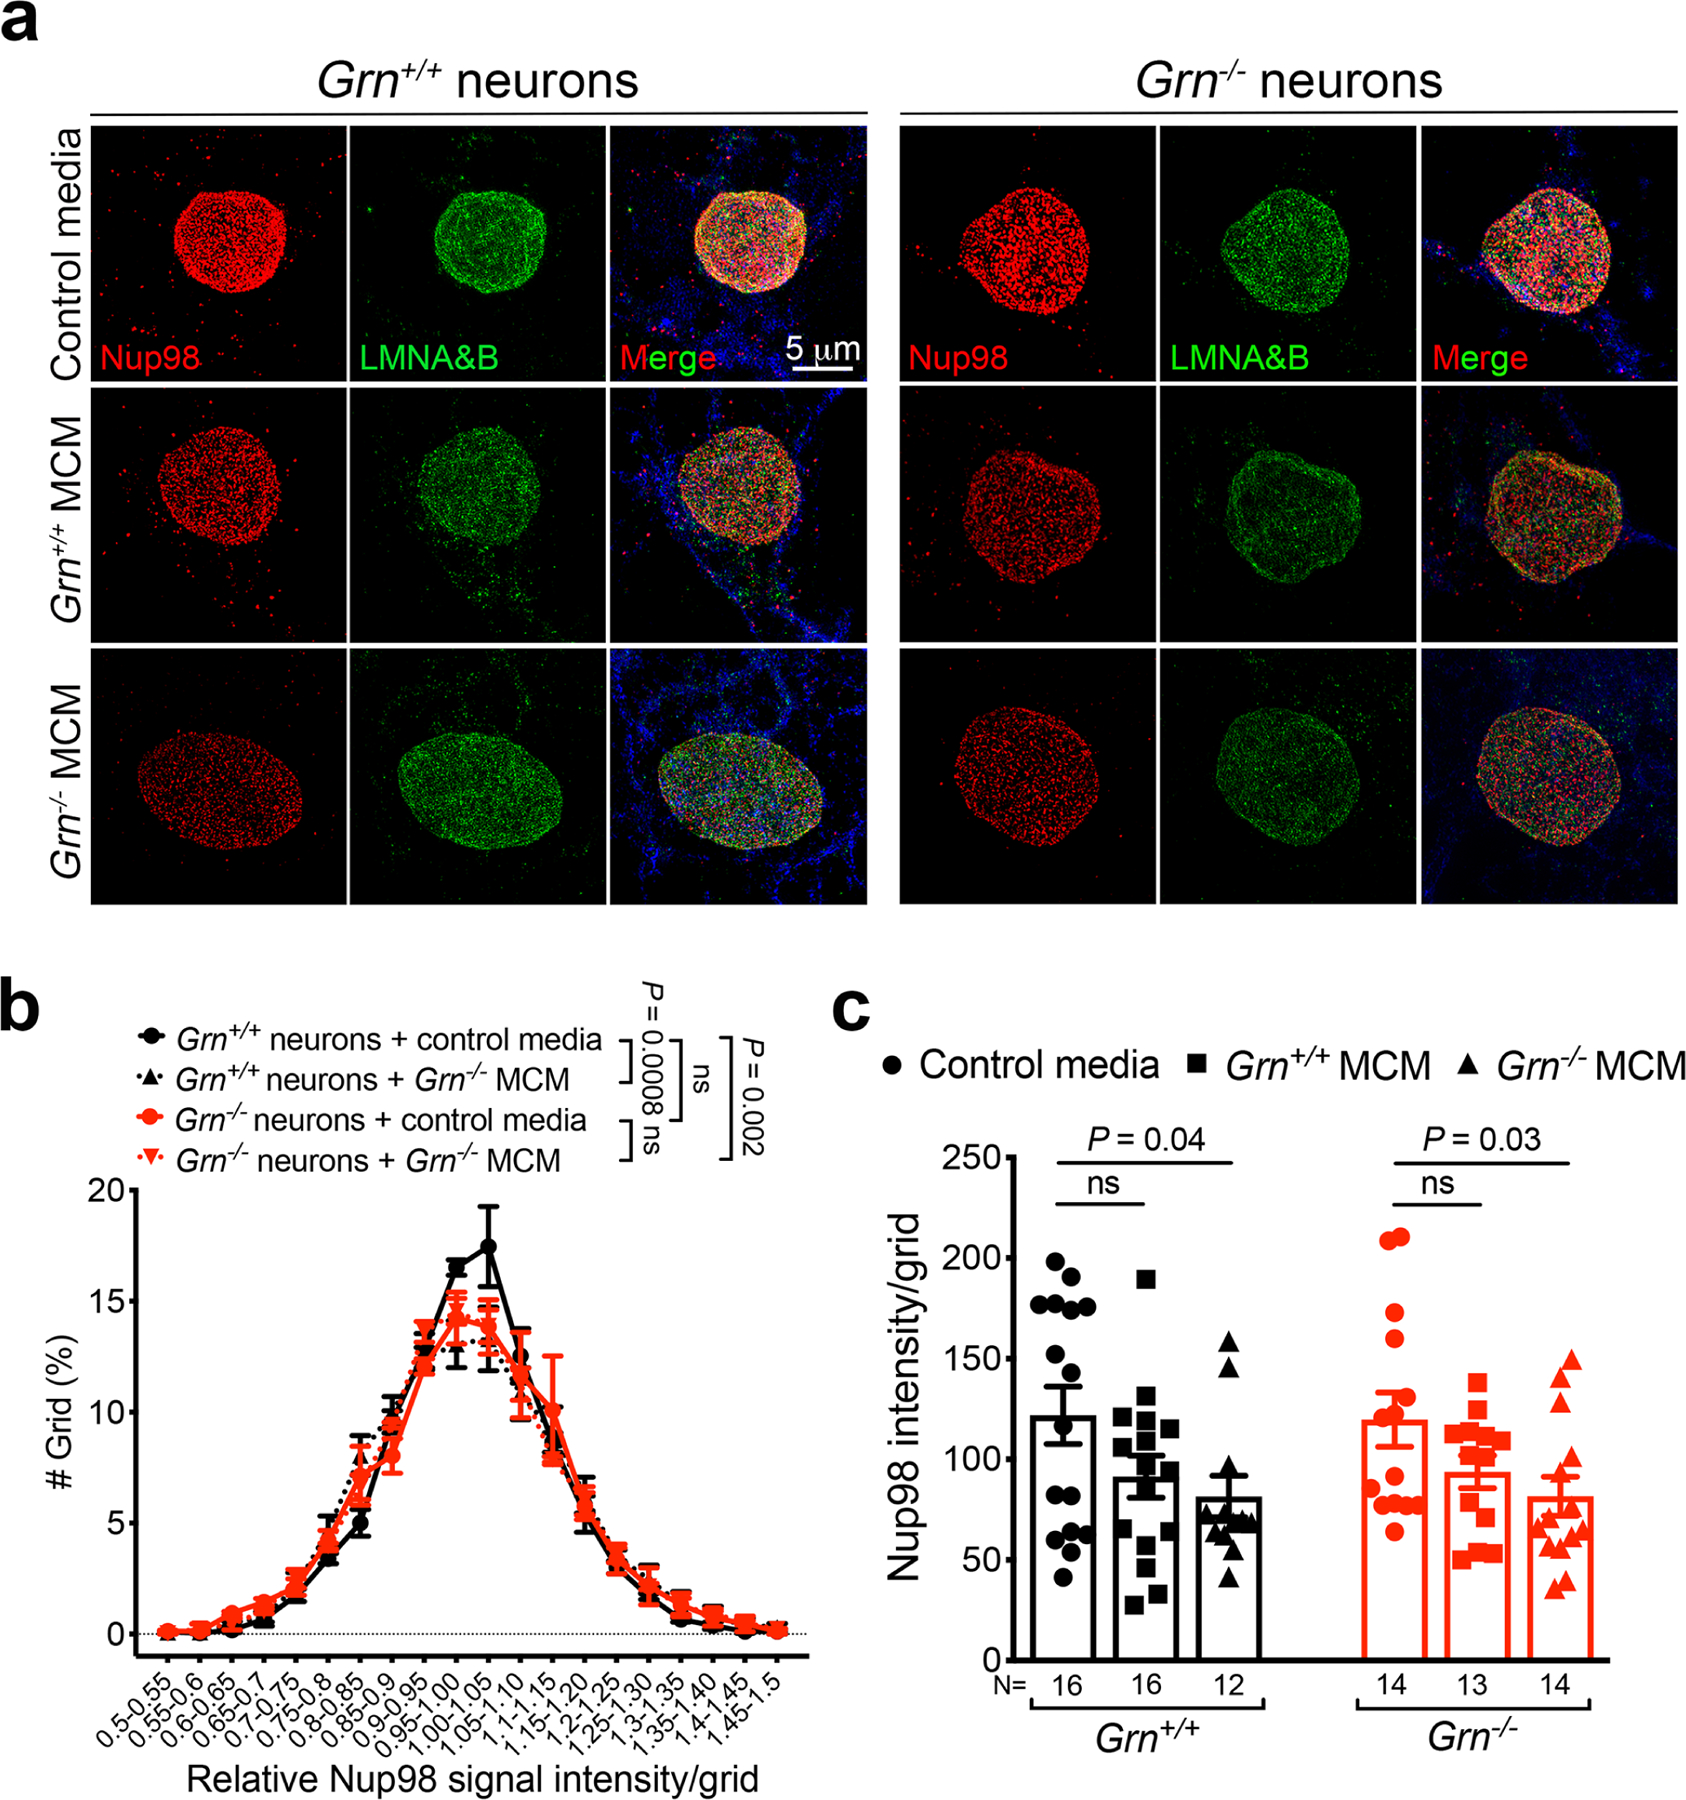
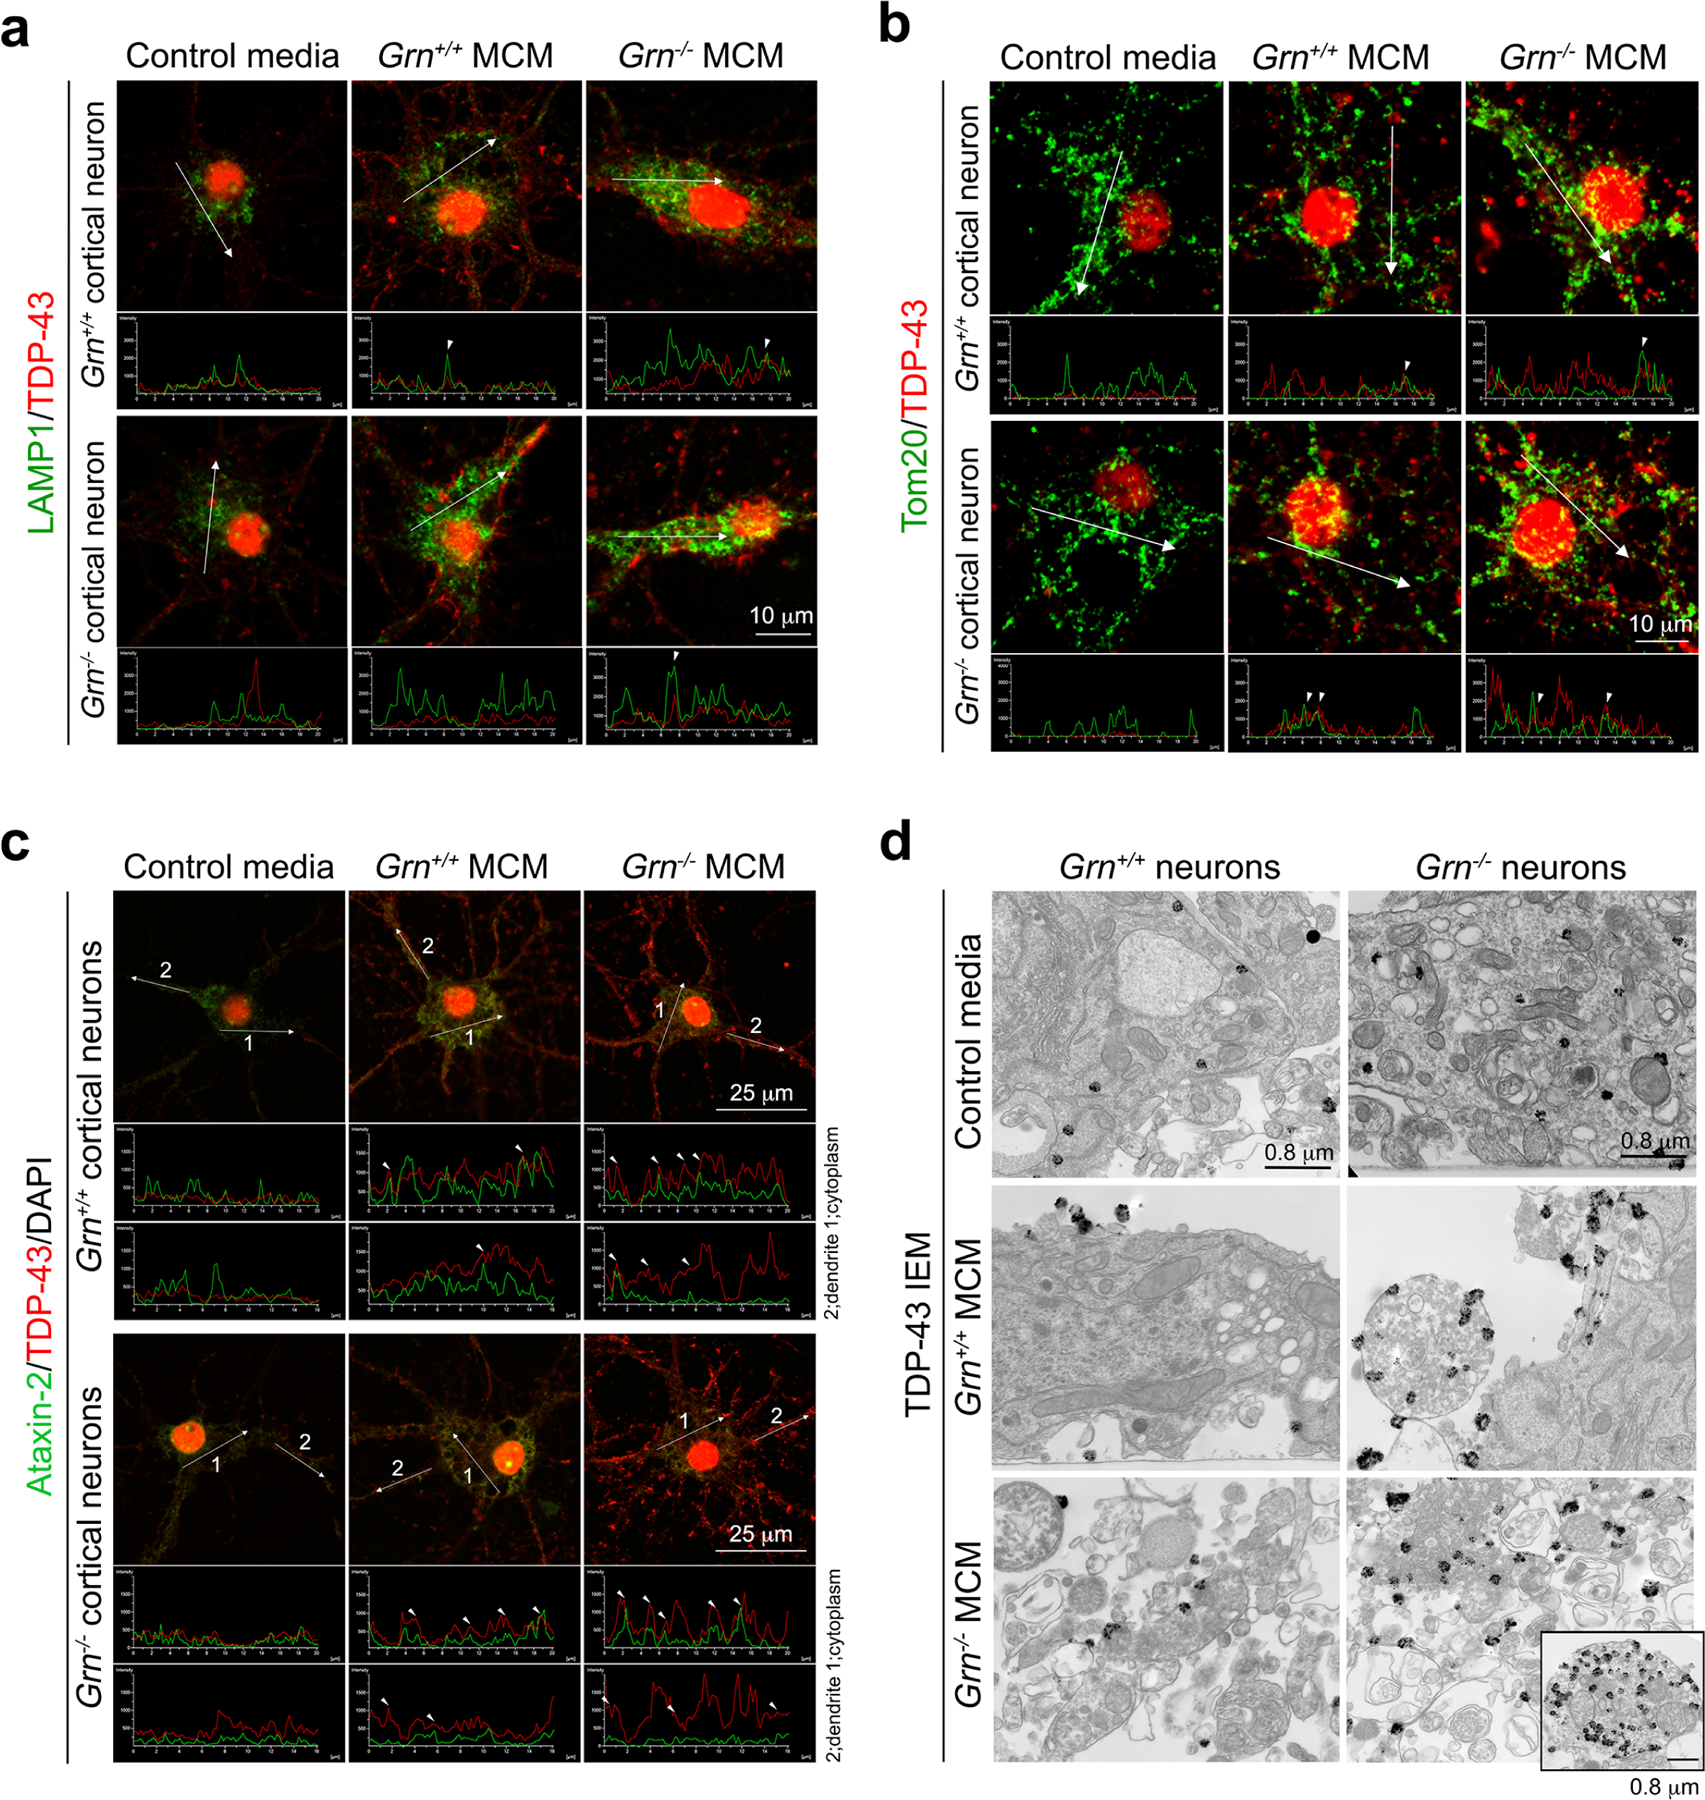
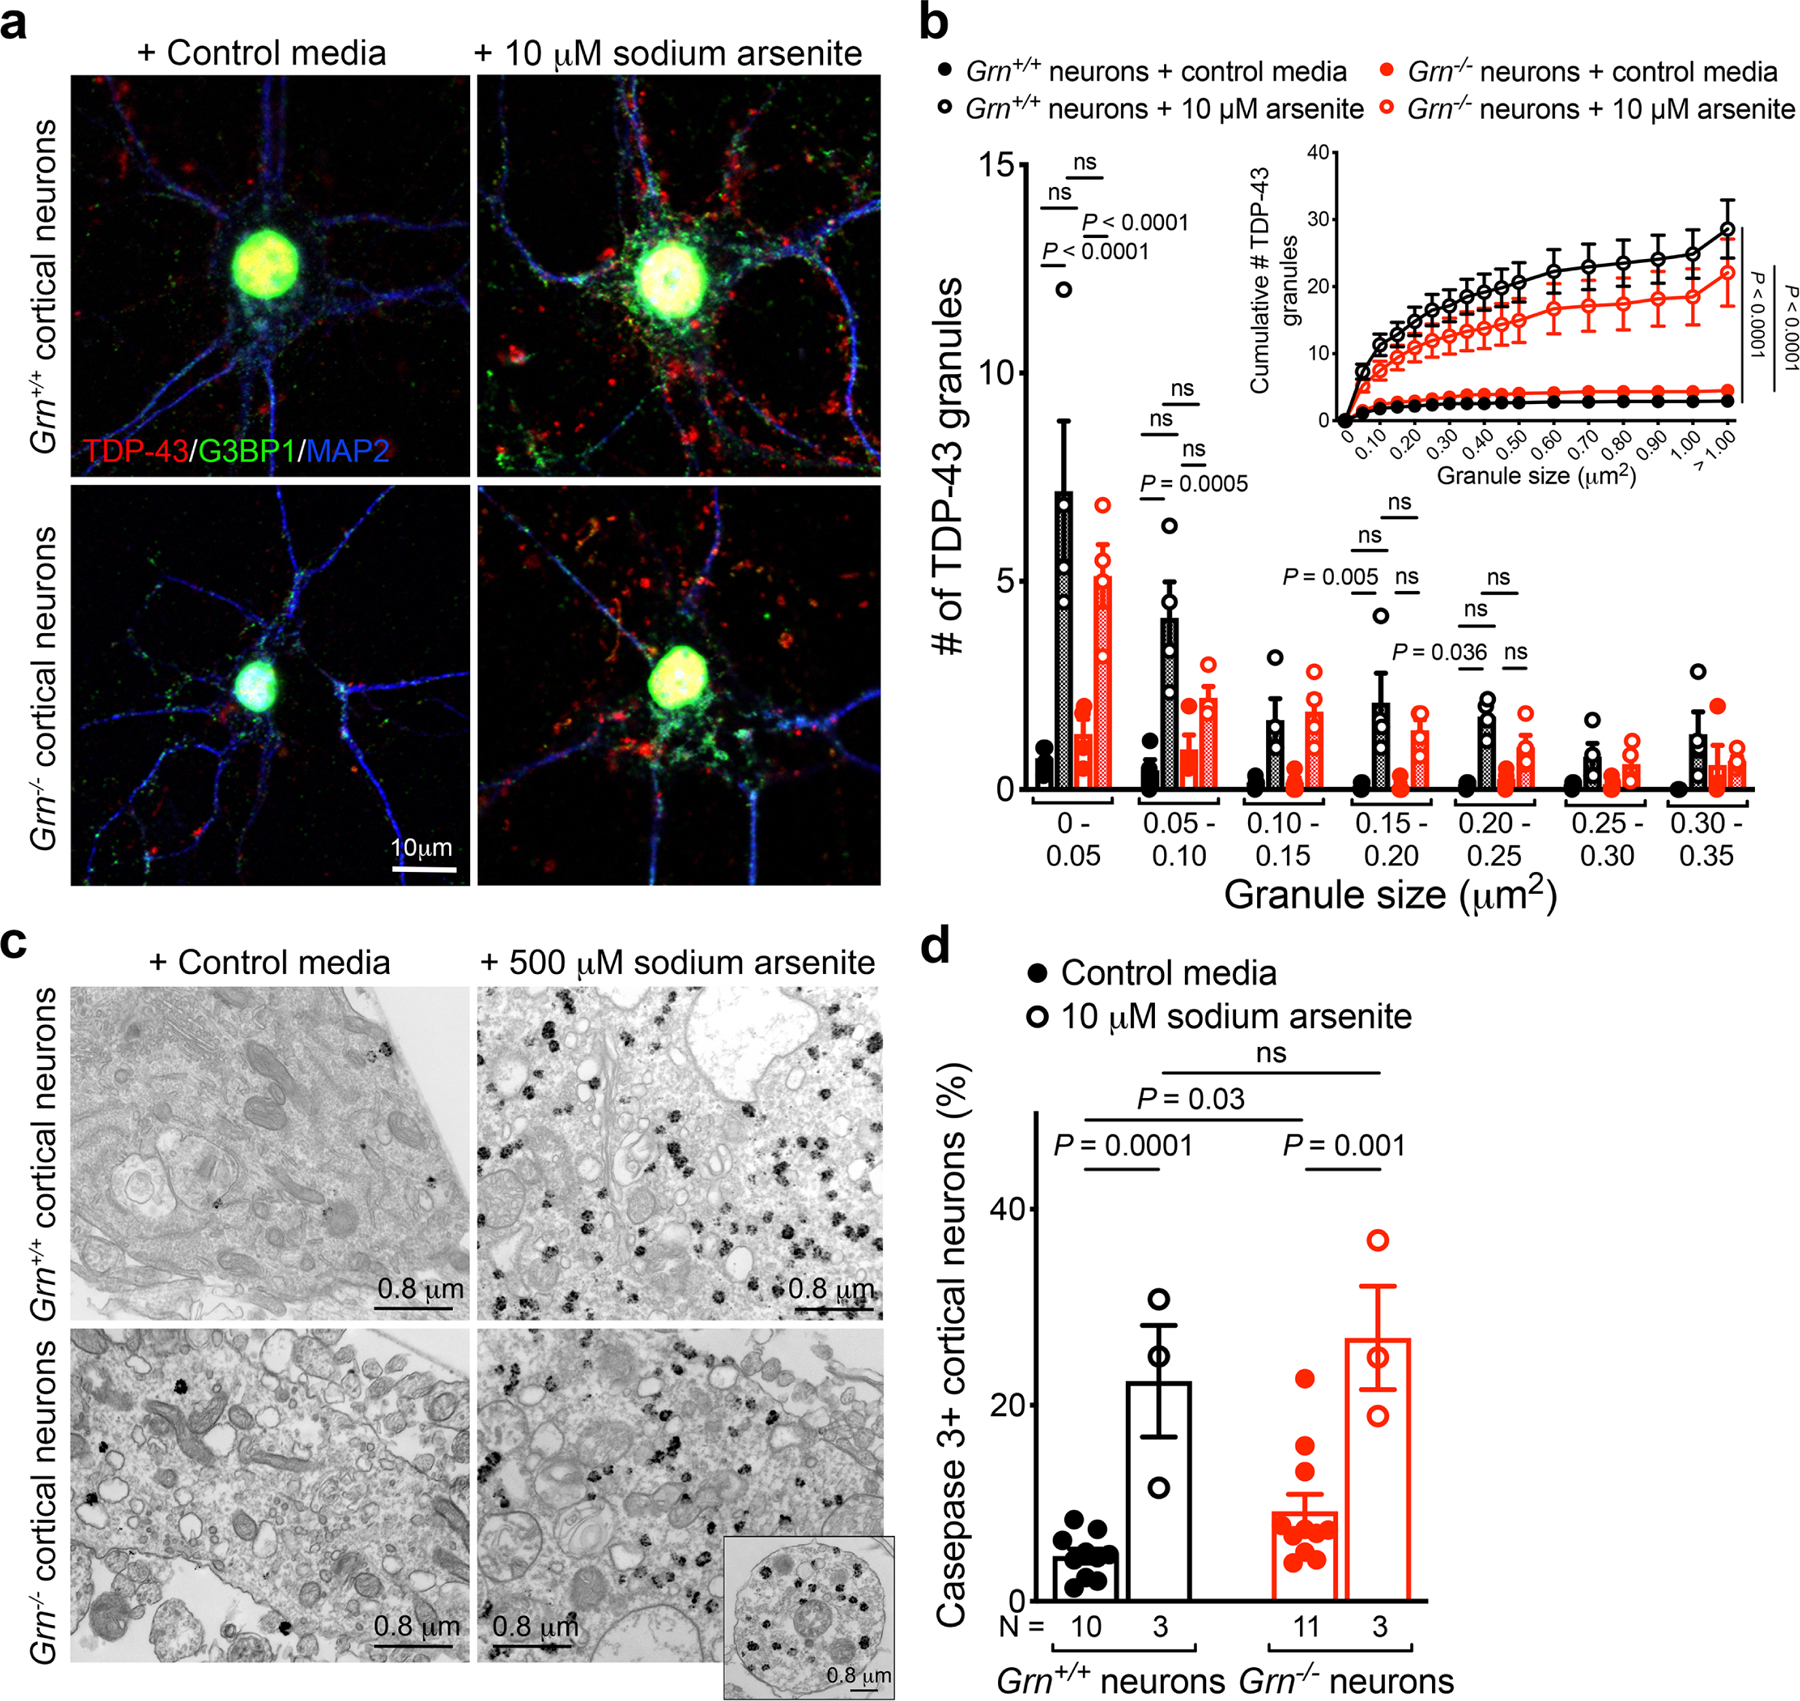
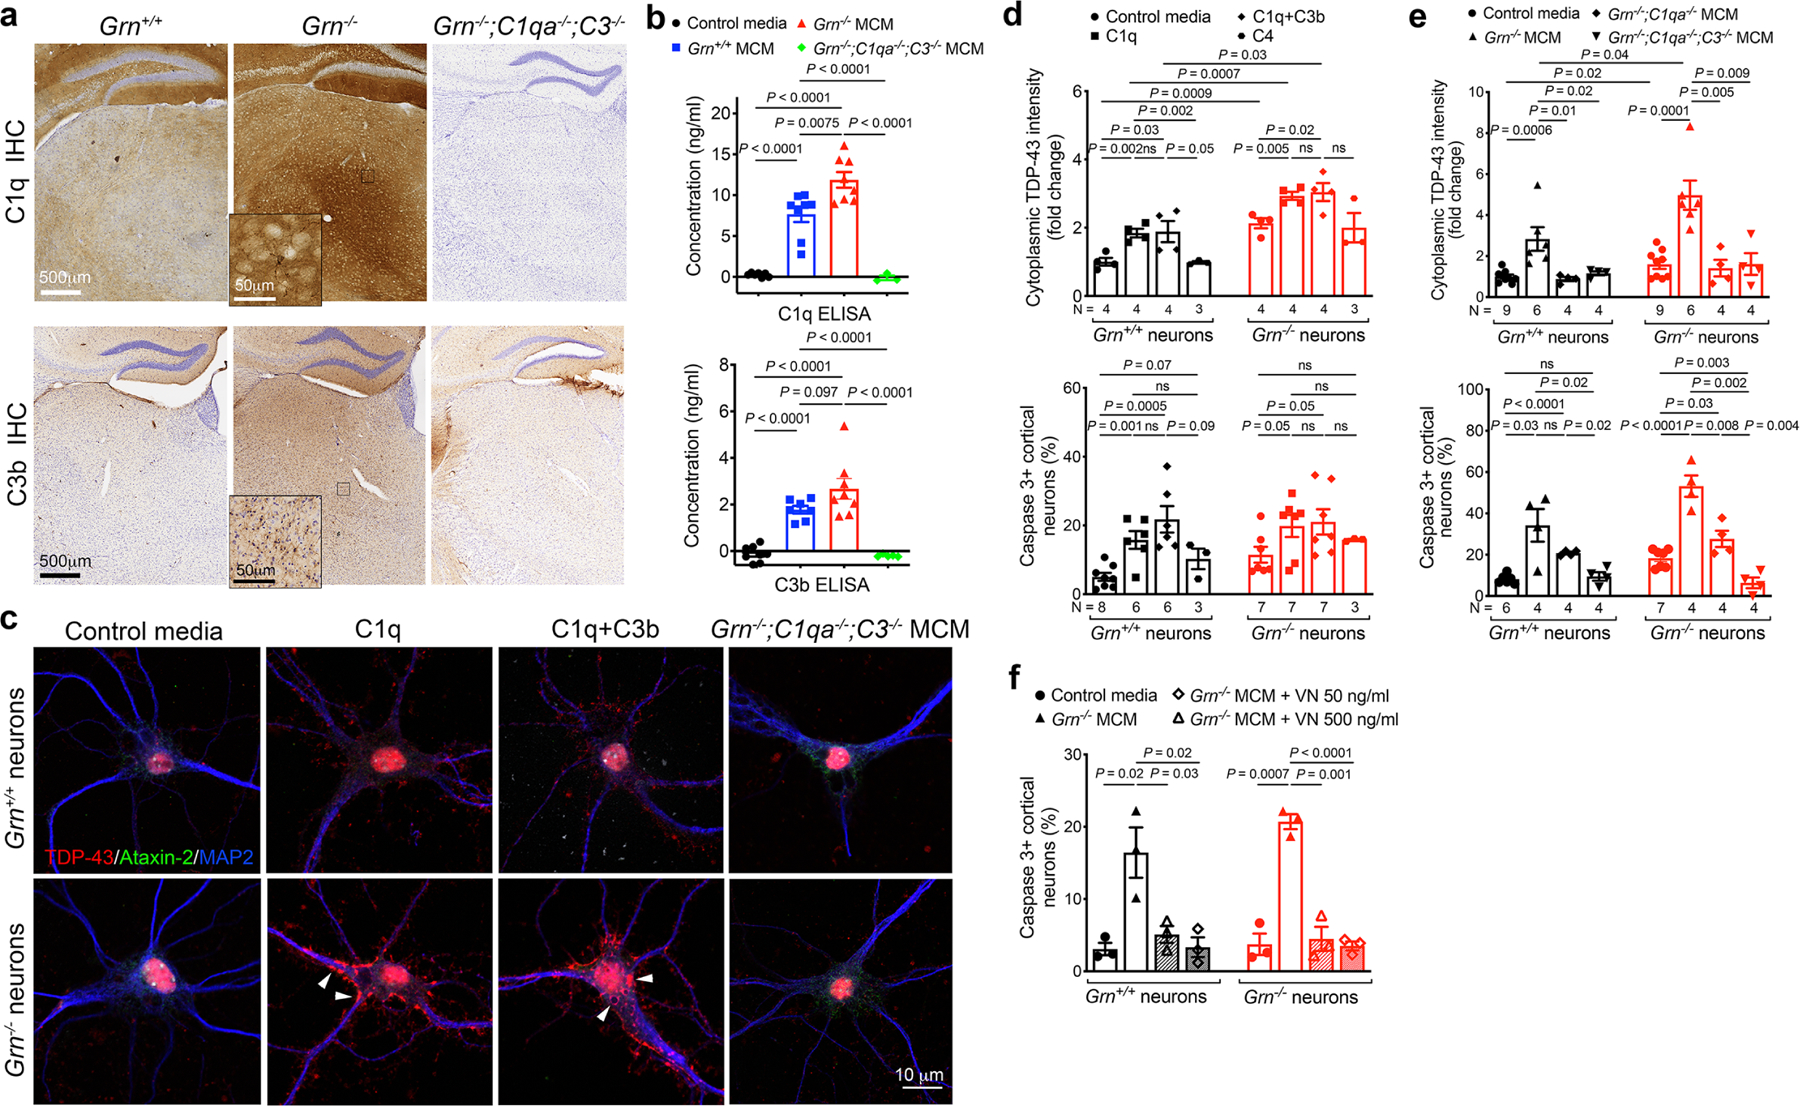
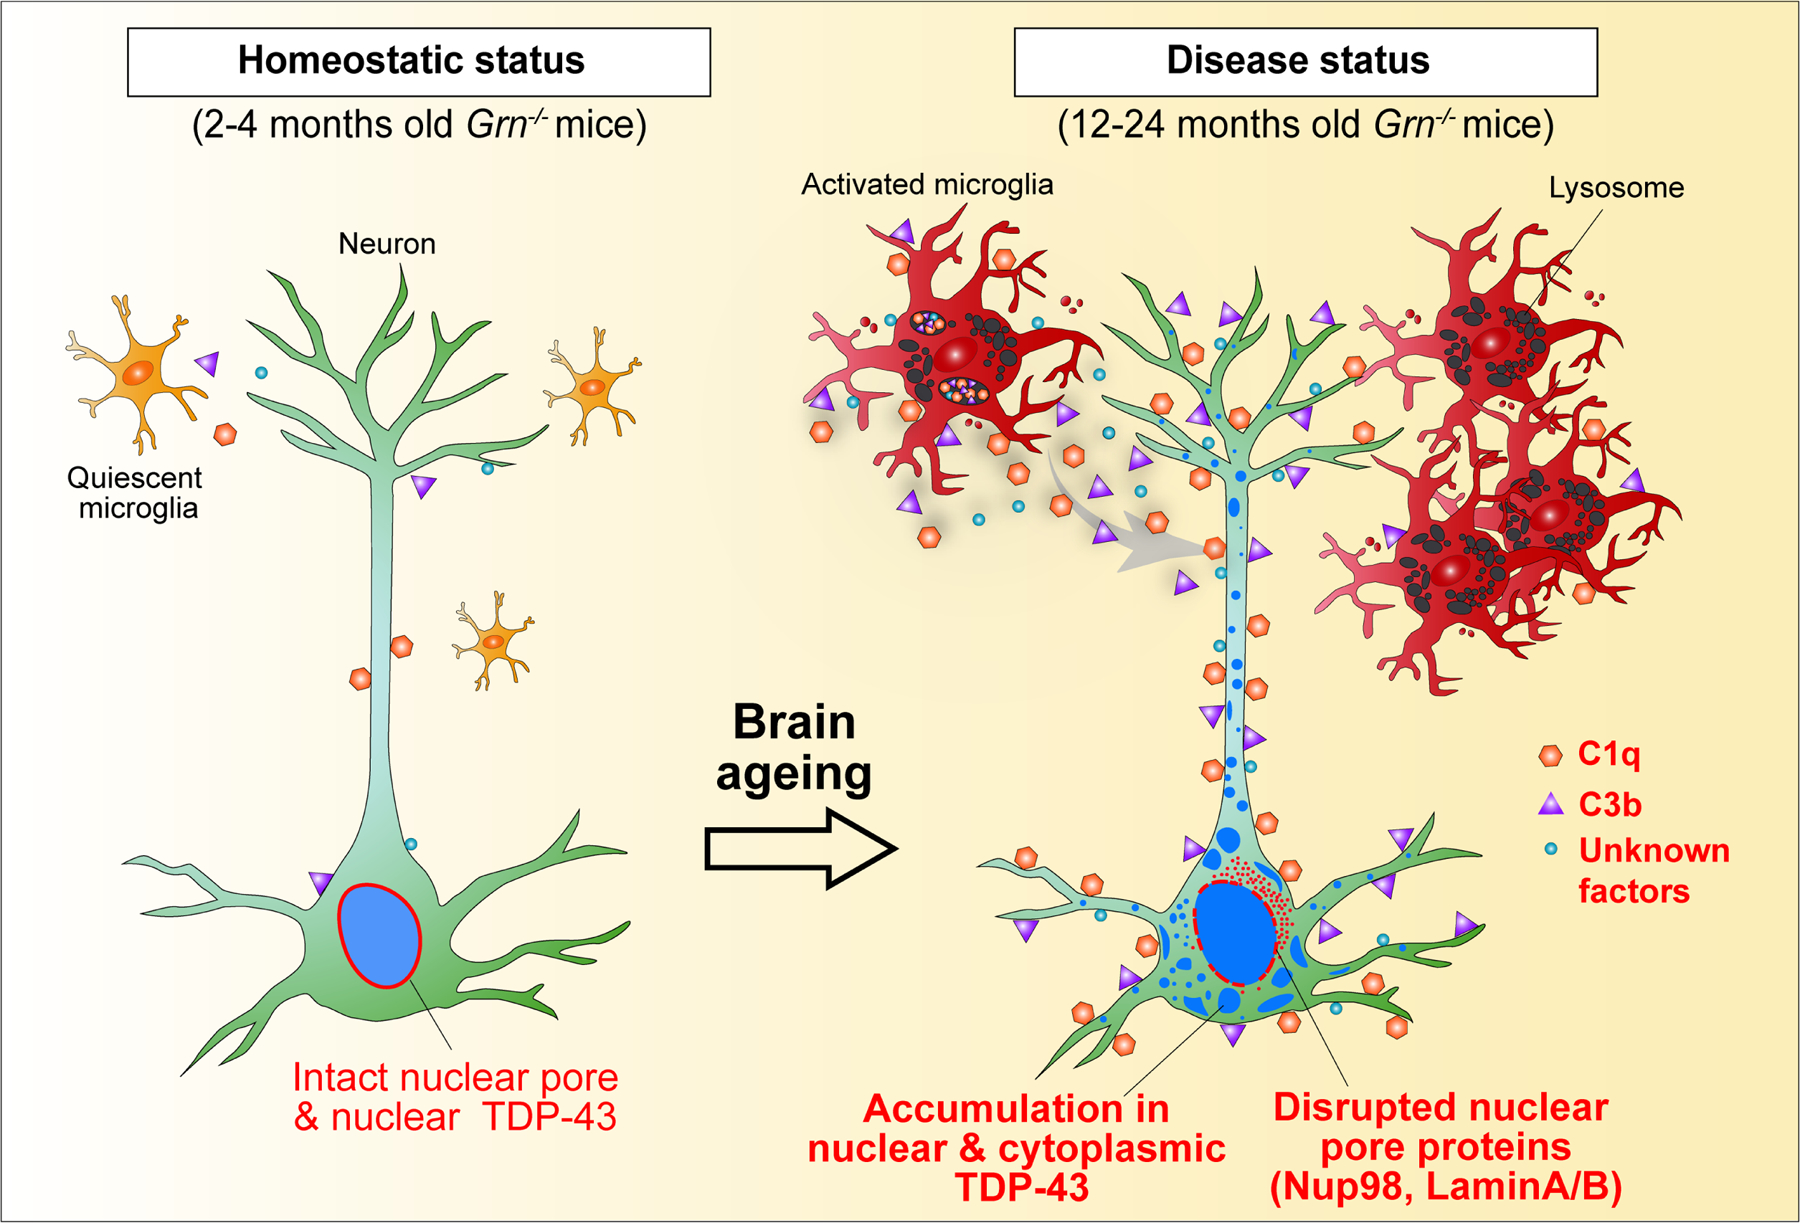
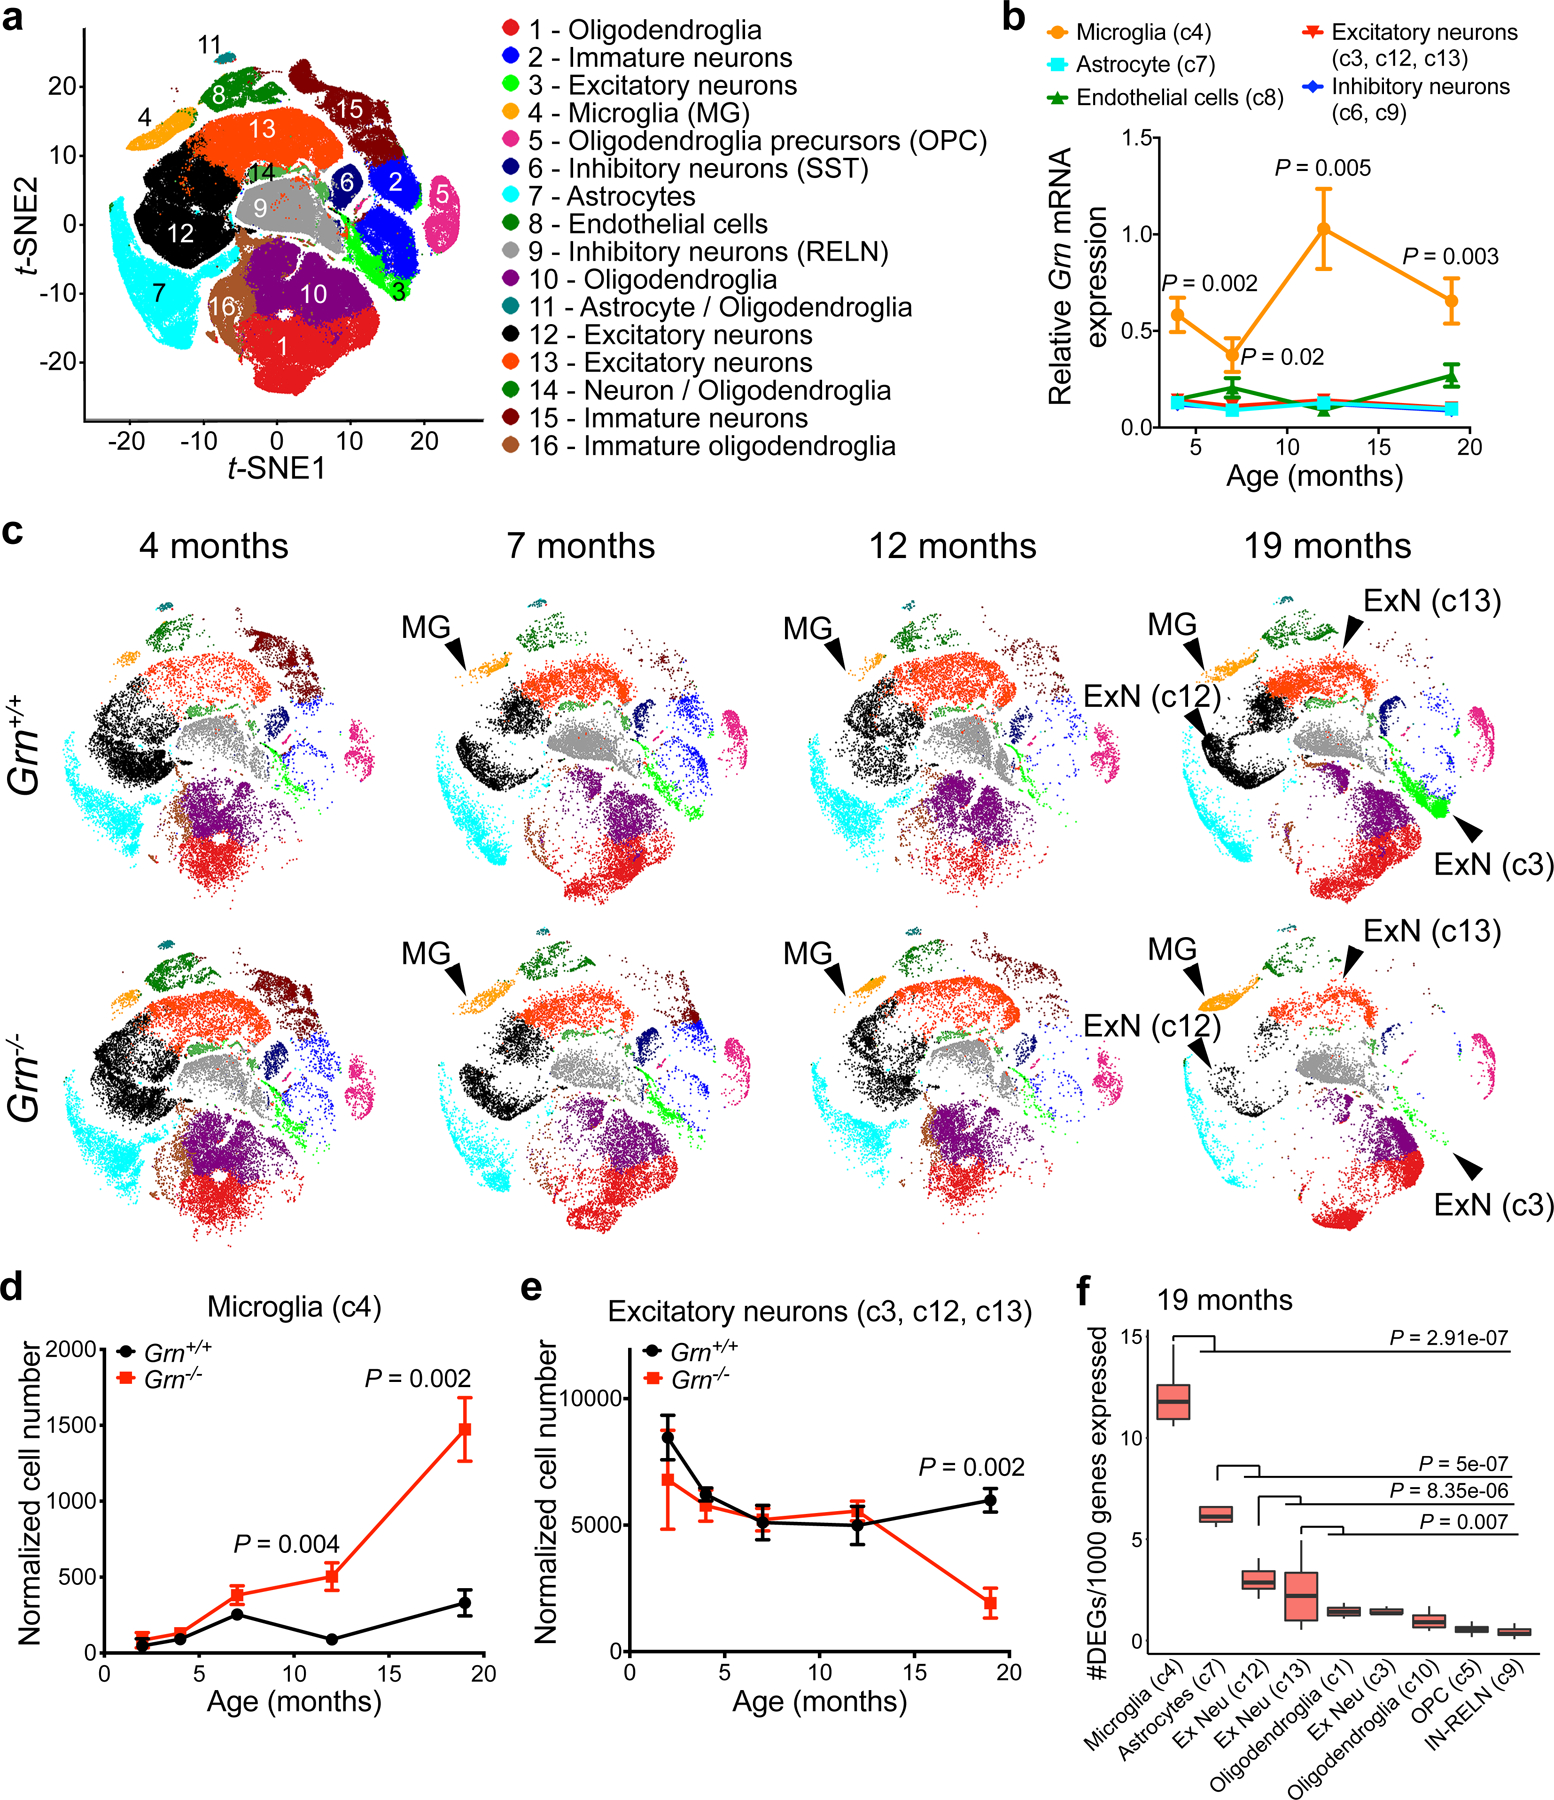
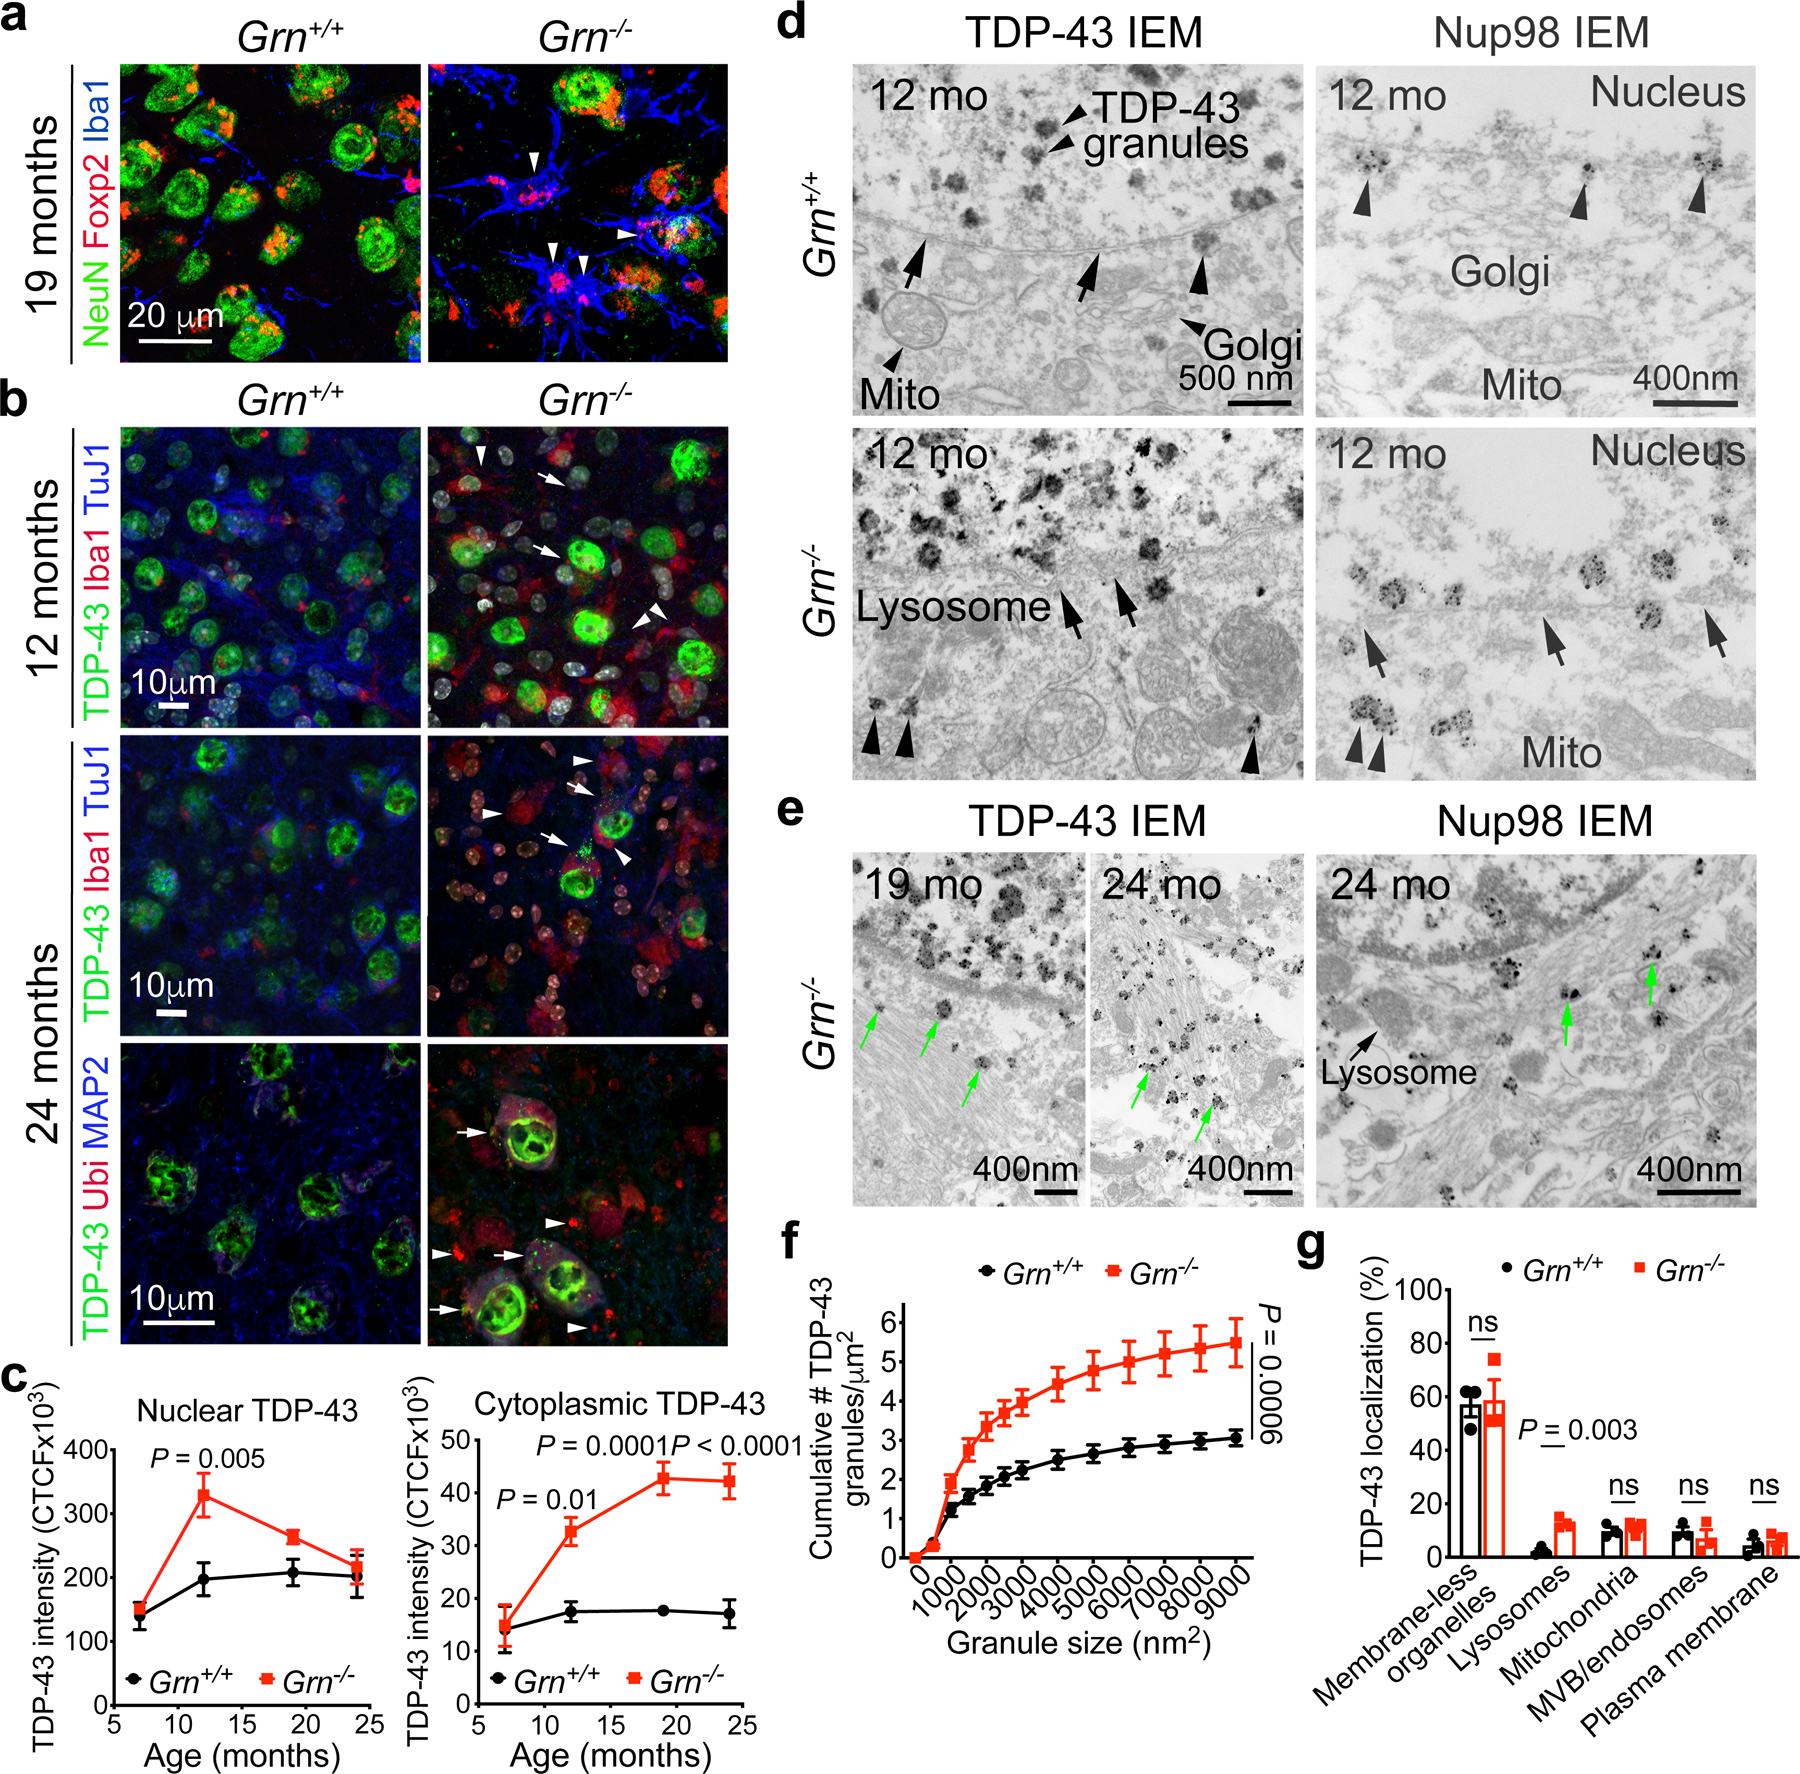
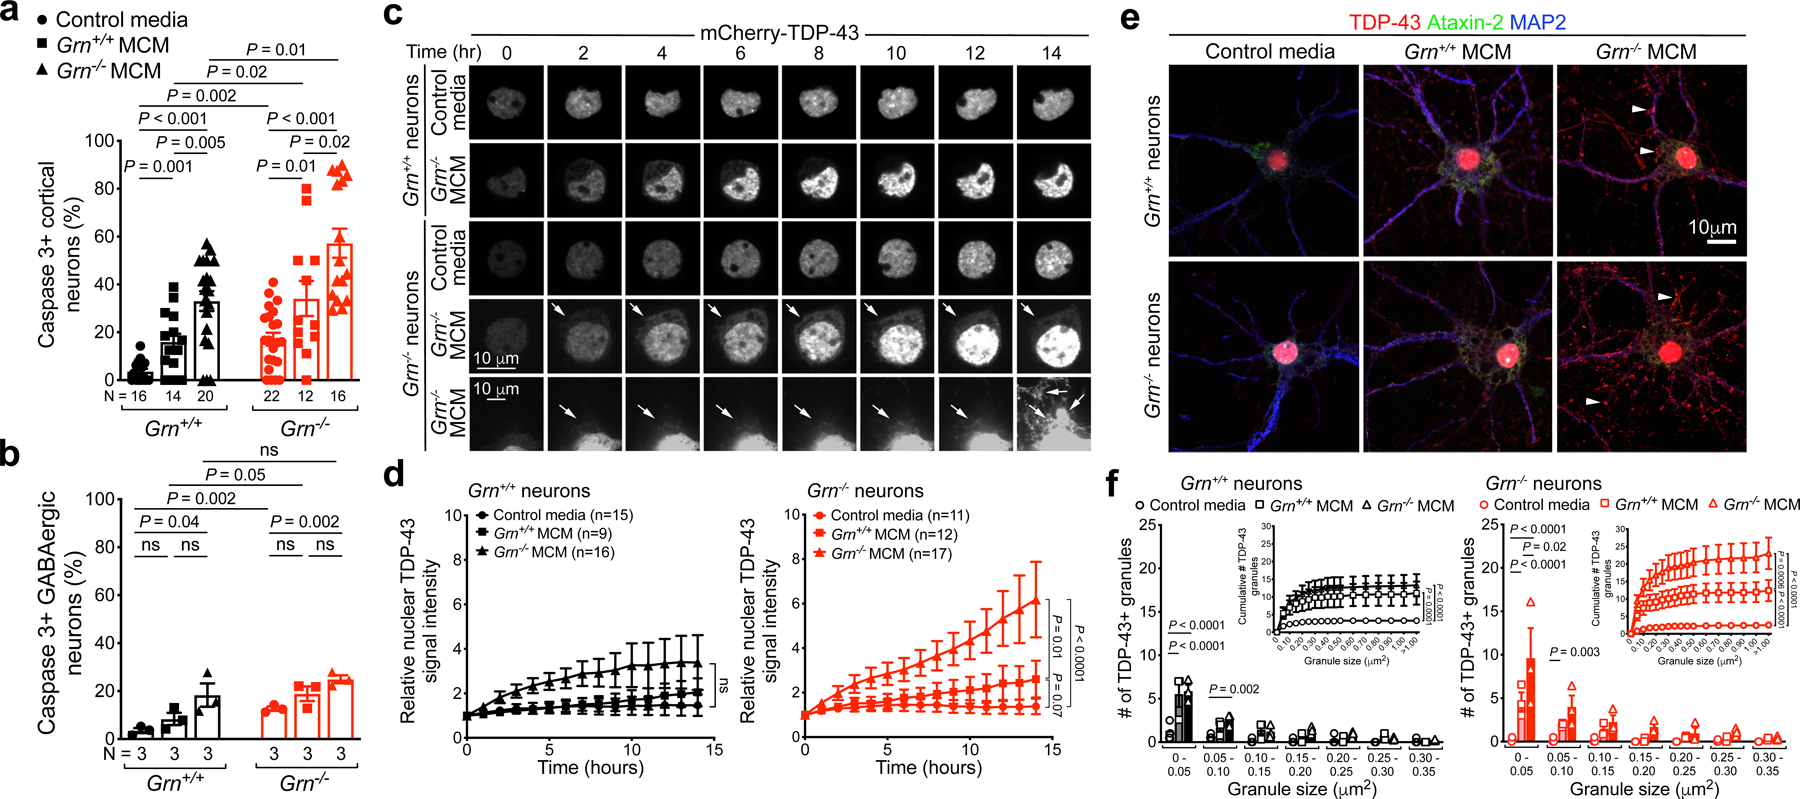
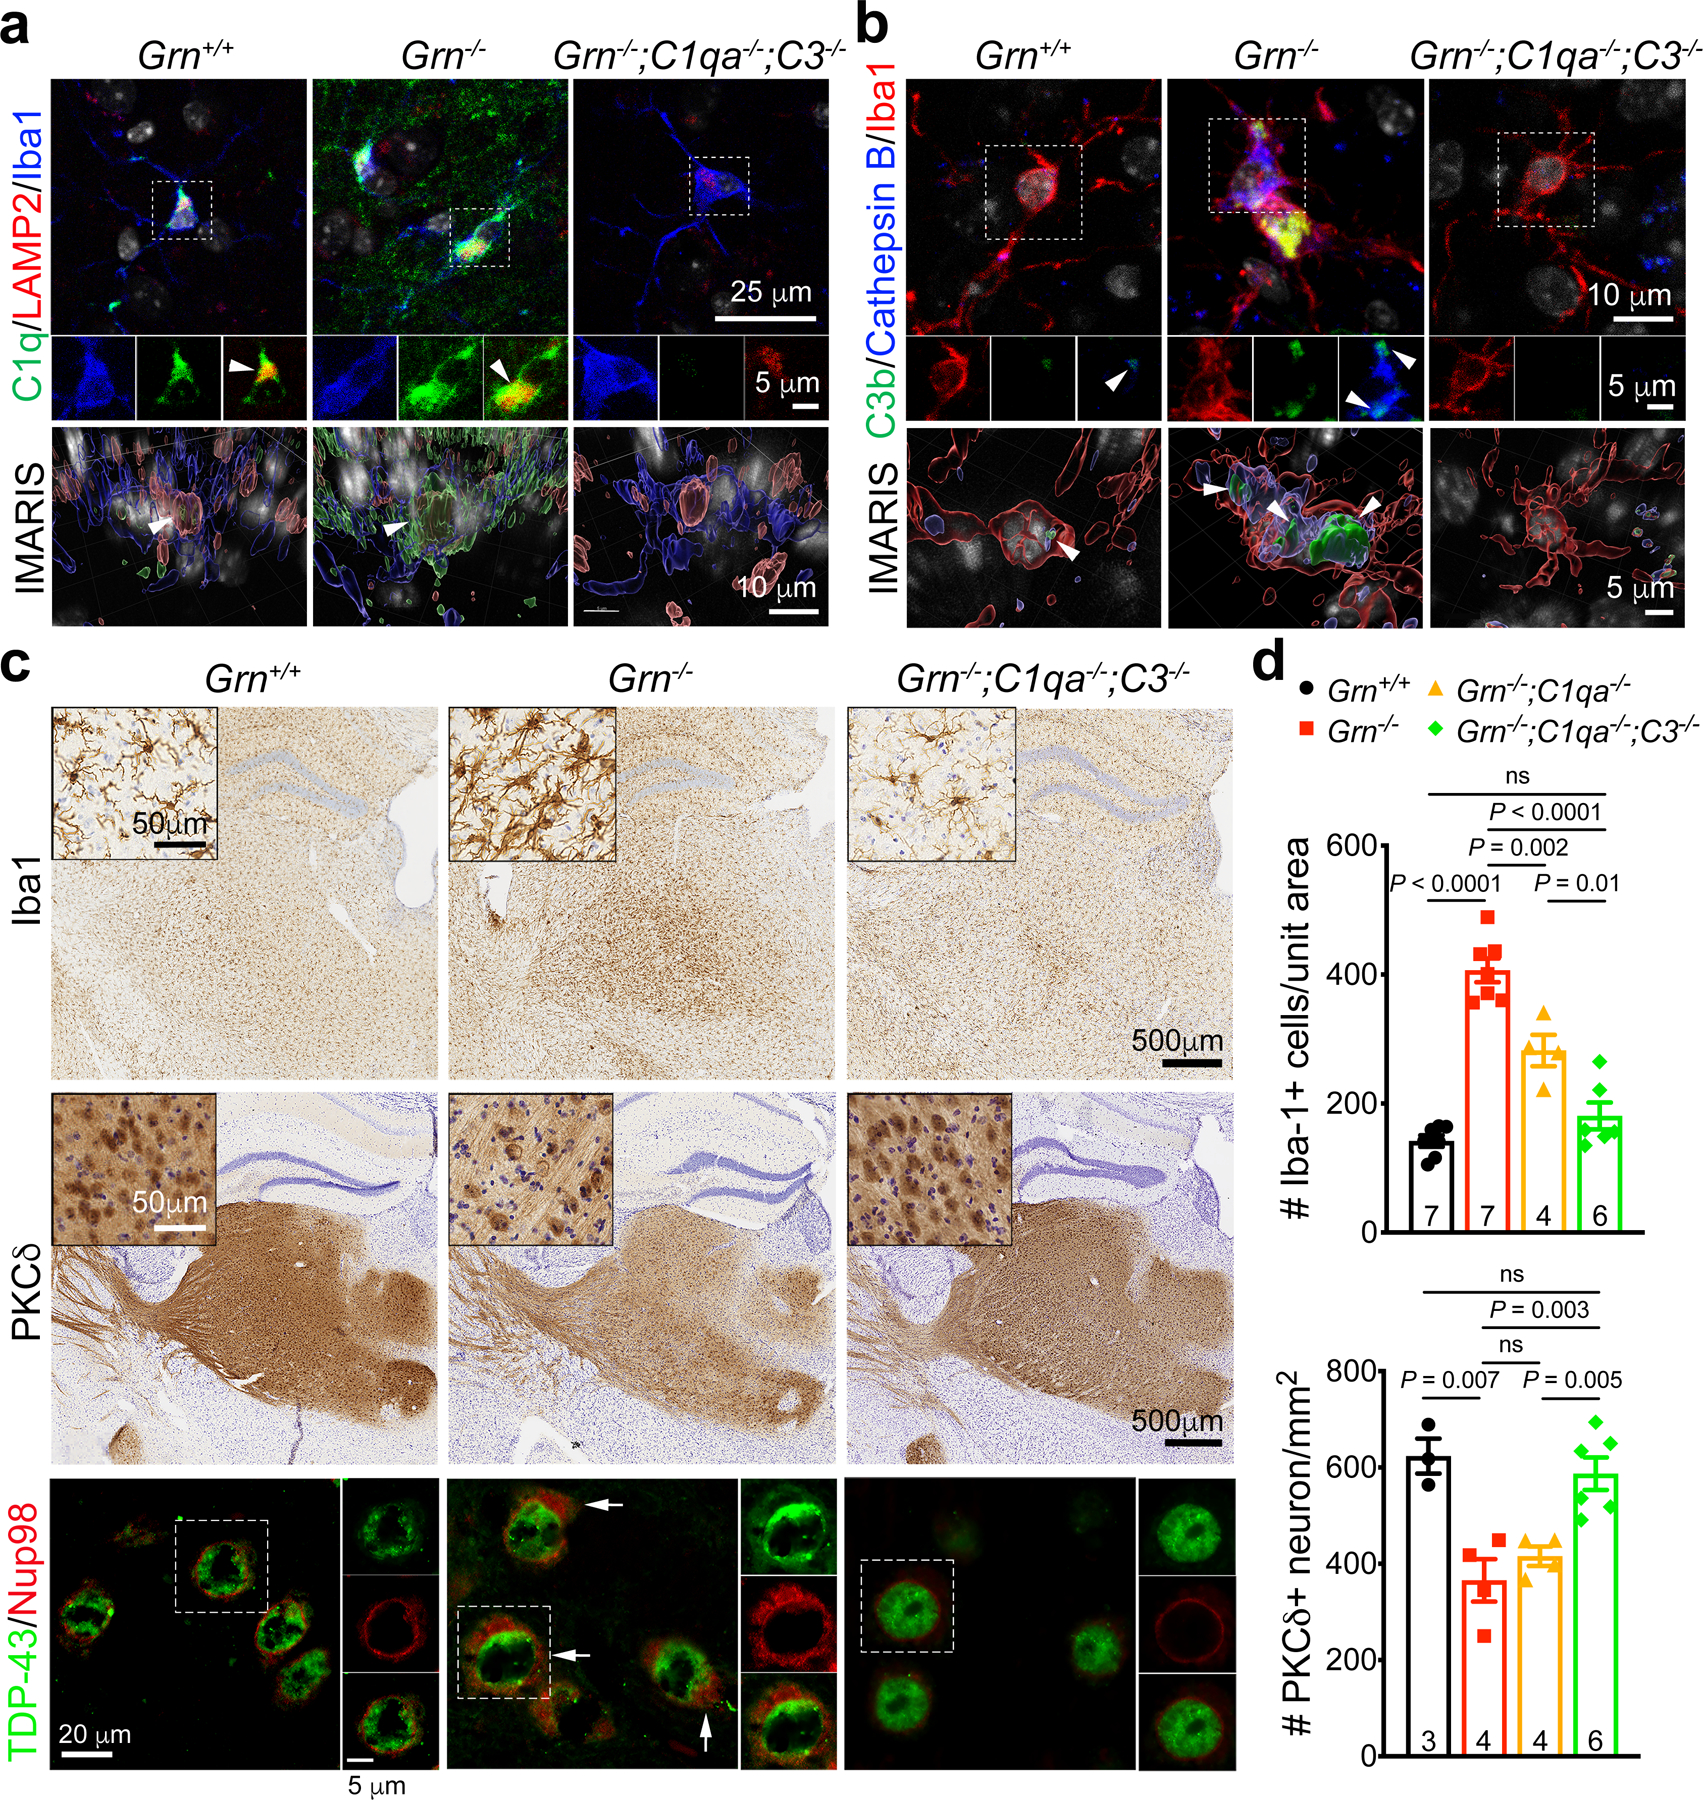
Aberrant aggregation of the RNA-binding protein TDP-43 in neurons is a hallmark of frontotemporal lobar degeneration caused by haploinsufficiency in the gene encoding progranulin1,2. However, the mechanism leading to TDP-43 proteinopathy remains unclear. Here we use single-nucleus RNA sequencing to show that progranulin deficiency promotes microglial transition from a homeostatic to a disease-specific state that causes endolysosomal dysfunction and neurodegeneration in mice. These defects persist even when Grn-/- microglia are cultured ex vivo. In addition, single-nucleus RNA sequencing reveals selective loss of excitatory neurons at disease end-stage, which is characterized by prominent nuclear and cytoplasmic TDP-43 granules and nuclear pore defects. Remarkably, conditioned media from Grn-/- microglia are sufficient to promote TDP-43 granule formation, nuclear pore defects and cell death in excitatory neurons via the complement activation pathway. Consistent with these results, deletion of the genes encoding C1qa and C3 mitigates microglial toxicity and rescues TDP-43 proteinopathy and neurodegeneration. These results uncover previously unappreciated contributions of chronic microglial toxicity to TDP-43 proteinopathy during neurodegeneration.


Conflict of interest statement

The authors declare no competing financial interests.

Figures

Extended Data Figure 1 |
Extended Data Figure 1 |. Single-nucleus RNA-sequencing (snRNA-seq) analysis of age-dependent transcriptomic changes in the thalamus of Grn−/− mice.
a. Unbiased clustering of snRNA-seq data from 2, 4, 7, 12 and 19 months old Grn+/+ and Grn−/− thalamus identifies 16 different cell types. A table outlines the number and age of Grn+/+ and Grn−/− mice used for microdissecting thalamus for snRNA-seq. Two samples, #1 in 2 months old Grn+/+ and #4 in 19 months old Grn−/−, are excluded due to suboptimal RNA quality. b–c. Subtype-specific markers for microglia (P2ry12), astrocytes (Aqp4, Gfap), oligodendroglial precursor cells (OPC)(Pdgfra), endothelial cells (Cldn5), synaptic marker (Syt1), excitatory neurons (Cux2, Satb2), oligodendroglia (Plp1), and inhibitory neurons (Gad2, Sst, Reln). c. Individual contribution to different cell cluster from each sample. d. Venn diagram shows the overlap of gene expression between cluster 11 and astrocyte and oligodendroglia clusters. These results indicate that cluster 11 contains mixed identity. e. Violin plots demonstrate that cells in cluster 11 express markers of myelinating oligodendroglia (Mog, Mag, Mbp, Plp1) and astrocytes (Slc1a2, Gja1, Nfia, Gpc5). Although cells in cluster 11 express low level of neuronal marker Syt1, they express very low level of other neuronal markers, e.g. Rbfox3, Gad1 and Gad2. f. Violin plots that show the cumulative Grn mRNA expression from 2 to 19 months in microglia (MG, c4), astrocytes (AST, c7), excitatory neurons (ExNeu, c3, c12, c13), inhibitory neurons (InNeu, c6, c9) and endothelial cells (END, c8). Statistical comparisons using MAST reveal Grn mRNA expression MG is consistently higher than other cell clusters with the following P values: MG vs AST: 2.53 × 10−40, MG vs ExNeu: 1.15 × 10⁻⁸, MG vs InNeu: 8.79 × 10⁻¹⁷, MG vs END: 1.45 × 10⁻¹⁷. In addition, comparisons between ExNeu and other cell clusters show the following P values: ExNeu vs AST: 8.46 × 10−75, ExNeu vs InNeu: 5.57 × 10⁻¹³, and ExNeu vs END: 1.38 × 10−09. g–h. Normalized cell counts for inhibitory neurons (c6, c9) and astrocytes (c7) in Grn+/+ and Grn−/− thalamus. Data represent mean ± s.e.m. Statistics use two-tailed unpaired Student’s t test. i. Gene burden analysis for glia and neuronal clusters in Grn+/+ and Grn−/− thalamus at 12 months old. These analyses calculate the number of genes differentially expressed in each cluster in Grn−/− thalamus after normalizing the number of nuclei in each cluster. Box plots show the median and 25–75th percentiles. Statistics were performed using Mann-Whitney U test.
Extended Data Figure 2 |
Extended Data Figure 2 |. Age-dependent changes in the transcriptomes and subclustering of microglia in Grn+/+ and Grn−/− thalamus.
a. Heatmap of differentially expressed genes in Grn−/− thalamic microglia show progressive transcriptomic changes from 7, 12 to 19 months. b–c. Pseudotime analyses of snRNA-seq data reveal modest transition of trajectory and subclusters in Grn+/+ thalamic microglia from 2 to 19 months. In contrast, Grn−/− microglia exhibit drastic changes in trajectory and subcluster distribution, especially at 12 and 19 months. The small clusters toward the right of UMAP graphs in Grn+/+ and Grn−/− Th-MG most likely represent a small number of microglia-related cells, such as macrophages, or other unidentified cell types. The presence of this very small cluster does not contribute to the pseudotime results for Grn+/+ or Grn−/− Th-MG. d–e. Combined pseudotime analyses show age-dependent downregulation of homeostasis genes, P2ry12 and Tmem119, and upregulation of genes associated with microglial activation, including Apoe and Ctsb, in Grn−/− microglia. f. Volcano plot showing persistent up- or downregulated genes in Grn−/− microglia from 7 to 19 months. Most differentially expressed genes (DEGs) in Grn−/− microglia are detected at 7 and 19 months (dark red), 12 and 19 months (light blue), or 7, 12 and 19 months (beige), whereas a smaller number of DEGs are detected only in 7 months (green), 12 months (red) or 19 months (dark blue). Statistics for DEGs in volcano plot use MAST. See METHODS for details of the “Meta Cell” pseudobulk approach to generate the volcano plot. g. Venn diagram showing a progressive increase in differentially expressed genes in Grn−/− Th-MG from 7, 12 to 19 months. h. Venn diagrams showing limited overlap of differentially expressed genes in 19 months Grn−/− Th-MG and AD DAM genes, and 19 months Grn−/− Th-MG and ALS DAM genes. Statistics use hypergeometric test. i. Metascape interacting map of GO terms of the 32 genes shared by 19 months Grn−/− Th-MG and AD DAM.
Extended Data Figure 3 |
Extended Data Figure 3 |. Immunohistochemical validations of differentially expressed genes in the thalamus of Grn−/− mice.
a–b. Validations using immunohistochemistry and confocal microscopy confirm the downregulation of P2Y12 and Tmem119 in Grn−/− thalamic microglia at 12 and 19 months, respectively (panel a). In contrast, Grn−/− thalamic microglia show marked increases in ApoE and Adam33 protein detected by immunohistochemical staining and confocal microscopy (panel b). Insets are high magnification images from the boxed areas in the ventral thalamus. Confocal images on the right panels are obtained from 12 months old Grn+/+ and Grn−/− thalamus. Immunohistochemistry was performed in 3 independent mice per genotype, whereas the confocal images were from two independent mice. c. Confocal images showing upregulated expression of Cathepsin B, IGF-1 and GPNMB in 12 months old Grn−/− thalamic microglia. In contrast, Grn−/− thalamic microglia show reduced expression of Numb. The validations were performed in N=3 independent mice per genotype with similar results. d. A proposed model showing the age-dependent transition of Grn−/− thalamic microglia from a homeostatic state to disease state from 7 to 19 months. The defects in Grn−/− microglia downregulate homeostatic genes (C1qa, C1qb, Mef2c, Csf1r, Cx3cr1, Tgfbr1, Tmem119, Adam33, Igf1, P2ry12), and upregulate genes related to lysosomal functions (Ctsb), lipid transport (Apoe), intracellular trafficking (Myo1f, Myo5a, Numb) and signal pathways (Arhgap24, Dock3).
Extended Data Figure 4 |
Extended Data Figure 4 |. Single-nucleus RNA-sequencing (snRNA-seq) analysis of excitatory neuron clusters in the thalamus of Grn+/+ and Grn−/− mice.
a–c. snRNA-seq identifies three distinct clusters of excitatory neurons based on the combined expression of Ttr (Transthyretin), Pde4d (Phosphodiesterase 4D) and Cntnap2 (Contactin associated protein like 2) in cluster 3, Prkcd (Protein kinase C Delta), Shisa6 (Shisa family member 6) and Plekhg1 (Pleckstrin homology and RhoGEF domain containing G1) in cluster 12, and Cntn5 (Contactin 5), Foxp2 (Forkhead Box P2) and Nxph1 (Neurexophilin 1) in cluster 13. d. Heatmaps of cluster 3 and cluster 13 show no definitive age-dependent changes in the transcriptomes. e. Comparison of excitatory neuron subtypes in 19 months old Grn+/+ and Grn−/− thalamus using immunohistochemical stains for PKCδ (upper panels) and Foxp2 (lower panels) reveals loss of PKCδ+ and Foxp2+ neurons, most prominently affecting neurons in the ventral posterolateral (VPL) and ventral posteromedial (VPM) nuclei of the thalamus. f. Stereology quantification of PKCδ+ and Foxp2+ neurons in the ventral thalamus of Grn+/+ and Grn−/− mice at 7, 12 and 19 months old. Data represent mean ± s.e.m., and the number of mice for each age and genotype is indicated at the bottom of each dataset. Statistics uses two-tailed unpaired Student’s t test. ns, not significant.
Extended Data Figure 5 |
Extended Data Figure 5 |. Characterization of P3 primary microglia from Grn+/+ and Grn−/− mice using single cell RNA-seq, NanoString nCounter neuroinflammation panel, and western blots.
a. A schematic diagram illustrating the study design to characterize primary microglia from postnatal day 3 (P3) Grn+/+ and Grn−/− mice using scRNA-seq and NanoString nCounter neuroinflammation panel, and to prepare serum-free conditioned media from Grn+/+ and Grn−/− P3-MG. In parallel, primary cortical neurons and GABAergic inhibitory neurons are isolated from the developing cortex and ganglionic eminences of embryonic day 15.5 (E15.5) Grn+/+ and Grn−/− mice. After 14 days in vitro (DIV), Grn+/+ and Grn−/− microglial conditioned media (MCM) are added to Grn+/+ and Grn−/− excitatory neurons or GABAergic inhibitory neurons and incubate for 24 hours. b. t-SNE plots of scRNA-seq data from Grn+/+ and Grn−/− P3-MG revealed 4 distinct clusters and the extent of overlapping in cell density and cluster distribution between Grn+/+ and Grn−/− P3-MG. c. Comparison of clusters A of P3-MG with 2 to 19 months (mo) thalamic microglia (Th-MG) reveals more overlapping between P3-MG (black) and 19mo Th-MG (red). d. Hierarchical clustering of gene expression in Grn+/+ and Grn−/− P3-MG cluster A and 19 months old Th-MG. e. Venn diagrams showing the extent of overlapping between DEGs from 12 and 19 months old Th-MG and DEGs in P3-MG identified by scRNA-seq (upper panel) or DEGs in P3-MG identified by NanoString nCounter Neuroinflammation panel (lower panel). Statistics use the hypergeometric test. f. Volcano plot showing the up- and down-regulated genes in Grn−/− P3-MG revealed by nCounter neuroinflammation panel. Statistics use nSolver software version 4.0, provided by the NanoString Technologies, Inc. g. Quantification of the DEGs in Grn−/− P3-MG that are shared with 19 months Grn−/− Th-MG, including upregulation of Arhgap24 and Cables1, and downregulation of Chn2, Plxdc2, C1qa, Mef2c, Csf1r, Cx3cr1, Tgfbr1, Il6ra, Lair1, and Slco2b1. Data represent mean ± s.e.m., n = 4 for each genotype. Statistics uses two-tailed unpaired Student’s t test. h. Western blots and quantification show upregulation of Cathepsin B, Myosin Va, Adam33 and ATG7, but downregulation of Mef2c and Numb. Data represent mean ± s.e.m., n = 3 for each protein. Statistics uses two-tailed unpaired Student’s t test.
Extended Data Figure 6 |
Extended Data Figure 6 |. Grn−/− microglial conditioned media (MCM)-induced cell death in Grn+/+ and Grn−/− cortical neurons and GABAergic neurons.
a. Representative confocal images of Grn+/+ and Grn−/− cortical neurons treated with control media, Grn+/+ MCM or Grn−/− MCM (100μg/ml) overnight. Immunofluorescent stains are performed using antibodies for MAP2 (green) and cleaved caspase 3 (red). Nuclei are highlighted using DAPI. b. Representative confocal microscopic images of GE-derived Grn+/+ and Grn−/− GABAergic interneurons treated with control media, Grn+/+ MCM or Grn−/− MCM (100μg/ml) overnight. Immunofluorescent stains are performed using antibodies for GAD67 (green) and cleaved caspase 3 (red). Nuclei are highlighted using DAPI.
Extended Data Figure 7 |
Extended Data Figure 7 |. Nuclear pore defects in Grn−/−neurons treated with Grn−/− microglial conditioned media (MCM).
a. 3D Structured Illumination Microscopy (SIM) images of Nup98 and Lamin A/B in Grn+/+ and Grn−/− cortical neurons treated with control media, Grn+/+ MCM and Grn−/− MCM (250μg/ml). Nup98 is shown in red, Lamin A/B in green and MAP2 in blue. b. Nup98 intensity distribution per intranuclear grid (0.44 × 0.44 μm2) in Grn+/+ and Grn−/− cortical neurons treated with control media and Grn−/− MCM (250μg/ml)(see METHODS for specific algorithms). Nup98 is less evenly distributed in Grn−/− cortical neurons in control media. When Grn+/+ neurons are treated with Grn−/− MCM, they show significant uneven distribution of Nup98 than Grn+/+ neurons treated with control media. Interestingly, Grn−/− neurons treated with Grn−/− MCM do not show further defects in Nup98 distribution compared to Grn−/− in control media. Data represent mean ± s.e.m., Data are from 3 independent cultures. Statistics use two-way ANOVA. c. Average of Nup98 intensity in the small grids in Grn+/+ and Grn−/− cortical neurons treated with control media, Grn+/+ MCM and Grn−/− MCM (250μg/ml). Data represent mean ± s.e.m.. The numbers listed below each dataset represent the number of neurons analyzed from 3 independent cultures. Statistics uses two-tailed unpaired Student’s t test.
Extended Data Figure 8 |
Extended Data Figure 8 |. Overlap between TDP-43 granules in Grn+/+ and Grn−/− neurons with lysosomal marker LAMP1, but not with mitochondrial marker Tom20 and stress granule marker Ataxin-2.
a–c. Confocal images of TDP-43 granules and LAMP1+ lysosomes (a), Tom20+ mitochondria (b), or Ataxin-2+ stress granules (c) in Grn+/+ and Grn−/− cortical neurons treated with control media, Grn+/+ MCM and Grn−/− MCM (250μg/ml). TDP-43 is shown in red and LAMP1, Tom20, and Ataxin-2 in green. Intensity plots shown below confocal images are performed using Nikon Intensity Profile System. Images are collected in the cytoplasm and dendrites. d. Immunogold electron microscopic images of TDP-43 granules in Grn+/+ and Grn−/− neurons treated with control media, Grn+/+ MCM or Grn−/− MCM (250μg/ml). Inset in right lower panel shows a small spherical structure, which likely represent a cross section of dendrite that contains many lysosomes with TDP-43 granules attached.
Extended Data Figure 9 |
Extended Data Figure 9 |. Sodium arsenite-induced TDP-43 granules in Grn+/+ and Grn−/− cortical neurons do not colocalize with G3BP1+ stress granules.
a. Sodium arsenite treatment (10 μM, 1 hr) induces prominent TDP-43 granules (red) and G3BP1+ granules (green) in Grn+/+ and Grn−/− cortical neurons. However, the TDP-43 granules and G3BP1+ granules show no evidence of colocalization in these neurons. b. Quantification using NIH ImageJ shows that the majority of TDP-43 granules are smaller than 0.05 μm2. In contrast to Grn−/− MCM treatment, sodium arsenite induces similar TDP-43 granule formation in Grn+/+ and Grn−/− cortical neurons. Images in panel a and quantification in panel b were obtained from four independent cultures. Data represent mean ± s.e.m.. Statistics use two-way ANOVA with multiple comparisons. c. Immunogold electron microscopy (IEM) reveals that TDP-43 granules induced by sodium arsenite (500 μM) have morphology similar to those in Grn−/− thalamic neurons (Figure 2d) and Grn−/− cortical neurons treated with Grn−/− MCM (Extended Data Figure 8d). At least 8 IEM images were analyzed from 2 independent cultures per condition. d. Grn+/+ and Grn−/− cortical neurons are equally vulnerable to sodium arsenite treatment (10 μM, 1 hr). Data represent mean ± s.e.m. N indicates the number of independent cultures. Statistics use two-tailed unpaired Student’s t test, ns, not significant.
Extended Data Figure 10 |
Extended Data Figure 10 |. C1q and C3b produced by Grn−/− microglia promote TDP-43 granule formation and cell death in Grn−/− neurons.
a. Immunohistochemical images of Grn+/+, Grn−/− and Grn−/−;C1qa−/−;C3b−/− mice at 7 months show the upregulation of C1q and C3b in the ventral thalamus of Grn−/− mice. No C1q or C3b staining is detected in Grn−/−;C1q−/−;C3b−/− mouse brain, confirming the specificity of these antibodies. Insets in Grn−/− panels represent higher magnification of the boxed regions in the ventral thalamus. Results were analyzed in 3 mice per genotype. b. ELISA assays for C1q and C3b show increases of both proteins in Grn−/− MCM, but no C1q or C3b is detected in Grn−/−;C1qa−/−;C3−/− MCM. Data represent mean ± s.e.m., from 8 independent microglial cultures for Grn+/+ and Grn−/− MCM, and 3 independent cultures from Grn−/−;C1qa−/−;C3−/− MCM. Statistics use two-tailed unpaired Student’s t test. c. Confocal images of cultured Grn+/+ and Grn−/− cortical neurons treated with purified human C1q (1μg/ml) or C1q+C3b (1μg/ml, each) indicate that complements are sufficient to promote the formation of TDP-43 granules in Grn+/+ and Grn−/− cortical neurons, whereas Grn−/−;C1qa−/−;C3−/− MCM fail to induce TDP-43 granule formation. d. Quantification of cytoplasmic TDP-43 intensity (upper panel) and cell death (lower panel) in Grn+/+ and Grn−/− neurons treated with C1q, C1q+C3b and C4. N in upper panel and lower panel indicates the number of independent cultures analyzed. On average, 6–8 images are obtained from each culture. Statistics use two-tailed unpaired Student’s t test. e. Quantification of cytoplasmic TDP-43 intensity (upper panel) and cell death (lower panel) in Grn+/+ and Grn−/− neurons treated with control media, Grn−/− MCM, Grn−/−;C1qa−/− MCM or Grn−/−;C1qa−/−;C3−/− MCM. Data represent mean ± s.e.m. Statistics use two-tailed unpaired Student’s t test, ns, not significant. N in upper panel and lower panel indicates the number of independent cultures analyzed. On average, 6–8 images are obtained from each culture. f. Quantification of cell death of Grn+/+ and Grn−/− neurons treated with Grn−/− MCM (250 μg/ml) and two different concentrations of vitronectin (50 or 500 ng/ml), an inhibitor of the complement membrane attack complex. Data represent mean ± s.e.m. Statistics uses two-tailed unpaired Student’s t test, ns, not significant. Data are obtained from 3 independent cultures.
Extended Data Fig. 11 |
Extended Data Fig. 11 |. Proposed model for the neurotoxic properties of Grn−/− microglia in promoting neurodegeneration in Grn−/− neurons.
Grn−/− microglia show progressive transcriptomic changes from 7 to 12 months old. Based on gene burden analysis from snRNA-seq data, Grn−/− microglia is the first cell cluster in the thalamus to show significant transcriptomic changes at 12 months. By 19 months, Grn−/− microglia exhibit much more profound changes in their transcriptomes, affecting the expression of genes implicated in plasma membrane bounded cell projection, exocytosis, phagocytosis, protein complex assembly, ion homeostasis/transport, MAPK cascade and receptor tyrosine kinase signaling. Consistent with the snRNA-seq results, immunohistochemistry and in vitro cultures show that Grn−/− microglia show marked reduction in proteins required for homeostasis, including Tmem119 and P2Y12, but have elevated expression of lysosomal and proinflammatory proteins, including Cathepsin B, ApoE, Adam33, and many others. Our results suggest that the lysosomal defects in Grn−/− microglia may facilitate the production of complements, C1q and C3b, which promote the accumulation of nuclear and cytoplasmic TDP-43 granules, nuclear pore defects, and ultimately cell death in Grn−/− neurons. Interestingly, while purified human C1q and C3b can promote TDP-43 granule formation and cell death in Grn−/− neurons, these effects are less robust compared with Grn−/− microglia condition media (MCM). These results suggest that Grn−/− microglia may produce other unknown factors to facilitate neurodegeneration in Grn−/− neurons. This model does not exclude the possibility that complements C1q and C3b may have cell autonomous effects to activate Grn−/− microglia.
Figure 1 |
Figure 1 |. Single-nucleus RNA-seq reveals age-dependent microglial pathology and neuronal vulnerability in the thalamus of Grn−/− mice.
a. Unbiased clustering of single-nucleus RNA-seq (snRNA-seq) data from Grn+/+ and Grn−/− thalamus at 2, 4, 7, 12 and 19 months reveals 16 distinct cell clusters. b. Age-dependent increases of Grn mRNA expression in microglia in Grn+/+ thalamus, whereas Grn mRNA levels remain low in astrocytes, excitatory neurons (c3, c12 and c13), inhibitory neurons and endothelial cells. Data represent mean ± s.e.m.. n= 4 mice per genotype per age. Statistics use two-way ANOVA, with multiple comparisons between microglia and excitatory neurons. c. t-SNE plots show that the 16 cell clusters in Grn+/+ thalamus remain unchanged from 4 to 19 months (top row). In contrast, the microglia cluster (c4) in Grn−/− thalamus shows changes in cell density and distribution in t-SNE plots from 7, 12 to 19 months, whereas the excitatory neuron clusters, including c3, c12 and c13, show significant reduction in cell density at 19 months. d–e. Normalized cell counts for microglia (c4) and excitatory neuron clusters (c3, c12 and c13) in Grn+/+ and Grn−/− thalamus. Data represent mean ± s.e.m.. n= 4 mice per genotype per age. Statistics use two-tailed unpaired Student’s t test. f. Gene burden analysis for glia and neuronal clusters in Grn−/− thalamus compared to Grn+/+ thalamus at 19 months. Box plots show the median and 25–75th percentiles and the whiskers represent the maximum and minimum. Statistics use Mann-Whitney U test.
Figure 2 |
Figure 2 |. TDP-43 proteinopathy and nuclear pore defects in Grn−/− thalamic neurons.
a. At 19 months, prominent Grn−/− microglia surround Foxp2+ Grn−/− thalamic neurons (arrowheads), which contain a robust increase in nuclear and cytoplasmic TDP-43 (arrows). b. At 12–24 months, many Grn−/− thalamic neurons shows distinct cytoplasmic TDP-43 aggregates (arrows, right upper panel), many colocalizing with ubiquitin (arrows, right lower panel). Arrowheads highlight Iba1+ microglia (right upper panel) and ubiquitin+ aggregates not positive for TDP-43 (right lower panel). c. Quantification of nuclear and cytoplasmic TDP-43 intensity in Grn+/+ and Grn−/− thalamic neurons from 7 to 24 months. Confocal images containing >40 neurons were captured from n=3 mice per age per genotype. Data represent mean ± s.e.m.. Statistics use two-way ANOVA with multiple comparisons. d. Immunogold electron microscopy for TDP-43 and Nup98 in 12 months old Grn+/+ and Grn−/− thalamic neurons. Arrows in left upper panel indicate intact nuclear membrane and arrowheads indicate rare TDP-43 near the nuclear pore in Grn+/+ neurons. In contrast, Grn−/− neurons contain cytoplasmic TDP-43 granules attached to abnormal lysosomes (arrowheads, left lower panel), and show frequently disrupted nuclear membrane (arrows) and displacement of Nup98 proteins from the nuclear membrane to the cytoplasm (arrowheads, right lower panel). e. By 19–24 months, many TDP-43 granules (green arrows, left panels) and Nup98 proteins (green arrows, right panel) are embedded within filamentous protein aggregates in the cytoplasm of Grn−/− neurons. f–g. Quantification of TDP-43 granules and their association with intracellular organelles at 19 months. IEM images from 7 to 21 neurons per mouse, 3 mice for each genotype, were used for quantification. Data represent mean ± s.e.m. Statistics use two-way ANOVA for panel f and two-tailed unpaired Student’s t test for panel g, ns, not significant.
Figure 3 |
Figure 3 |. Progranulin deficient microglia promote TDP-43 proteinopathy in Grn−/− neurons.
a–b. Grn−/− microglia conditioned media (MCM) promote more cell death in Grn−/− cortical neurons (a) than GABAergic neurons (b). Data represent mean ± s.e.m. Statistics use two-tailed unpaired Student’s t test. N indicates the number of independent cultures used for quantification. c. Images of mCherry-TDP-43-expressing Grn+/+ cortical neurons treated with control media (1st row) or Grn−/− microglia conditioned media (MCM)(2nd row), and Grn−/− neurons treated with control media (3rd row) or Grn−/− MCM (4th and 5th rows). Arrows in 4th and 5th rows indicate the extension of mCherry-TDP-43 from nucleus to cytoplasm. d. Quantification of nuclear mCherry-TDP43 signal in Grn+/+ and Grn−/− neurons for each time point in panel c. The left graph represents nuclear mCherry-TDP-43 signal in Grn+/+ neurons, whereas the right graph represents data from Grn−/− neurons. Data represent mean ± s.e.m. Statistics use two-way ANOVA, ns, not significant. The number of neurons analyzed is indicated in each graph. See METHODS for the numbers of independent cultures for each condition. e. Confocal images of Grn+/+ and Grn−/− neurons treated with control media, Grn+/+ MCM or Grn−/− MCM. Grn−/− neurons treated with Grn−/− MCM show robust accumulation of TDP-43 granules in the cytoplasm and dendrites (arrowheads), whereas the distribution of Ataxin-2 in these neurons is diffuse with no evidence of granule formation. f. Quantification shows most TDP-43 granules in Grn+/+ and Grn−/− neurons induced by Grn+/+ or Grn−/− MCM are smaller than 0.05 μm. Compared to Grn+/+ MCM, Grn−/− MCM promotes more and larger TDP-43 granules in Grn−/− neurons. Data represent mean ± s.e.m., from 3 independent cultures. Statistics in dot plots use two-tailed unpaired Student’s t test, whereas and the statistics in the cumulative plots use two-way ANOVA.
Figure 4 |
Figure 4 |. Complements C1q and C3b promote TDP-43 granule formation and neurodegeneration in Grn−/− mice.
a–b. Confocal and IMARIS 3D images of C1q and C3b proteins in the cytoplasm of Th-MG in 12 months old Grn+/+, Grn−/− and Grn−/−;C1qa−/−;C3−/− mice. Small amounts of C1q and C3b proteins are detected in Grn+/+ Th-MG where they colocalize with LAMP2+ or Cathepsin B+ vesicles (left panels), whereas much more abundant C1q and C3b proteins are present in Grn−/− Th-MG where these two proteins show overlap with LAMP2+ and Cathepsin B+ vesicles (arrowheads). No C1q or C3b signals are detected in Grn−/−;C1qa−/−;C3−/− Th-MG. Similar results were obtained from n=3 mice per genotype. c. Immunohistochemistry show a near complete rescue of microgliosis (1st row) and PKCδ+ neuron loss (2nd row) in the ventral thalamus of 12 months old Grn−/−;C1qa−/−;C3−/− mice. Insets are higher magnifications for Iba1+ microglia and PKCδ+ neurons. Confocal images show the presence of cytoplasmic TDP-43 and Nup98 in Grn−/− neurons (arrows, 3rd row), but not in Grn−/−;C1qa−/−;C3−/− neurons. d. Stereology quantification of microglia and PKCδ+ neuron in 12 months old Grn+/+, Grn−/−, Grn−/−;C1qa−/− and Grn−/−;C1qa−/−;C3−/− mice. Data represent mean ± s.e.m. The number of mice for each genotype is indicated at the bottom of each graph. Statistics use two-tailed unpaired Student’s t test, ns, not significant.

References

    1. Hofmann JW, Seeley WW & Huang EJ RNA Binding Proteins and the Pathogenesis of Frontotemporal Lobar Degeneration. Annu Rev Pathol 14, 469–495, 10.1146/annurev-pathmechdis-012418-012955 (2019). - DOI - PMC - PubMed
    1. Mackenzie IR et al. A harmonized classification system for FTLD-TDP pathology. Acta Neuropathol 122, 111–113, 10.1007/s00401-011-0845-8 (2011). - DOI - PMC - PubMed
    1. Baker M et al. Mutations in progranulin cause tau-negative frontotemporal dementia linked to chromosome 17. Nature 442, 916–919, 10.1038/nature05016 (2006). - DOI - PubMed
    1. Cruts M et al. Null mutations in progranulin cause ubiquitin-positive frontotemporal dementia linked to chromosome 17q21. Nature 442, 920–924, 10.1038/nature05017 (2006). - DOI - PubMed
    1. Kao AW, McKay A, Singh PP, Brunet A & Huang EJ Progranulin, lysosomal regulation and neurodegenerative disease. Nat Rev Neurosci 18, 325–333, 10.1038/nrn.2017.36 (2017). - DOI - PMC - PubMed

Additional References

    1. Martens LH et al. Progranulin deficiency promotes neuroinflammation and neuron loss following toxin-induced injury. J Clin Invest 122, 3955–3959, 10.1172/JCI63113 (2012). - DOI - PMC - PubMed
    1. Nguyen AD et al. Murine knockin model for progranulin-deficient frontotemporal dementia with nonsense-mediated mRNA decay. Proc Natl Acad Sci U S A 115, E2849–E2858, 10.1073/pnas.1722344115 (2018). - DOI - PMC - PubMed
    1. Botto M et al. Homozygous C1q deficiency causes glomerulonephritis associated with multiple apoptotic bodies. Nat Genet 19, 56–59, 10.1038/ng0598-56 (1998). - DOI - PubMed
    1. Bhaduri A, Nowakowski TJ, Pollen AA & Kriegstein AR Identification of cell types in a mouse brain single-cell atlas using low sampling coverage. BMC Biol 16, 113, 10.1186/s12915-018-0580-x (2018). - DOI - PMC - PubMed
    1. Finak G et al. MAST: a flexible statistical framework for assessing transcriptional changes and characterizing heterogeneity in single-cell RNA sequencing data. Genome Biol 16, 278, 10.1186/s13059-015-0844-5 (2015). - DOI - PMC - PubMed

Publication types

MeSH terms