. 2020 Oct;586(7827):127-132.
doi: 10.1038/s41586-020-2711-0. Epub 2020 Aug 31.

Human germinal centres engage memory and naive B cells after influenza vaccination

Affiliations

Human germinal centres engage memory and naive B cells after influenza vaccination

Jackson S Turner et al. Nature. 2020 Oct.

Abstract

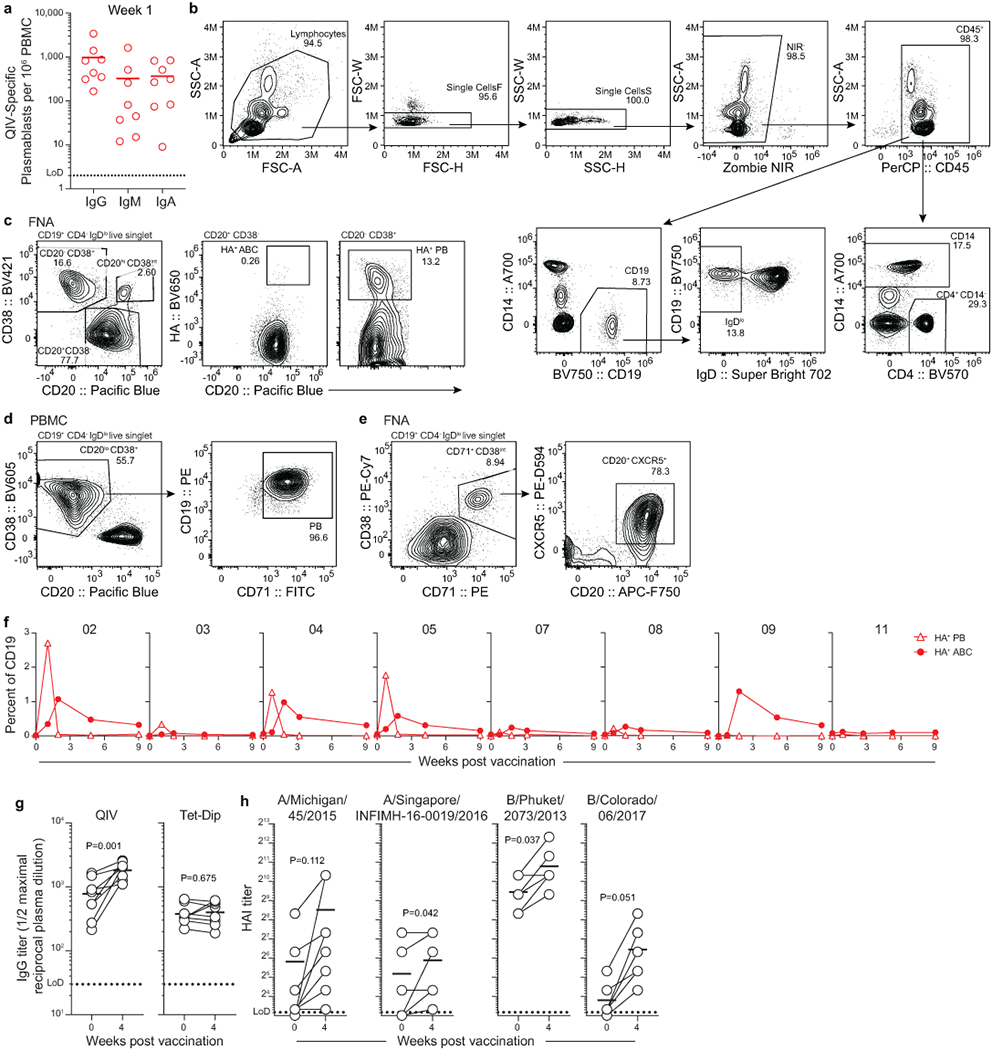
Influenza viruses remain a major public health threat. Seasonal influenza vaccination in humans primarily stimulates pre-existing memory B cells, which differentiate into a transient wave of circulating antibody-secreting plasmablasts1-3. This recall response contributes to 'original antigenic sin'-the selective increase of antibody species elicited by previous exposures to influenza virus antigens4. It remains unclear whether such vaccination can also induce germinal centre reactions in the draining lymph nodes, where diversification and maturation of recruited B cells can occur5. Here we used ultrasound-guided fine needle aspiration to serially sample the draining lymph nodes and investigate the dynamics and specificity of germinal centre B cell responses after influenza vaccination in humans. Germinal centre B cells that bind to influenza vaccine could be detected as early as one week after vaccination. In three out of eight participants, we detected vaccine-binding germinal centre B cells up to nine weeks after vaccination. Between 12% and 88% of the responding germinal centre B cell clones overlapped with B cells detected among early circulating plasmablasts. These shared B cell clones had high frequencies of somatic hypermutation and encoded broadly cross-reactive monoclonal antibodies. By contrast, vaccine-induced B cell clones detected only in the germinal centre compartment exhibited significantly lower frequencies of somatic hypermutation and predominantly encoded strain-specific monoclonal antibodies, which suggests a naive B cell origin. Some of these strain-specific monoclonal antibodies recognized epitopes that were not targeted by the early plasmablast response. Thus, influenza virus vaccination in humans can elicit a germinal centre reaction that recruits B cell clones that can target new epitopes, thereby broadening the spectrum of vaccine-induced protective antibodies.


Figures

Extended Data Figure 1.
Extended Data Figure 1.. Robust peripheral B cell response to influenza virus vaccination.
a) ELISpot quantification of QIV-binding IgG-, IgM-, and IgA-secreting QIV-binding PBs 1 -week post-vaccination. Each symbol represents one participant (n=8). b-e) Flow cytometry (b, c) and sorting (d, e) gating strategies for PBMC (b, d) and FNA (c, e). Population counts per mL of blood and frequencies are presented in f, below and in Figs. 1d, 2f, and Extended Data Fig. 2c, m. f) Kinetics of HA-binding PBs (CD20lo HA+, open triangles) and activated B cells (ABCs, CD20+ HA+, closed circles) in PBMCs, gated as in Fig. 1c, pre-gated IgDlo CD19+ CD4 live singlet lymphocytes as in (b). Symbols at each timepoint represent one sample (n=8). g, h) IgG plasma antibody titers against QIV and Tetanus/Diptheria vaccine measured by ELISA (g) and hemagglutination inhibition titers against QIV constituent viruses (h) pre- and 4-weeks post-vaccination. Symbols at each timepoint represent one sample (n = 8). Horizontal lines in a, g, and h represent means. Dotted lines represent limit of detection. P-values from paired two-sided Student’s t -tests.
Extended Data Figure 2.
Extended Data Figure 2.. Defining influenza virus vaccine-induced GC B cell response in humans.
a) Cortical thickness measurements of axillary LNs before each FNA collection. b) FNA cell yields for each participant at the indicated timepoint. Symbols at each timepoint represent one sample (n=7). c) Participant 02 percentages of CD19+ CD4 B cells (left), CD14 CD4+ T cells (middle), and CD14+ CD4 monocytes or granulocytes (right) of CD45+ in PBMC (red) and FNA (blue) from one set of paired samples, representative of 6 FNA samples. d) Unsupervised clustering via tSNE based on scRNAseq gene expression of all cells pooled from all samples and timepoints from participant 05. Each dot represents a cell, colored by phenotype as defined by gene expression profile. e) Dot plot showing the average log-normalized expression of a set of marker genes and the fraction of cells expressing the genes in each unsupervised cluster. f, g) Annotated tSNE clusters of all cells from all scRNA-seq samples (f) and IgDlo enriched B cells from PBMC scRNA-seq samples (g) pooled from all time points from participant 05. Total number of cells is below clusters. h) Dot plot for annotated clusters. i) Representative flow cytometry gating of Bcl6 expression within CD20hi CD38int in PBMC and FNA. Cells pre-gated IgDlo CD19+ CD4 live singlet lymphocytes. j) Representative histographs (upper) and median fluorescence intensity (lower) of the indicated markers on GC B cells (IgDlo CD20hi CD38int) compared to PBs (IgDlo CD20 CD38+), memory B cells (IgDlo CD27+ CD38), and naïve B cells (IgD+ CD27). All populations pre-gated CD19+ CD4 live singlet lymphocytes. MFIs from 2- or 4-week FNA samples from participants 04, 05, 07, 08, 09, and 11. Lines represent medians. k) Representative gating of HA+ GC B cells. Cells pre-gated CD20hi CD38int IgDlo CD19+ CD4 live singlet lymphocytes. l) Kinetics of HA-binding percent of GC B cells measured by flow cytometry in participants 04, 05, and 11. m) Kinetics of HA+ CD38+ CD20lo PBs (open triangles) and HA+ CD38 CD20+ ABCs (closed circles) in FNA, as gated in Extended Data Fig. 1c. Symbols at each timepoint represent one sample (n=7). Daggers denote samples excluded from analysis due to low cell recovery or blood contamination.
Extended Data Figure 3.
Extended Data Figure 3.. GC B cell response to influenza virus vaccine is clonally diverse.
a) Schematic of single cell mAb cloning and expression. Paired heavy and light chain genes were amplified from singly sorted PBs or GC B cells. Variable portions of heavy chains were cloned into a Cγ1 expression vector and variable portions of κ and λ light chains were cloned into respective expression vectors. Paired heavy and light chain expression vectors were co-transfected into 293F cells, and mAbs were purified from culture supernatant by protein A affinity chromatography, then screened for QIV specificity by ELISA. b) Minimum positive concentrations of clonally unique mAbs generated from singly sorted PBs as determined by QIV ELISA; positive binding defined as greater than 3× background. c) Distance-to-nearest-neighbor plots for choosing a distance threshold for inferring clones via hierarchical clustering. After partitioning sequences based on common V and J genes and junction length, the nucleotide Hamming distance of a junction to its nearest non-identical neighbor from the same participant within its partition was calculated and normalized by junction length (blue histogram). For reference, the distance to the nearest non-identical neighbor from other participants was calculated (green histogram). A clustering threshold of 0.1 (dashed black line) was chosen via manual inspection and kernel density estimate (dashed purple line) to separate the two modes of the within-participant distance distribution representing, respectively, sequences that were likely clonally related and unrelated. d) Clonal overlap of sequences from mAb cloning and bulk repertoire analysis between PBs sorted from PBMCs 1-week post-vaccination and GC B cells from the indicated timepoint among total (top) and only QIV-binding (bottom) sequences. Purple chords link overlapping GC and PB clones; black chords link GC clones found at multiple timepoints that did not participate in the early PB response. Chord width corresponds to clonal population size. Percentages are of GC sequences overlapping with PBs. e) Clonal rank-abundance distributions of GC B cells from indicated timepoints (left) and of early blood PBs (right). The number of GC B cells or early blood PBs in a clone as a percentage of the total GC or early blood PB repertoire (y-axis) is plotted against the abundance rank of that clone (x-axis). Solid lines represent the estimated clonal abundance curves, with shaded bands representing the 95% confidence intervals from 200 bootstraps. g) tSNE clusters of B cells from FNA scRNAseq samples from participant 05. Each dot represents a cell, colored by phenotype as defined by gene expression profile. Total numbers of cells are given below clusters. GC percentages are indicated in blue. h) IGHV mutation frequency of naïve B cells pooled from all timepoints (left) and the indicated populations at the indicated timepoint (right) from scRNAseq of whole and memory B cell-enriched PBMC and FNA samples from participant 05. Horizontal lines represent medians. P-values from two-sided Dunn’s multiple comparisons test.
Extended Data Figure 4.
Extended Data Figure 4.. B cell clustering for participant 05.
a) tSNE plot showing unsupervised clusters based on scRNAseq gene expression of cells in the “B cell” cluster of Extended Data Fig. 2e, pooled from all samples and timepoints from participant 05. b) Dot plot showing the average log-normalized expression of a set of marker genes and the fraction of cells expressing the genes in each unsupervised cluster. c) tSNE plot showing BCR availability. d) tSNE plot showing interim annotated clusters. e) Dot plot for interim annotated clusters. f) tSNE plot showing final annotated clusters. g) Dot plot for final annotated clusters. h) tSNE plot showing IHGV mutation frequency in BCRs. Total numbers of cells are given below clusters. i) Bar plots showing isotype usage in annotated B cell clusters. Numbers of cells per cluster are in Extended Data Table 1.
Extended Data Figure 5.
Extended Data Figure 5.. GC and PB responses to influenza virus vaccine are functionally diverse.
a–c) IVPM binding of H1- (a), H3- (b), and influenza B/HA- (c) binding mAbs generated from singly sorted PBs and GC B cells that overlapped clonally (purple) or did not overlap (red and blue) from the indicated participant. Scale bar represents median fluorescence intensity. Asterisks denote HAI+ mAbs. Vaccine strains in bold type; underlined strains circulated in humans in participants’ lifetimes. d) Percentages of mAbs that bound two or more HA strains from participants 04, 05, and 11 from GC clones that did not participate in the early PB response (blue), clones that participated in both GC and early PB responses (purple), and from PB clones not found in GCs (red). Numbers of mAbs are indicated in the middle of the charts. e) Polyclonal epitopes of Fabs from plasma at indicated timepoints from participants 04, 05, and 11 with HA from A/Singapore/INFIMH-16-0019/2016. Epitopes were determined by 3D reconstructions and/or 2D class averages (images to bottom right of 3D reconstructions). HA proteins shown in grey; Fabs shown in multiple colors; Fabs with dashed outlines have predicted epitopes due to limited particle representation. f, g) Example 2D class averages of immune complexes from participants 04, 05, and 11 plasma with HA from A/Michigan/45/2015 (f) and A/Singapore/INFIMH-16-0019/2016 (g). h, i) Monoclonal and polyclonal epitopes of immune complexes with HA from A/Michigan/45/2015 (h) or A/Singapore/INFIMH-16-0019/2016 (i) and Fabs generated from indicated GC mAbs in blue or purple mesh and plasma pAbs in red. Fabs with dashed outlines have predicted epitopes due to limited particle representation. j, k) Example 2D class averages of immune complexes from the indicated mAb with HA from A/Michigan/45/2015 (j) and A/Singapore/INFIMH-16-0019/2016 (k).
Figure 1.
Figure 1.. Robust peripheral B cell response to influenza virus vaccination.
a) Study design. Eight healthy adults (ages 26–40) who had not been vaccinated against influenza for 3 years were enrolled and received quadrivalent inactivated vaccine (QIV) i.m. Blood and fine needle aspirates (FNAs) of ipsilateral axillary lymph nodes were collected pre-vaccination and at 1, 2, approximately 4, and 9 weeks after vaccination. b) ELISpot quantification of QIV-binding IgG-secreting plasmablasts (PBs) in blood at baseline, 1, and 2 weeks post-vaccination. c, d) Representative gating (c) and kinetics (d) of HA-binding activated B cells (ABCs, CD20+ HA+, closed circles) and PBs (CD20lo HA+, open triangles) in PBMC. Cells pre-gated IgD CD19+ CD4 live singlet lymphocytes. Symbols at each timepoint in b and d represent one sample (n=8).
Figure 2.
Figure 2.. Defining influenza virus vaccine-induced GC B cell response in humans.
a) Representative sonogram of FNA; note hyperechoic medulla “m” and needle sampling hypoechoic cortex “c” from top left. b) Representative sonograms of axillary LN before each FNA. c) Percentages of CD19+ CD4 B cells (left), CD14 CD4+ T cells (middle), and CD14+ CD4 monocytes or granulocytes (right) of CD45+ in paired PBMC (red) and FNA (blue) samples measured by flow cytometry. Lines represent means. Each symbol represents one sample (n=8). P-values from paired two-sided Student’s t - tests. d) Clustering via t-distributed stochastic neighbor embedding (tSNE) of all cells from whole PBMC (left) and FNA (right) scRNAseq samples pooled from all timepoints from participant 05. Each dot represents a cell, colored by phenotype as defined by the gene expression profile. Total numbers of cells are below clusters. e) Representative flow cytometry gating of CD20hi CD38int population in FNA. Cells pre-gated IgDlo CD19+ CD4 live singlet lymphocytes. f) Kinetics of total (closed circles) and HA+ (open circles) GC B cells in FNA, as defined by flow cytometry gates in e and Extended Data Fig. 2k. Symbols at each timepoint represent one sample (n=7). Daggers denote samples excluded from analysis due to low cell recovery or blood contamination.
Figure 3.
Figure 3.. Clonally diverse GC B cell response to influenza virus vaccine.
a) Minimum positive concentrations of clonally unique mAbs generated from singly sorted PBs from week 1 post-vaccination (left) and GC B cells at the indicated timepoints (right) from participant 05 as determined by QIV ELISA; positive binding defined as greater than 3× background. b) Clonal overlap of sequences from mAb cloning and bulk repertoire analysis between PBs sorted from PBMCs 1-week post-vaccination and GC B cells from all timepoints among total (left) and only QIV-binding (right) sequences. Chord width corresponds to clonal population size; numbers of sequences are in Extended Data Table 3. Percentages are of GC sequences overlapping with PBs. c) Immunoglobulin heavy chain variable region (IGHV) gene mutation frequency of sorted QIV-binding PBs and GC B cells that overlapped clonally (purple) or did not (red and blue). Vertical lines represent medians. Sequence counts were 14, 149, and 1000 (participant 04); 22, 1129, and 1034 (participant 05); 29, 43, and 57 (participant 11) for GC, shared, and PB, respectively. P-values from two-sided Dunn’s multiple comparisons test. d, e) Clustering via tSNE of B cells showing GC (blue), PB, (red), PB-like (brown), naïve (gold), ABC (green), and RMB (lavender) populations pooled from all timepoints (d) and QIV-binding clonal kinetics showing clones found in GC (blue), early PB (red), or both (purple) at the indicated timepoints (e). f, g) Dendrograms of clonal families of H1 HA–binding day 60 GC mAbs 1A06 (f) and 1C10 (g). Horizontal branch length represents the expected number of substitutions per codon in V -region genes, corresponding to the key in the lower left of each panel. Colored symbols represent sequences from cells isolated at day 5 unless otherwise specified, corresponding to the indicated phenotype and isotype.
Figure 4.
Figure 4.. Functionally diverse GC and PB responses to influenza virus vaccine.
a) Binding of group 1–binding mAbs generated from singly sorted PBs and GC B cells that overlapped clonally (purple) or did not overlap (red and blue) for PB and GC B cells, respectively, from participant 05 using an influenza virus protein microarray (IVPM). Scale bar is median fluorescence intensity. Vaccine strains in bold type; underlined strains circulated in humans in participants’ lifetimes. b) Percentages of mAbs that bound two or more HA strains from participants 04, 05, and 11 from GC clones that did not participate in the early PB response (blue) and from PB and shared clones (red). P-values from Fisher’s exact test. The number of mAbs is indicated in the middle of the charts. c) Polyclonal epitopes of Fabs from plasma at indicated timepoints from participants 04, 05, and 11 with HA from A/Michigan/45/2015. Epitopes were determined by 3D reconstructions and/or 2D class averages (images to bottom right of 3D reconstructions). HA proteins shown in grey; Fabs shown in multiple colors. d) Monoclonal and polyclonal epitopes of immune complexes with HA from A/Michigan/45/2015 and Fabs generated from the indicated GC mAbs (blue) and plasma pAbs (red). Fabs with dashed outlines have predicted epitopes due to limited particle representation. e) Protection of GC mAbs 1B05 and 2C09 in a mouse influenza virus challenge model. Mice received 5 mg/kg of the indicated mAb intraperitoneally 1 day before intranasal challenge with A/California/04/2009 E3 (H1N1), and were weighed daily; 7 mice were used for 1B05 and 1G01, 6 for 2C09 and isotype control, and 5 for uninfected. Error bars indicate mean ±SEM.

Comment in

References

    1. Wrammert J et al. Rapid cloning of high-affinity human monoclonal antibodies against influenza virus. Nature 453, 667–671 (2008). - PMC - PubMed
    1. Corti D et al. A Neutralizing Antibody Selected from Plasma Cells That Binds to Group 1 and Group 2 Influenza A Hemagglutinins. Science (80-.). 333, 850–856 (2011). - PubMed
    1. Corti D et al. Heterosubtypic neutralizing antibodies are produced by individuals immunized with a seasonal influenza vaccine. J. Clin. Invest 120, 1663–1673 (2010). - PMC - PubMed
    1. Francis T On the Doctrine of Original Antigenic Sin. Proc. Am. Philos. Soc 104, 572–578 (1953).
    1. Victora GD & Nussenzweig MC Germinal Centers. Annu. Rev. Immunol 30, 429–457 (2012). - PubMed

Publication types

Substances