Targeting Dopamine Receptor D2 by Imipridone Suppresses Uterine Serous Cancer Malignant Phenotype
- PMID: 32867127
- PMCID: PMC7563948
- DOI: 10.3390/cancers12092436
Targeting Dopamine Receptor D2 by Imipridone Suppresses Uterine Serous Cancer Malignant Phenotype
Erratum in
-
Correction: Hu, W., et al. Targeting Dopamine Receptor D2 by Imipridone Suppresses Uterine Serous Cancer Malignant Phenotype. Cancers 2020, 12, 2436.Cancers (Basel). 2021 Feb 4;13(4):623. doi: 10.3390/cancers13040623. Cancers (Basel). 2021. PMID: 33557446 Free PMC article.
Abstract
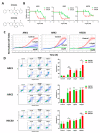
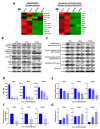
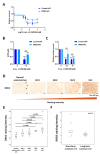
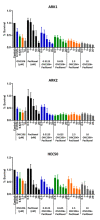
Uterine serous cancer (USC) is an aggressive subtype of endometrial cancer, with poor survival and high recurrence rates. The development of novel and effective therapies specific to USC would aid in its management. However, few studies have focused solely on this rare subtype. The current study demonstrated that the orally bioavailable, investigational new drug and novel imipridone ONC206 suppressed USC cell proliferation and induced apoptosis both in vitro and in vivo. Disruption of the DRD2-mediated p38MAPK/ERK/PGC-1α network by ONC206 led to metabolic reprogramming and suppression of both glycolysis and oxidative phosphorylation. ONC206 also synergized with paclitaxel in reducing USC cell viability. In addition, DRD2 overexpression correlated with poor overall survival in patients. This study provides the first evidence that ONC206 induced metabolic reprogramming in USC cells and is a promising therapeutic agent for USC treatment. These findings support further development of ONC206 as a promising therapeutic agent and improves survival rates in patients with USC.
Keywords: dopamine receptor D2; imipridone; metabolic reprogramming; uterine serous cancer.
Conflict of interest statement
R.S.T. and J.E.A. are employees and shareholders of Oncoceutics. Other authors declare no conflict of interest.
Figures


Similar articles
-
Ryanodine receptor 1-mediated Ca2+ signaling and mitochondrial reprogramming modulate uterine serous cancer malignant phenotypes.J Exp Clin Cancer Res. 2022 Aug 11;41(1):242. doi: 10.1186/s13046-022-02419-w. J Exp Clin Cancer Res. 2022. PMID: 35953818 Free PMC article.
-
ONC206, an Imipridone Derivative, Induces Cell Death Through Activation of the Integrated Stress Response in Serous Endometrial Cancer In Vitro.Front Oncol. 2020 Oct 20;10:577141. doi: 10.3389/fonc.2020.577141. eCollection 2020. Front Oncol. 2020. PMID: 33194693 Free PMC article.
-
ONC206 has anti-tumorigenic effects in human ovarian cancer cells and in a transgenic mouse model of high-grade serous ovarian cancer.Am J Cancer Res. 2022 Feb 15;12(2):521-536. eCollection 2022. Am J Cancer Res. 2022. PMID: 35261784 Free PMC article.
-
Mechanisms of resistance to HER2-targeted therapies in HER2-amplified uterine serous carcinoma, and strategies to overcome it.Discov Med. 2018 Aug;26(141):39-50. Discov Med. 2018. PMID: 30265854 Review.
-
Pathogenesis and Clinical Management of Uterine Serous Carcinoma.Cancers (Basel). 2020 Mar 14;12(3):686. doi: 10.3390/cancers12030686. Cancers (Basel). 2020. PMID: 32183290 Free PMC article. Review.
Cited by
-
The Interplay Between Prolactin and Reproductive System: Focus on Uterine Pathophysiology.Front Endocrinol (Lausanne). 2020 Oct 9;11:594370. doi: 10.3389/fendo.2020.594370. eCollection 2020. Front Endocrinol (Lausanne). 2020. PMID: 33162942 Free PMC article. Review.
-
Small molecule targeted therapies for endometrial cancer: progress, challenges, and opportunities.RSC Med Chem. 2024 Apr 11;15(6):1828-1848. doi: 10.1039/d4md00089g. eCollection 2024 Jun 19. RSC Med Chem. 2024. PMID: 38911148 Free PMC article. Review.
-
A Novel Therapeutic Mechanism of Imipridones ONC201/ONC206 in MYCN-Amplified Neuroblastoma Cells via Differential Expression of Tumorigenic Proteins.Front Pediatr. 2021 Aug 4;9:693145. doi: 10.3389/fped.2021.693145. eCollection 2021. Front Pediatr. 2021. PMID: 34422720 Free PMC article.
-
ONC201 and imipridones: Anti-cancer compounds with clinical efficacy.Neoplasia. 2020 Dec;22(12):725-744. doi: 10.1016/j.neo.2020.09.005. Epub 2020 Oct 23. Neoplasia. 2020. PMID: 33142238 Free PMC article. Review.
-
Highly potent dopamine receptor D2 antagonist ONC206 demonstrates anti-tumorigenic activity in endometrial cancer.Am J Cancer Res. 2021 Nov 15;11(11):5374-5387. eCollection 2021. Am J Cancer Res. 2021. PMID: 34873466 Free PMC article.
References
-
- Hamilton C.A., Cheung M.K., Osann K., Chen L., Teng N.N., Longacre T.A., Powell M.A., Hendrickson M.R., Kapp D.S., Chan J.K. Uterine papillary serous and clear cell carcinomas predict for poorer survival compared to grade 3 endometrioid corpus cancers. Br. J. Cancer. 2006;94:642–646. doi: 10.1038/sj.bjc.6603012. - DOI - PMC - PubMed
-
- Berton-Rigaud D., Devouassoux-Shisheboran M., Ledermann J.A., Leitao M.M., Powell M.A., Poveda A., Beale P., Glasspool R., Creutzberg C.L., Harter P., et al. Gynecologic Cancer InterGroup (GCIG) consensus review for uterine and ovarian carcinosarcoma. Int. J. Gynecol. Cancer. 2014;24(Suppl. 3):S55–S60. doi: 10.1097/IGC.0000000000000228. - DOI - PubMed
-
- Matei D., Filiaci V., Randall M.E., Mutch D., Steinhoff M.M., DiSilvestro P.A., Moxley K.M., Kim Y.M., Powell M.A., O’Malley D.M., et al. Adjuvant Chemotherapy plus Radiation for Locally Advanced Endometrial Cancer. N. Engl. J. Med. 2019;380:2317–2326. doi: 10.1056/NEJMoa1813181. - DOI - PMC - PubMed
Grants and funding
LinkOut - more resources
Full Text Sources
Miscellaneous

