

The Various Oximetric Techniques Used for the Evaluation of Blood Oxygenation
- PMID: 32867184
- PMCID: PMC7506757
- DOI: 10.3390/s20174844
The Various Oximetric Techniques Used for the Evaluation of Blood Oxygenation
Abstract
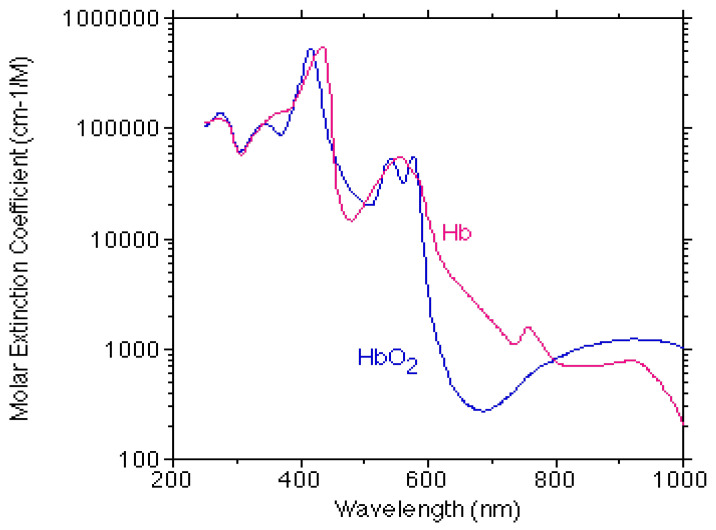
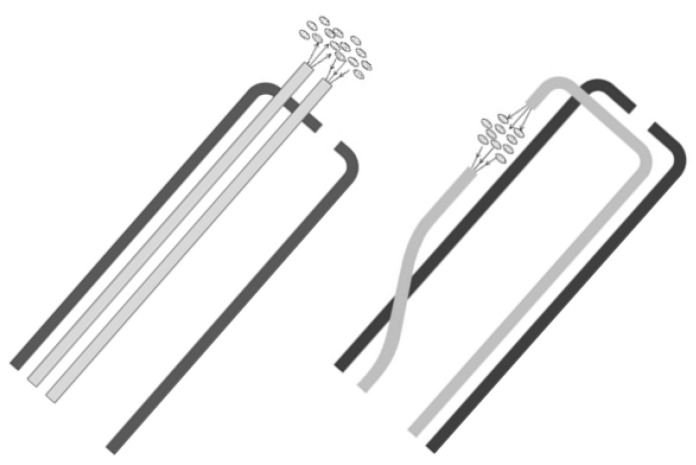
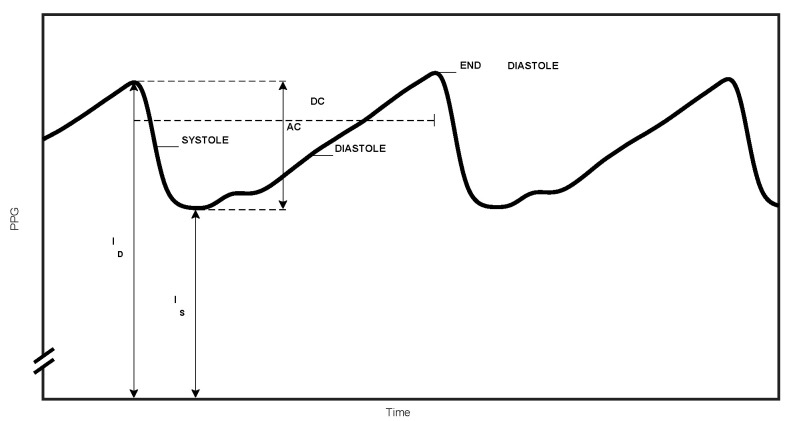
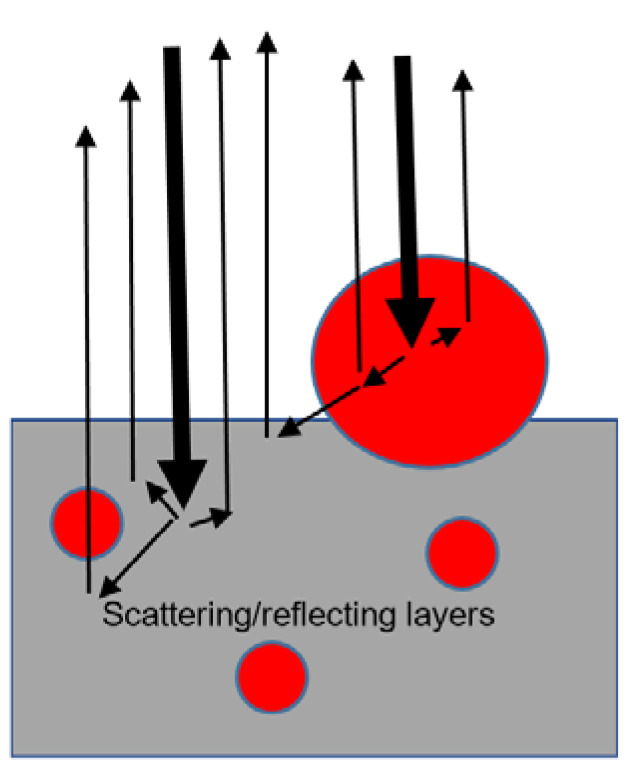
Adequate oxygen delivery to a tissue depends on sufficient oxygen content in arterial blood and blood flow to the tissue. Oximetry is a technique for the assessment of blood oxygenation by measurements of light transmission through the blood, which is based on the different absorption spectra of oxygenated and deoxygenated hemoglobin. Oxygen saturation in arterial blood provides information on the adequacy of respiration and is routinely measured in clinical settings, utilizing pulse oximetry. Oxygen saturation, in venous blood (SvO2) and in the entire blood in a tissue (StO2), is related to the blood supply to the tissue, and several oximetric techniques have been developed for their assessment. SvO2 can be measured non-invasively in the fingers, making use of modified pulse oximetry, and in the retina, using the modified Beer-Lambert Law. StO2 is measured in peripheral muscle and cerebral tissue by means of various modes of near infrared spectroscopy (NIRS), utilizing the relative transparency of infrared light in muscle and cerebral tissue. The primary problem of oximetry is the discrimination between absorption by hemoglobin and scattering by tissue elements in the attenuation measurement, and the various techniques developed for isolating the absorption effect are presented in the current review, with their limitations.
Keywords: accuracy; blood oxygenation; light absorption spectra; modified Beer–Lambert Law; near infrared spectroscopy; oximetry; oxygen saturation; oxygenated and deoxygenated hemoglobin; photoplethysmography; pulse oximetry.
Conflict of interest statement
The authors declare no conflict of interest.
Figures
Similar articles
-
Pulse oximetry in the pulmonary tissue for the non-invasive measurement of mixed venous oxygen saturation.Med Hypotheses. 2013 Aug;81(2):293-6. doi: 10.1016/j.mehy.2013.04.026. Epub 2013 May 13. Med Hypotheses. 2013. PMID: 23679994
-
Photoplethysmography for blood volumes and oxygenation changes during intermittent vascular occlusions.J Clin Monit Comput. 2018 Jun;32(3):447-455. doi: 10.1007/s10877-017-0030-2. Epub 2017 May 25. J Clin Monit Comput. 2018. PMID: 28547651 Free PMC article.
-
[Regional transcranial oximetry with near infrared spectroscopy (NIRS) in comparison with measuring oxygen saturation in the jugular bulb in infants and children for monitoring cerebral oxygenation].Biomed Tech (Berl). 2000 Nov;45(11):328-32. doi: 10.1515/bmte.2000.45.11.328. Biomed Tech (Berl). 2000. PMID: 11155535 German.
-
Use of near-infrared spectroscopy (NIRS) in cerebral tissue oxygenation monitoring in neonates.Biomed Pap Med Fac Univ Palacky Olomouc Czech Repub. 2017 Jun;161(2):128-133. doi: 10.5507/bp.2017.012. Epub 2017 Mar 30. Biomed Pap Med Fac Univ Palacky Olomouc Czech Repub. 2017. PMID: 28360433 Review.
-
Near-infrared oximetry of the brain.Prog Neurobiol. 1999 Aug;58(6):541-60. doi: 10.1016/s0301-0082(98)00093-8. Prog Neurobiol. 1999. PMID: 10408656 Review.
Cited by
-
Determination of tissue oxygen saturation by diffuse reflectance spectroscopy.J Biomed Opt. 2023 Sep;28(9):095002. doi: 10.1117/1.JBO.28.9.095002. Epub 2023 Sep 28. J Biomed Opt. 2023. PMID: 37780203 Free PMC article.
-
Intraoperative application of regional cerebral oxygen saturation monitoring for geriatric patients in China: a survey.Front Med (Lausanne). 2023 Sep 7;10:1165821. doi: 10.3389/fmed.2023.1165821. eCollection 2023. Front Med (Lausanne). 2023. PMID: 37746075 Free PMC article.
-
Near-ultraviolet Light Dermoscopy for Identification of Pigmented Skin Tumours.Acta Derm Venereol. 2023 Feb 28;103:adv00876. doi: 10.2340/actadv.v103.5302. Acta Derm Venereol. 2023. PMID: 36852578 Free PMC article. No abstract available.
-
Correlating stroke risk with non-invasive cerebrovascular perfusion dynamics using a portable speckle contrast optical spectroscopy laser device.Biomed Opt Express. 2024 Sep 30;15(10):6083-6097. doi: 10.1364/BOE.534796. eCollection 2024 Oct 1. Biomed Opt Express. 2024. PMID: 39421763 Free PMC article.
-
Right-angled vessel characteristics in different stages of type 2 macular telangiectasia (MacTel).Eye (Lond). 2024 Apr;38(6):1162-1167. doi: 10.1038/s41433-023-02853-w. Epub 2023 Nov 27. Eye (Lond). 2024. PMID: 38012385 Free PMC article.
References
-
- Osypka M., Soleymani S., Seri I., Noori S. Assessment of Cardiac output in neonates: Techniques using the Fick principle, pulse wave analysis and electrical impedance. In: Kleinman C.S., Seri I., editors. Hemodynamics and Cardiology: Neonatology Questions and Controversies. 2nd ed. Elsevier Saunders; Philadelphia, PA, USA: 2012. pp. 125–149. Chapter 6.
-
- Prahl S. The absorption spectra of the oxygenated and deoxygenated hemoglobin molecules. [(accessed on 21 January 2014)]; Available online: http://omlc.ogi.edu/spectra/hemoglobin/index.html.
-
- Zuzak K.J., Schaeberle M.D., Gladwin M.T., Cannon R.O., 3rd, Levin I.W. Noninvasive Determination of Spatially Resolved and Time-Resolved Tissue Perfusion in Humans During Nitric Oxide Inhibition and Inhalation by Use of a Visible-Reflectance Hyperspectral Imaging Technique. Circulation. 2001;104:2905–2910. doi: 10.1161/hc4901.100525. - DOI - PubMed
Publication types
MeSH terms
Substances
LinkOut - more resources
Full Text Sources
