

Investigating Glioblastoma Response to Hypoxia
- PMID: 32867190
- PMCID: PMC7555589
- DOI: 10.3390/biomedicines8090310
Investigating Glioblastoma Response to Hypoxia
Abstract
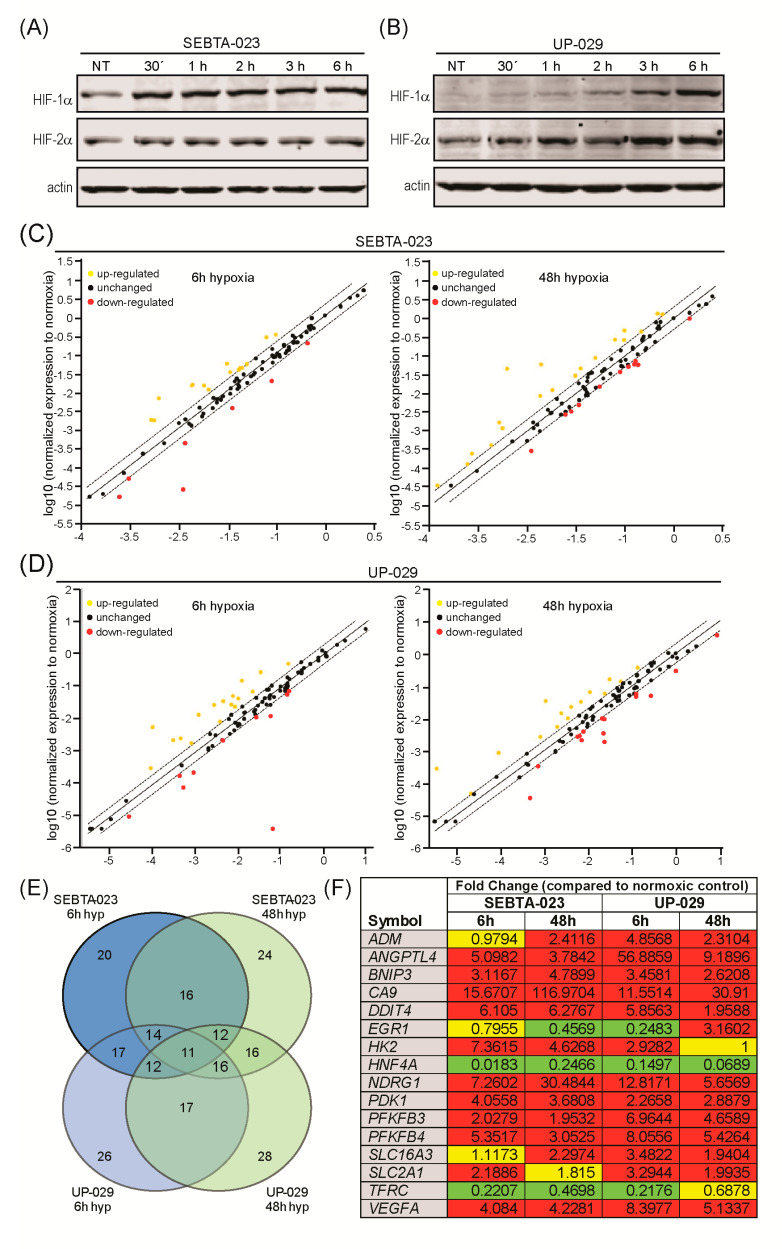
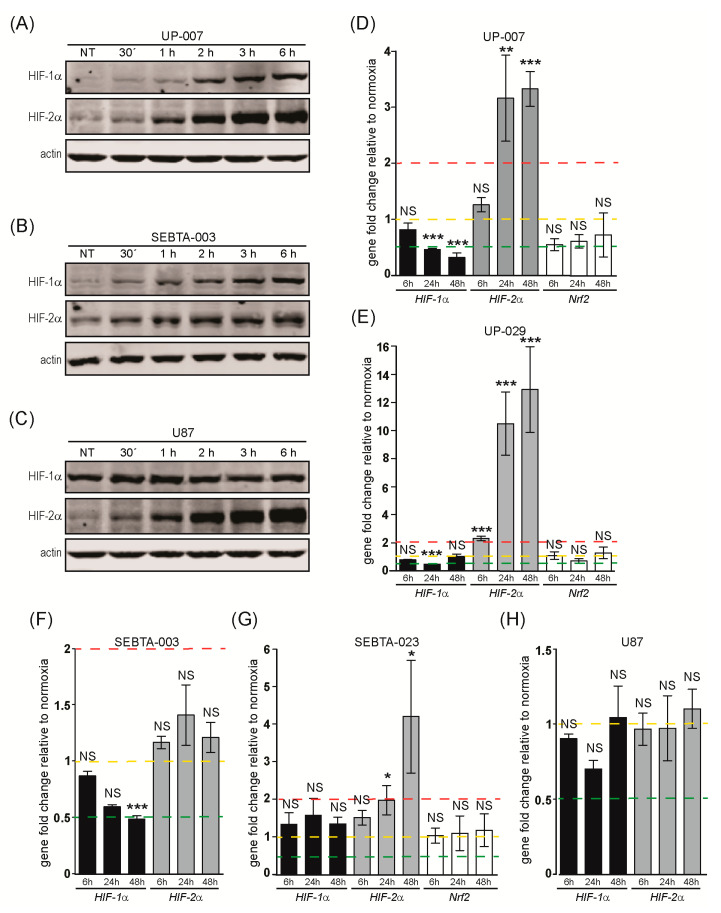
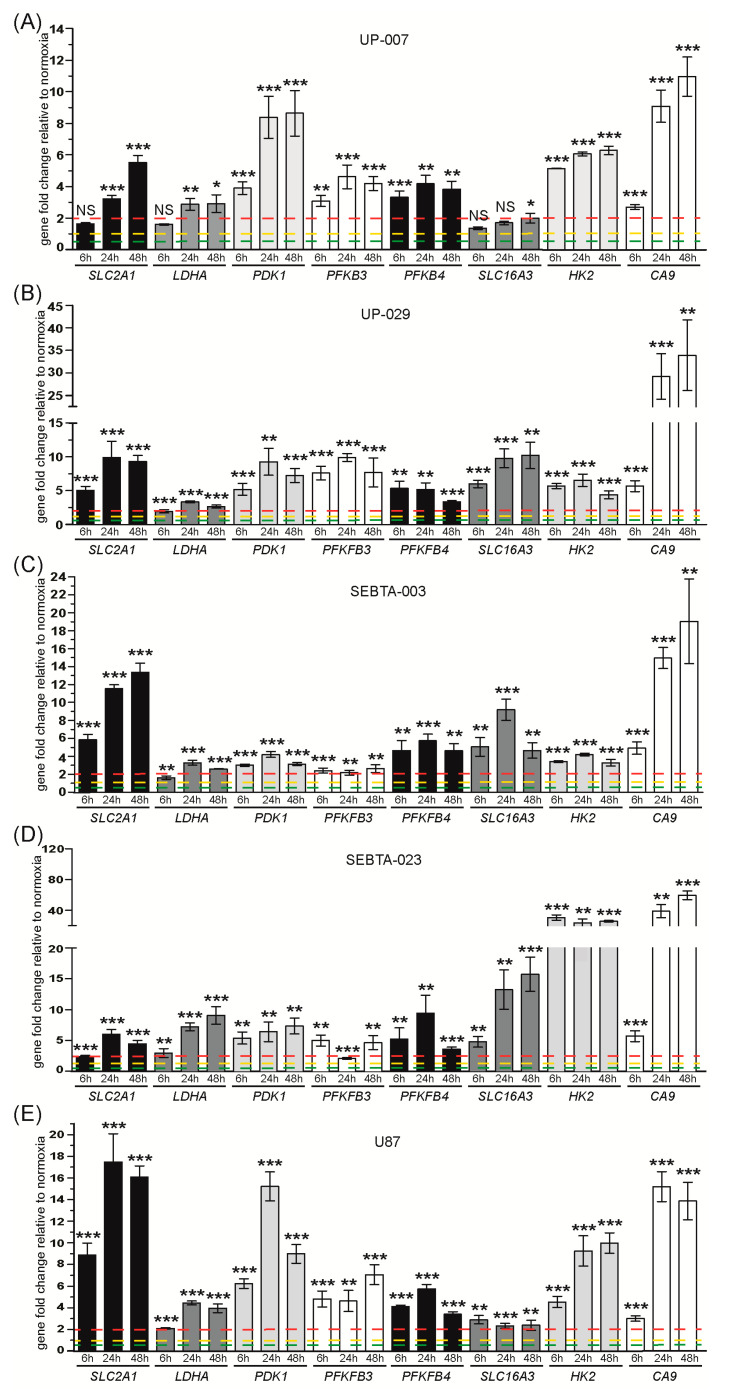
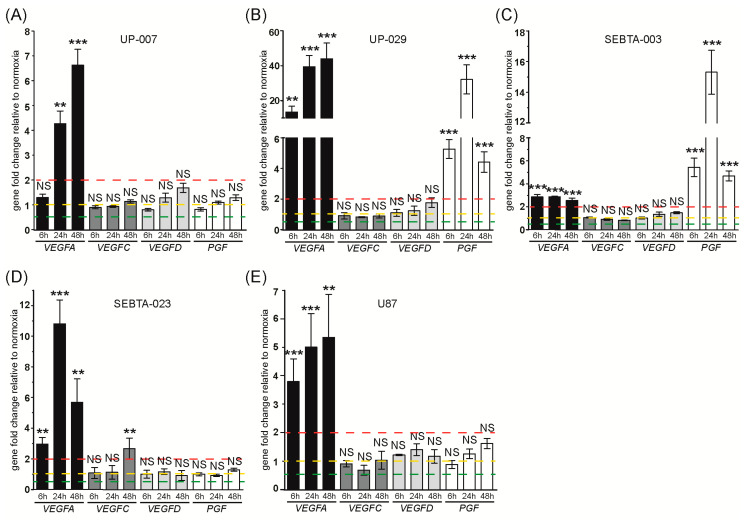
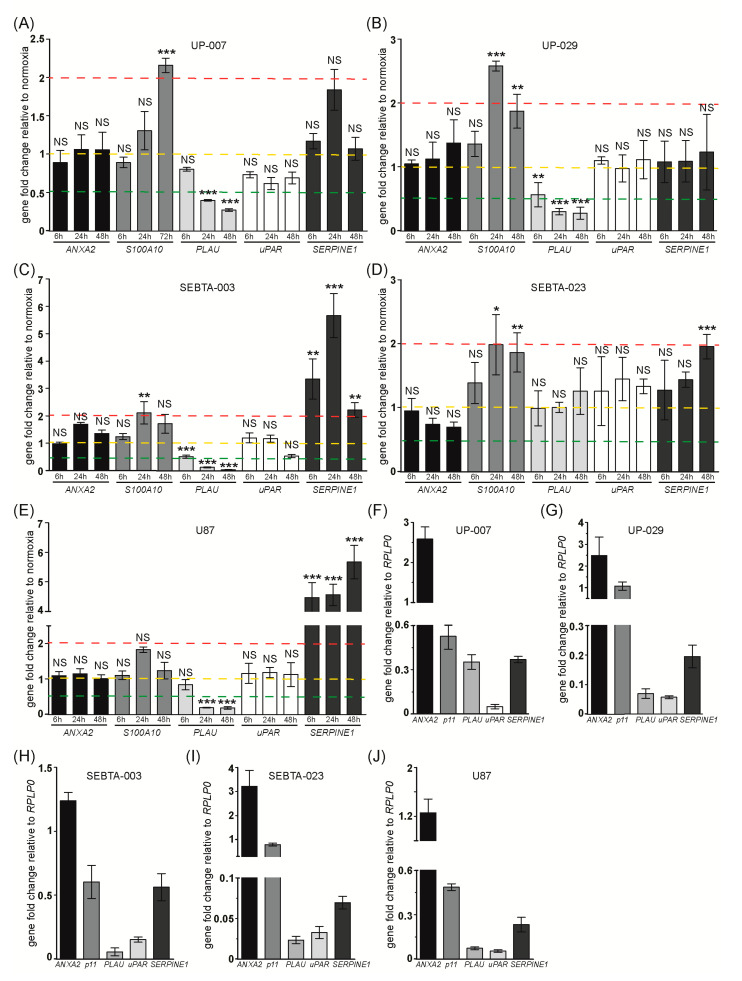
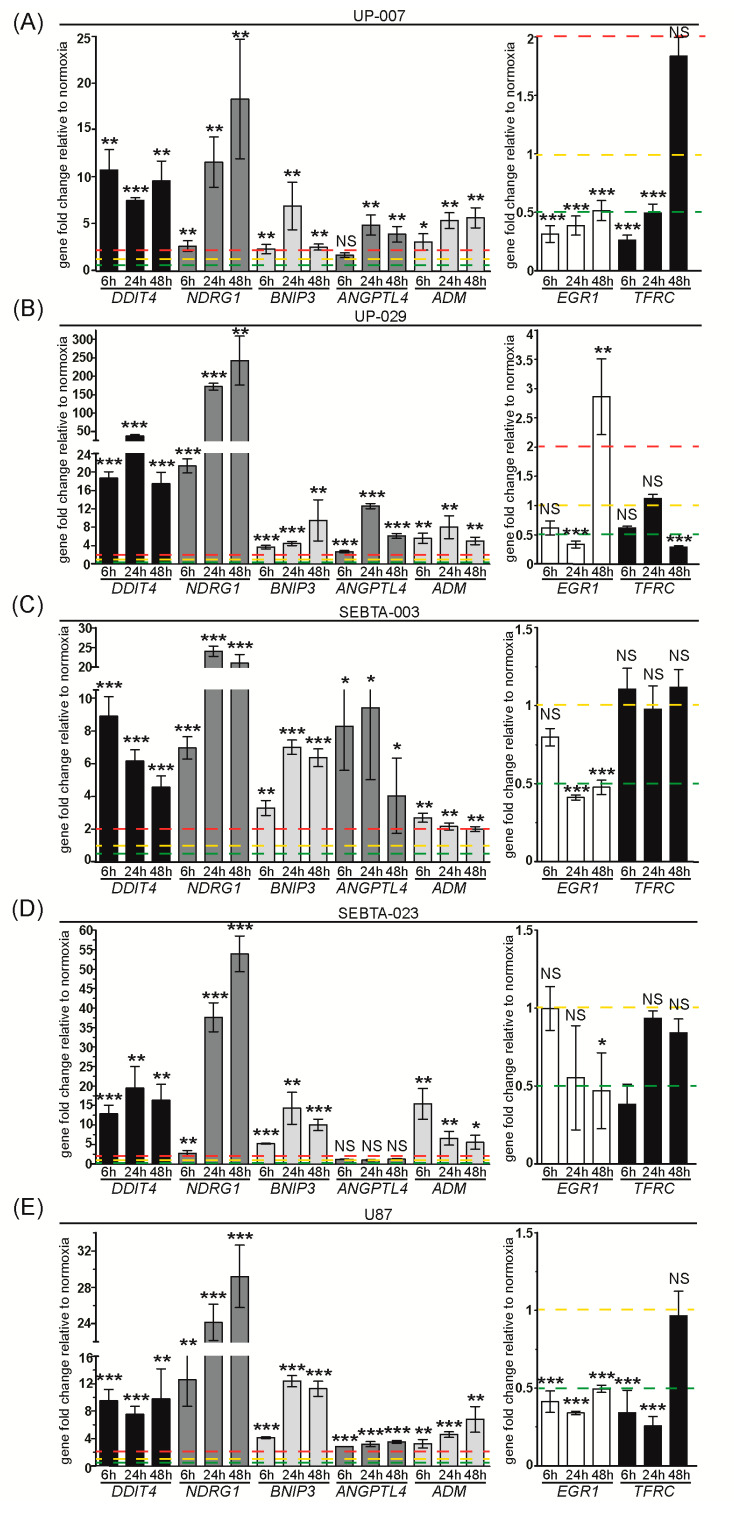
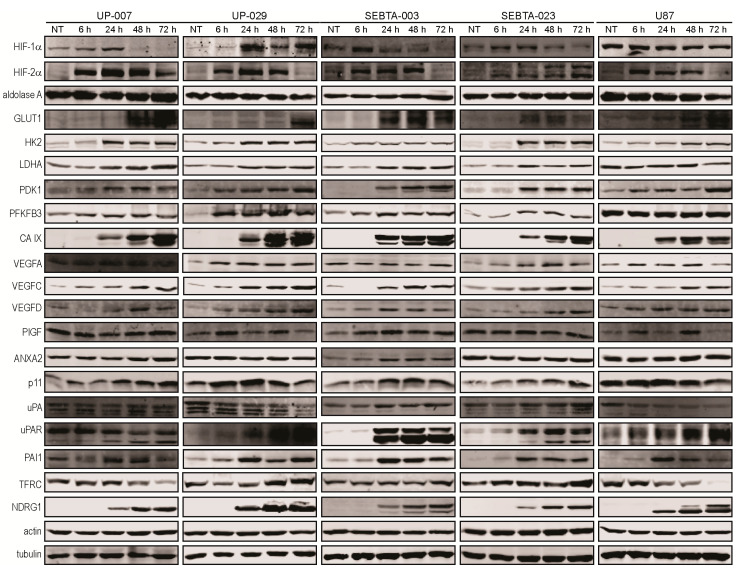
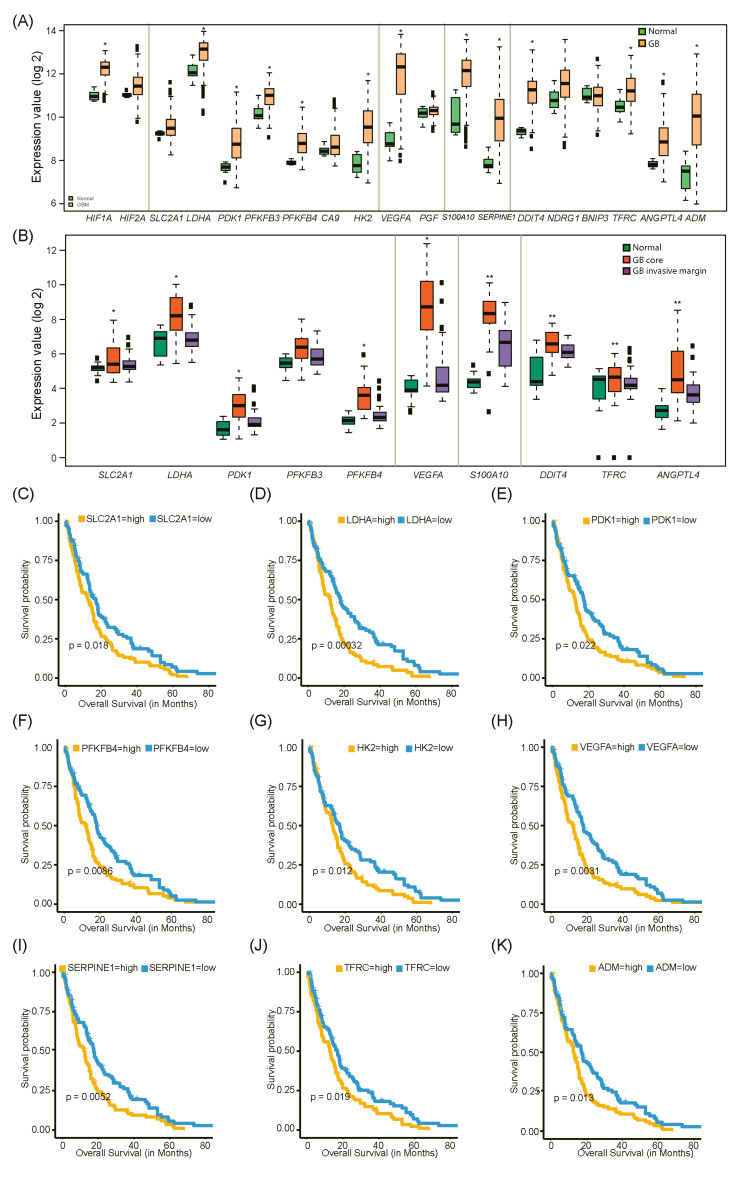
Glioblastoma (GB) is the most common and deadly type of primary malignant brain tumor with an average patient survival of only 15-17 months. GBs typically have hypoxic regions associated with aggressiveness and chemoresistance. Using patient derived GB cells, we characterized how GB responds to hypoxia. We noted a hypoxia-dependent glycolytic switch characterized by the up-regulation of HK2, PFKFB3, PFKFB4, LDHA, PDK1, SLC2A1/GLUT-1, CA9/CAIX, and SLC16A3/MCT-4. Moreover, many proangiogenic genes and proteins, including VEGFA, VEGFC, VEGFD, PGF/PlGF, ADM, ANGPTL4, and SERPINE1/PAI-1 were up-regulated during hypoxia. We detected the hypoxic induction of invasion proteins, including the plasminogen receptor, S100A10, and the urokinase plasminogen activator receptor, uPAR. Furthermore, we observed a hypoxia-dependent up-regulation of the autophagy genes, BNIP-3 and DDIT4 and of the multi-functional protein, NDRG1 associated with GB chemoresistance; and down-regulation of EGR1 and TFRC (Graphical abstract). Analysis of GB patient cohorts' revealed differential expression of these genes in patient samples (except SLC16A3) compared to non-neoplastic brain tissue. High expression of SLC2A1, LDHA, PDK1, PFKFB4, HK2, VEGFA, SERPINE1, TFRC, and ADM was associated with significantly lower overall survival. Together these data provide important information regarding GB response to hypoxia which could support the development of more effective treatments for GB patients.
Keywords: autophagy; glioblastoma; glycolysis; hypoxia; invasion; tumor angiogenesis.
Conflict of interest statement
The authors declare no conflict of interest.
Figures
Similar articles
-
Expression and hypoxia-responsiveness of 6-phosphofructo-2-kinase/fructose-2,6-bisphosphatase 4 in mammary gland malignant cell lines.Acta Biochim Pol. 2005;52(4):881-8. Epub 2005 Jul 11. Acta Biochim Pol. 2005. PMID: 16025159
-
The Impact of A3AR Antagonism on the Differential Expression of Chemoresistance-Related Genes in Glioblastoma Stem-like Cells.Pharmaceuticals (Basel). 2024 Apr 30;17(5):579. doi: 10.3390/ph17050579. Pharmaceuticals (Basel). 2024. PMID: 38794149 Free PMC article.
-
Prognostic Value of PFKFB3 to PFKFB4 mRNA Ratio in Patients With Primary Glioblastoma (IDH-Wildtype).J Neuropathol Exp Neurol. 2019 Sep 1;78(9):865-870. doi: 10.1093/jnen/nlz067. J Neuropathol Exp Neurol. 2019. PMID: 31369092
-
Cancer stem cell molecular reprogramming of the Warburg effect in glioblastomas: a new target gleaned from an old concept.CNS Oncol. 2016;5(2):101-8. doi: 10.2217/cns-2015-0006. Epub 2016 Mar 21. CNS Oncol. 2016. PMID: 26997129 Free PMC article. Review.
-
Modulation of carbonic anhydrase 9 (CA9) in human brain cancer.Curr Pharm Des. 2010;16(29):3288-99. doi: 10.2174/138161210793429788. Curr Pharm Des. 2010. PMID: 20819065 Review.
Cited by
-
Natural killer cell awakening: unleash cancer-immunity cycle against glioblastoma.Cell Death Dis. 2022 Jul 8;13(7):588. doi: 10.1038/s41419-022-05041-y. Cell Death Dis. 2022. PMID: 35803912 Free PMC article. Review.
-
A Tumor Suppressor Gene, N-myc Downstream-Regulated Gene 1 (NDRG1), in Gliomas and Glioblastomas.Brain Sci. 2022 Apr 3;12(4):473. doi: 10.3390/brainsci12040473. Brain Sci. 2022. PMID: 35448004 Free PMC article. Review.
-
Unveiling a Novel Glioblastoma Deep Molecular Profiling: Insight into the Cancer Cell Differentiation-Related Mechanisms.ACS Omega. 2025 Mar 8;10(10):10230-10250. doi: 10.1021/acsomega.4c09586. eCollection 2025 Mar 18. ACS Omega. 2025. PMID: 40124014 Free PMC article.
-
Effect of PFKFB4 on the Prognosis and Immune Regulation of NSCLC and Its Mechanism.Int J Gen Med. 2022 Aug 2;15:6341-6353. doi: 10.2147/IJGM.S369126. eCollection 2022. Int J Gen Med. 2022. PMID: 35942289 Free PMC article.
-
Hypoxia: The Cornerstone of Glioblastoma.Int J Mol Sci. 2021 Nov 22;22(22):12608. doi: 10.3390/ijms222212608. Int J Mol Sci. 2021. PMID: 34830491 Free PMC article. Review.
References
-
- Gilbert M.R., Wang M., Aldape K.D., Stupp R., Hegi M.E., Jaeckle K.A., Armstrong T.S., Wefel J.S., Won M., Blumenthal D.T., et al. Dose-dense temozolomide for newly diagnosed glioblastoma: A randomized phase III clinical trial. J. Clin. Oncol. 2013;31:4085–4091. doi: 10.1200/JCO.2013.49.6968. - DOI - PMC - PubMed
-
- Stupp R., Hegi M.E., Mason W.P., van den Bent M.J., Taphoorn M.J., Janzer R.C., Ludwin S.K., Allgeier A., Fisher B., Belanger K., et al. European Organisation for Research and Treatment of Cancer Brain Tumour and Radiation Oncology Groups; National Cancer Institute of Canada Clinical Trials Group Effects of radiotherapy with concomitant and adjuvant temozolomide versus radiotherapy alone on survival in glioblastoma in a randomised phase III study: 5-year analysis of the EORTC-NCIC trial. Lancet Oncol. 2009;10:459–466. doi: 10.1016/S1470-2045(09)70025-7. - DOI - PubMed
-
- Stupp R., Mason W.P., van den Bent M.J., Weller M., Fisher B., Taphoorn M.J.B., Belanger K., Brandes A.A., Marosi C., Bogdahn U., et al. European Organisation for Research and Treatment of Cancer Brain Tumor and Radiotherapy Groups; National Cancer Institute of Canada Clinical Trials Group Radiotherapy plus concomitant and adjuvant temozolomide for glioblastoma. N. Engl. J. Med. 2005;352:987–996. doi: 10.1056/NEJMoa043330. - DOI - PubMed
Grants and funding
- IF/00614/2014/Foundation for Science and Technology (FCT), Portugal
- IF/00614/2014/CP12340006/Foundation for Science and Technology (FCT), Portugal
- UID/BIM/04773/2013CBMR1334/Foundation for Science and Technology (FCT), Portugal
- 2017-1-PT01-KA103-035561/ERASMUS fellowship
- AMI and IDEFI REMIS financial instruments/Erasmus+ EU funds and the University Rouen-Normandy
LinkOut - more resources
Full Text Sources
Miscellaneous
